Free with trial Incidence traffic sign on blue sky background. Analysis decrease illustrations Incidence traffic sign on blue sky
Free with trial A financial graph depicting a downward trend with a red arrow, blue bar chart, and white line graph on a dark blue grid background. Ideal for illustrating market decline, revenue loss, or negative performance in business, finance, and economic presentations. Analysis decrease illustrations Declining Financial Graph Red Arrow and Bar Chart on Dark Grid Background. A financial graph depicting a downward trend with a red arrow, blue bar chart, and white line graph on a dark blue grid background. Ideal for illustrating market decline, revenue loss, or negative performance in business, finance, and economic presentations.
Free with trial An illustration of a red downward trending arrow icon in a frame is set against a soft, pastel pink backdrop. Analysis decrease illustrations Downward Trend Arrow Icon on Pink Background Representing Financial Loss. An illustration of a red downward trending arrow icon in a frame is set against a soft, pastel pink backdrop.
Free with trial Financial trading chart displaying red bearish candlestick patterns and decreasing stock values, illustrating a market downturn, economic loss, and recession risk. Analysis decrease illustrations Candlestick chart showing stock market financial recession and loss. Financial trading chart displaying red bearish candlestick patterns and decreasing stock values, illustrating a market downturn, economic loss, and recession risk
Free with trial Downward trending bar graph with a black arrow, representing losses. Analysis decrease vectors Downward trending bar graph with a black arrow, representing losses
Free with trial Declining Bar Graph with Arrow Showing Increase and Downward Trend. Analysis decrease vectors Declining Bar Graph with Arrow Showing Increase and Downward Trend
Free with trial Business loss on white paper background. Analysis decrease illustrations Business loss on white paper
Free with trial Red falling arrow and desperate businessman silhouette representing stock market crash, investment loss and financial crisis. Analysis decrease illustrations Stock market crash showing a desperate businessman and red falling arrow on digital screen. Red falling arrow and desperate businessman silhouette representing stock market crash, investment loss and financial crisis
Free with trial Colorful bar graph with downward trend, business concept illustration. Analysis decrease vectors Colorful bar graph with downward trend, business concept illustration
Free with trial Displaying financial chart at digital interface, with blue bars, two line graphs, red decline arrow. Finance, data, analytics, dashboard, technology, investment, digital. Analysis decrease illustrations Displaying financial chart at digital interface, with blue bars, two line graphs, red decline arrow
Free with trial Displaying dashboard on screen showing red arrow trending down over bar chart and colorful lines. Analytics, visualization, data, performance, digital, insight, metrics. Analysis decrease illustrations Displaying dashboard on screen showing red arrow trending down over bar chart and colorful lines
Free with trial Indicating negative trend red arrow slanting down on finance dashboard, with bars and data points. Financial, analytics, data visualization, technology, digital interface, dashboard, statistical. Analysis decrease illustrations Indicating negative trend red arrow slanting down on finance dashboard, with bars and data points
Free with trial Stock market crash showing market downturn with red graph and percentage sign. Analysis decrease illustrations Red graph showing a stock market crash and downturn with percentage sign. Stock market crash showing market downturn with red graph and percentage sign
Free with trial Green arrow on financial graph with terrified cartoon face reacting to a sharp downward trend. Concept of market crash or business loss. Analysis decrease illustrations Green arrow on financial graph with terrified cartoon face reacting to a sharp downward trend
Free with trial Female agent wearing a headset with laptop, gesturing at a downward graph. Ideal for customer support, analytics, communication, sales decrease, remote work, problem-solving, simple flat metaphor. Analysis decrease vectors Customer support agent analyzing a decline graph using a laptop during a video meeting. Female agent wearing a headset with laptop, gesturing at a downward graph. Ideal for customer support, analytics, communication, sales decrease, remote work, problem-solving, simple flat metaphor
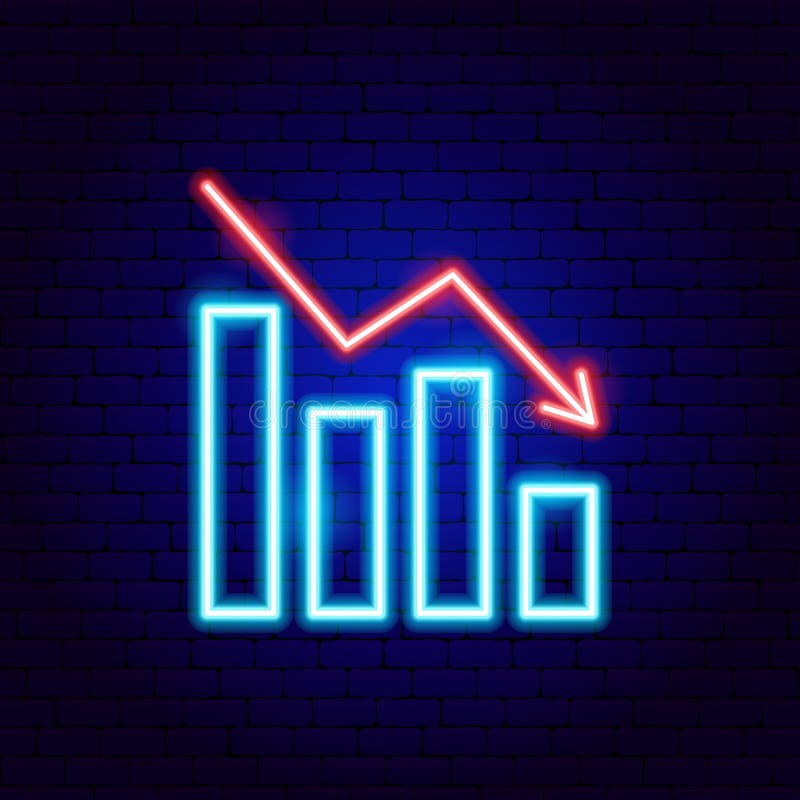
Free with trial Loss Graph Neon Sign. Vector Illustration of Analytics Data Symbol. Analysis decrease vectors Loss Graph Neon Sign
Free with trial Several red, blue, and green arrows pointing in different directions are on a light yellow square grid. Some arrows point up, while others point down. This represents various economic trends. Analysis decrease illustrations Colorful Painted Arrows Move up and Down on Graph Paper Background. Several red, blue, and green arrows pointing in different directions are on a light yellow square grid. Some arrows point up, while others point down. This represents various economic trends.
Free with trial Line graph with a green line and a red dot on top. The red dot is located at the top left corner of the graph. Analysis decrease illustrations Graph with a green line and a red dot
Free with trial A conceptual image representing financial loss, economic downturn, or business failure. A person's hands are holding and seemingly guiding a glowing red line graph that is pointing sharply downwards. The arrow at the end confirms the negative trend. The neutral background keeps the focus on this clear symbol of decline. Generative AI. Analysis decrease illustrations Two hands holding a glowing red line graph that is trending downwards. A conceptual image representing financial loss, economic downturn, or business failure. A person's hands are holding and seemingly guiding a glowing red line graph that is pointing sharply downwards. The arrow at the end confirms the negative trend. The neutral background keeps the focus on this clear symbol of decline. Generative AI.
Free with trial Frozen graph showing a downward trend. Cold economy concept, financial crisis, declining business, and cold market conditions. Analysis decrease illustrations Frozen graph showing a downward trend. Cold economy concept, financial crisis, declining business
Free with trial A bar graph with descending blue, yellow, and red bars, accompanied by a downward-pointing arrow, symbolizes economic decline or negative trends on a clean white background. Analysis decrease illustrations Colorful Bar Graph with Downward Arrow Illustrating Economic Decline. A bar graph with descending blue, yellow, and red bars, accompanied by a downward-pointing arrow, symbolizes economic decline or negative trends on a clean white background
Free with trial Red stock market investment decline chart. Analysis decrease vectors Red stock market investment decline chart
Free with trial Red stock market investment decline chart. Analysis decrease vectors Red stock market investment decline chart
Free with trial An upward trending line graph showcases data points increasing, symbolizing growth and progress. The visual represents success, development, and positive statistics. Analysis decrease vectors Positive Trend Graph, Data Points Rising Upward. An upward trending line graph showcases data points increasing, symbolizing growth and progress. The visual represents success, development, and positive statistics.
Free with trial Computer screen displaying a webinar with a presenter explaining graphs and charts, recording indicators, audio, and HD video tags. Ideal for e-learning, remote work, business, analytics. Analysis decrease vectors Online Webinar on Business Metrics with Recording and Data Analytics Representation. Computer screen displaying a webinar with a presenter explaining graphs and charts, recording indicators, audio, and HD video tags. Ideal for e-learning, remote work, business, analytics
Free with trial Red sad face beside a line graph showing a downward trend and a bar graph. Ideal for business loss, economic decline, performance issues, challenges, setbacks, analytics, trends. Simple flat metaphor. Analysis decrease vectors Declining Chart with Sad Face and Bar Graph Representing Negative Trend and Challenges. Red sad face beside a line graph showing a downward trend and a bar graph. Ideal for business loss, economic decline, performance issues, challenges, setbacks, analytics, trends. Simple flat metaphor
Free with trial The Price-to-Earnings (P E) ratio, and how is it used in stock valuation. Analysis decrease illustrations Financial Market Data Display: Red Stock Market Trend. the Price-to-Earnings (P E) ratio, and how is it used in stock valuation
Free with trial A digital illustration of a declining line graph with a large downward arrow and a coin at the bottom, representing financial decline or market loss, suitable for economic and business contexts. Analysis decrease illustrations Downward Trending Graph with Falling Line Chart and Coin Illustration. A digital illustration of a declining line graph with a large downward arrow and a coin at the bottom, representing financial decline or market loss, suitable for economic and business contexts
Free with trial Blue arrow turning downwards next to Euro coin in a simple linear style. Ideal for finance, economics, savings, currency, investment, recession, strategy concepts. A simple flat metaphor. Analysis decrease vectors Downward arrow pointing to a Euro coin depicting financial loss and direction shift. Blue arrow turning downwards next to Euro coin in a simple linear style. Ideal for finance, economics, savings, currency, investment, recession, strategy concepts. A simple flat metaphor
Free with trial This image showcases a bar graph depicting rising factory production, generated by AI, superimposed on a blurred background of a bustling industrial facility. The upward trend suggests growth and efficiency in the manufacturing process, highlighting the positive impact of modern technology. Analysis decrease illustrations Factory Production Increase. This image showcases a bar graph depicting rising factory production, generated by AI, superimposed on a blurred background of a bustling industrial facility. The upward trend suggests growth and efficiency in the manufacturing process, highlighting the positive impact of modern technology.
Free with trial Black and white icon showing particles falling down a slope with arrows indicating decline. Analysis decrease illustrations Black and white icon illustrating deleveraging with falling particles and arrows debt reduction. Black and white icon showing particles falling down a slope with arrows indicating decline
Free with trial A graphic illustrating declining gas prices, featuring a fuel pump and a downward trending red line graph, isolated on a white background. Analysis decrease illustrations Falling gas prices graph with fuel pump isolated on white background. A graphic illustrating declining gas prices, featuring a fuel pump and a downward trending red line graph, isolated on a white background
Free with trial Thermometer indicating 30 percent, symbolizing progress, achievement, temperature measurement, or goal completion within a specific range. Analysis decrease vectors Thermometer indicating 30 percent, symbolizing progress, achievement, temperature measurement, or goal completion within
Free with trial Outline financial tax icons set featuring a book, magnifying glass, money, documents, and charts for financial accounting and business concept design. Analysis decrease vectors Outline financial tax icons set featuring a book, magnifying glass, money, documents, and charts for financial
Free with trial A striking 3D-rendered image featuring a blue hand emerging from the left side, gripping a red zigzag arrow pointing downward against a solid light blue background. The arrow symbolizes a decline in metrics such as financial performance, market trends, or business growth. This image is ideal for use in economic reports, editorial content, business presentations, and visual storytelling focused on loss, downturns, or negative growth. The clean design and bold color contrast make it a powerful metaphor for financial challenges and strategic analysis. Analysis decrease illustrations . A striking 3D-rendered image featuring a blue hand emerging from the left side, gripping a red zigzag arrow pointing downward against a solid light blue background. The arrow symbolizes a decline in metrics such as financial performance, market trends, or business growth. This image is ideal for use in economic reports, editorial content, business presentations, and visual storytelling focused on loss, downturns, or negative growth. The clean design and bold color contrast make it a powerful metaphor for financial challenges and strategic analysis.
Free with trial This conceptual image depicts an industrial factory with a declining graph, symbolizing economic downturn, industrial decline, or environmental impact. The paper cutout style adds a unique visual appeal. The image can be used to represent concepts related to business, finance, economics, manufacturing, environmental concerns, and the impact of industrial activity. It is suitable for presentations, reports, articles, and educational materials. Analysis decrease illustrations Industrial Decline and Economic Downturn Concept. This conceptual image depicts an industrial factory with a declining graph, symbolizing economic downturn, industrial decline, or environmental impact. The paper cutout style adds a unique visual appeal. The image can be used to represent concepts related to business, finance, economics, manufacturing, environmental concerns, and the impact of industrial activity. It is suitable for presentations, reports, articles, and educational materials.
Free with trial A simple black and white illustration of a bar chart and a line graph showing business growth trends, isolated on a white background. Analysis decrease vectors Business growth bar chart and line graph isolated on white background. A simple black and white illustration of a bar chart and a line graph showing business growth trends, isolated on a white background
Free with trial Sad face symbolizing dissatisfaction or issues, with data point focus and declining performance graph. Ideal for business analytics, performance drops, feedback, emotions, troubleshooting, reporting. Analysis decrease illustrations Sad face with declining graph and focus on data highlighting underperformance and issues. Sad face symbolizing dissatisfaction or issues, with data point focus and declining performance graph. Ideal for business analytics, performance drops, feedback, emotions, troubleshooting, reporting
Free with trial Loss Arrow 3D Icon, Isolated on White Background. Analysis decrease illustrations Loss Arrow 3D Icon
Free with trial Loss Arrow 3D Icon, Isolated on White Background. Analysis decrease illustrations Loss Arrow 3D Icon
Free with trial Colorful line graph illustrating growth and decline over time, with variously colored data points on a dark background, visualizing financial performance and trends. Analysis decrease vectors Colorful line graph illustrating growth and decline over time, with variously colored data points on a dark background
Free with trial Growth and decline arrow graph icon. Up and down arrows symbol illustration. Analysis decrease vectors Growth and decline arrow graph icon. Up and down arrows symbol
Free with trial Illustration displays a black graph showing a downward trend indicated by a graph, arrow, and clock symbol on a stark white background, implying a sense of failure and loss. Analysis decrease vectors Black Symbol Graph Downtrend with Time on White Backdrop Shows Decline. Illustration displays a black graph showing a downward trend indicated by a graph, arrow, and clock symbol on a stark white background, implying a sense of failure and loss.
Free with trial Week over week on white paper background. Analysis decrease illustrations Week over week on white paper
Free with trial Year over year on white paper background. Analysis decrease illustrations Year over year on white paper
Free with trial This image displays a man holding house icons with financial symbols above, illustrating real estate investment. Perfect for conveying property market, financial growth, and home ownership concepts. Ideal for finance and investment related projects. Analysis decrease illustrations Real estate investment concept with houses and financial symbols on hand. This image displays a man holding house icons with financial symbols above, illustrating real estate investment. Perfect for conveying property market, financial growth, and home ownership concepts. Ideal for finance and investment related projects
Free with trial A digital financial chart shows upward market trends. The red line and green bars rise against a grid. A gold data network overlay adds depth to the business graphic. Analysis decrease illustrations Growing Financial Chart Shows Market Growth With Data Grid Background. A digital financial chart shows upward market trends. The red line and green bars rise against a grid. A gold data network overlay adds depth to the business graphic.
Free with trial This infographic-style image visually represents business growth and financial performance through various charts and graphs. A line graph illustrates revenue trends with percentage markers, a donut chart displays market share distribution, and a bar chart shows quarterly profit figures. Icons representing data, growth, and reports are subtly integrated into the background, creating a professional and informative visual for business and finance-related content. Analysis decrease illustrations Business Growth and Financial Performance Analytics. This infographic-style image visually represents business growth and financial performance through various charts and graphs. A line graph illustrates revenue trends with percentage markers, a donut chart displays market share distribution, and a bar chart shows quarterly profit figures. Icons representing data, growth, and reports are subtly integrated into the background, creating a professional and informative visual for business and finance-related content.
Free with trial A visual representation of opposing forces, illustrating concepts such as growth versus decline, positive versus negative trends, or upward and downward movement in various contexts like finance or pe. Analysis decrease illustrations Red down arrow and green up arrow isolated on white background. A visual representation of opposing forces, illustrating concepts such as growth versus decline, positive versus negative trends, or upward and downward movement in various contexts like finance or pe
Free with trial This image showcases a collection of finance and government icons, generated by AI, perfect for use in presentations, reports, or websites related to business, economics, or politics. The stylized monochrome design provides a professional and consistent aesthetic. Analysis decrease illustrations Finance and Government Icons
Free with trial A visual representation of a declining financial trend, depicted by a bar chart with a red arrow indicating a downward movement, symbolizing loss or poor performance. Analysis decrease illustrations Bar chart with downward trending red arrow isolated on white background. A visual representation of a declining financial trend, depicted by a bar chart with a red arrow indicating a downward movement, symbolizing loss or poor performance
Free with trial Illustration of a smartphone displaying financial charts and a stack of gold coins with dollar signs. Arrows circulate around the phone, suggesting a cycle of investment and growth. The image represents mobile banking, online trading, and the potential for financial success through digital platforms. Analysis decrease illustrations Mobile Investment and Financial Growth. Illustration of a smartphone displaying financial charts and a stack of gold coins with dollar signs. Arrows circulate around the phone, suggesting a cycle of investment and growth. The image represents mobile banking, online trading, and the potential for financial success through digital platforms.
Free with trial A man is pointing at a stock chart with a sell indicator and a downward arrow, indicating a potential downward trend in the market. Analysis decrease vectors Man pointing at sell chart with downward arrow indicator. a man is pointing at a stock chart with a sell indicator and a downward arrow, indicating a potential downward trend in the market.
Free with trial A colorful graph with the words Net Income written below it. The graph is made up of many different colored lines and dots. Analysis decrease illustrations A colorful graph with the words Net Income written below it
Free with trial Bar graph displays a colorful representation of business growth and financial success with bars increasing in height and vibrant colors on a reflective surface indicating positive trends. Analysis decrease illustrations Colorful bar graph showing growth and success in business and finance on a reflective surface. Bar graph displays a colorful representation of business growth and financial success with bars increasing in height and vibrant colors on a reflective surface indicating positive trends.
Free with trial A 3D render shows a vibrant, pastel-colored bar chart displaying a decreasing trend with blue, yellow, and lavender bars on a transparent background. Analysis decrease vectors Downward trendy pastel bar chart illustration on transparent background. A 3D render shows a vibrant, pastel-colored bar chart displaying a decreasing trend with blue, yellow, and lavender bars on a transparent background.
Free with trial This illustration represents the connection between brain activity and energy levels. The brain is shown with sound waves, symbolizing its function in processing information, while the neuron is depicted with a low battery symbol, indicating a decrease in energy. This image can be used to represent concepts such as mental fatigue, cognitive decline, or the impact of technology on mental health. Analysis decrease vectors Mental health An illustration depicting a brain with sound waves and a neuron with a low battery symbol. This illustration represents the connection between. This illustration represents the connection between brain activity and energy levels. The brain is shown with sound waves, symbolizing its function in processing information, while the neuron is depicted with a low battery symbol, indicating a decrease in energy. This image can be used to represent concepts such as mental fatigue, cognitive decline, or the impact of technology on mental health.
Free with trial A bar graph illustrates a decreasing trend in financial performance, indicated by a red arrow and a dollar symbol. Analysis decrease illustrations Bar chart showing financial decline with downward trend and dollar sign. A bar graph illustrates a decreasing trend in financial performance, indicated by a red arrow and a dollar symbol
Free with trial A golden house miniature sits on a smartphone screen displaying stock market charts, surrounded by stacks of gold coins. This image represents the concept of investing in real estate through mobile apps and online platforms, highlighting the potential for financial growth and digital investment strategies in the property market. Analysis decrease illustrations Real Estate Investment on Mobile. A golden house miniature sits on a smartphone screen displaying stock market charts, surrounded by stacks of gold coins. This image represents the concept of investing in real estate through mobile apps and online platforms, highlighting the potential for financial growth and digital investment strategies in the property market.
Free with trial White Bar Graph Decreasing on Light Blue Background. Analysis decrease illustrations White Bar Graph Decreasing on Light Blue Background
Free with trial Percent word block on white background. Analysis decrease illustrations Percent word block on white
Free with trial Bright, colorful stock chart on dark screen. Fluctuations lines and grid representing data and trends. Stock photo. Analysis decrease illustrations Bright, colorful stock chart on dark screen. Fluctuations lines and grid representing data and trends
Free with trial Annual growth rate on white paper background. Analysis decrease illustrations Annual growth rate on white paper
Free with trial A stacked area chart performance data with distinct colored segments in a rainbow gradient. The vertical axis percentages from 0% to 170%, and the horizontal axis percentage values. Analysis decrease illustrations Stacked area chart showing level performance with rainbow colors and percentage axis graph data. A stacked area chart performance data with distinct colored segments in a rainbow gradient. The vertical axis percentages from 0% to 170%, and the horizontal axis percentage values
Free with trial Conceptual financial downturn graphic representing bankruptcy, market volatility, economic recession, investment collapse, negative financial cycles, declining stability uncertain economic conditions. Analysis decrease illustrations Conceptual financial downturn graphic representing bankruptcy, market volatility, economic recession, investment collapse
Free with trial A black bar chart showing a downward trend with an arrow on a white background. Clear details and vibrant colo. Analysis decrease illustrations Black downward trending bar chart with arrow on white background graph. A black bar chart showing a downward trend with an arrow on a white background. Clear details and vibrant colo
Free with trial Red arrow pointing down and crashing stock market chart representing financial crisis, recession and economic downturn. Analysis decrease illustrations Market crash showing economic downturn with falling chart and percentage symbol. Red arrow pointing down and crashing stock market chart representing financial crisis, recession and economic downturn
Free with trial This image showcases vibrant 3D bar and line charts, generated by AI, offering a dynamic visual representation of business data. The colorful design effectively communicates trends and comparisons across multiple data sets, providing a clear and engaging overview of key performance indicators. Analysis decrease illustrations AI-Generated 3D Business Charts. This image showcases vibrant 3D bar and line charts, generated by AI, offering a dynamic visual representation of business data. The colorful design effectively communicates trends and comparisons across multiple data sets, providing a clear and engaging overview of key performance indicators.
Free with trial Hand pushing on a declining graph representing business regression and stock market downturns. Analysis decrease illustrations Business regression
Free with trial Hand pushing on a declining graph representing business regression and stock market downturns. Analysis decrease illustrations Business regression
Free with trial This image features two prominent arrows pointing upwards one green and one red symbolizing contrasting financial performance or progress in different areas. Analysis decrease illustrations Two upward arrows green and red showing growth progress and contrasting trends. This image features two prominent arrows pointing upwards one green and one red symbolizing contrasting financial performance or progress in different areas
Free with trial Variable costs on white paper background. Analysis decrease illustrations Variable costs on white paper
Free with trial Analyze Data with Graphs on Tablet, Business Growth Concept and Wood Background , subtle gradient. Analysis decrease illustrations Analyze Data with Graphs on Tablet, Business Growth Concept and Wood Background
Free with trial Reinforcement button on white background. Analysis decrease illustrations Reinforcement button on white
Free with trial Business performance decline icon vector. Productivity drop and process efficiency loss symbol. Analysis decrease vectors Business performance decline icon. Productivity drop and process efficiency loss symbol
Free with trial Wooden toy houses illustrate real estate market trends. Created with the help of Generative AI tools. Analysis decrease illustrations Wooden toy houses illustrate real estate market trends.
Free with trial Eyeglasses reflect financial data and stock market activity with red and green lines Ideal for financial technology and analytics contexts. Analysis decrease illustrations Glasses reflecting financial stock market chart data. Eyeglasses reflect financial data and stock market activity with red and green lines Ideal for financial technology and analytics contexts
Free with trial A stark red bar graph illustrates a sharp downward trend with a prominent arrow, visually representing financial decline, economic recession, or business failure. Analysis decrease illustrations Red bar graph with downward arrow isolated on white background. A stark red bar graph illustrates a sharp downward trend with a prominent arrow, visually representing financial decline, economic recession, or business failure
Free with trial A bar chart showing a steady decline with a red downward arrow, symbolizing financial loss, economic downturn, business decline, or negative performance trends. Analysis decrease illustrations Economic Downtrend Bar Chart for Business concept 3d Rendering. A bar chart showing a steady decline with a red downward arrow, symbolizing financial loss, economic downturn, business decline, or negative performance trends
Free with trial A bar chart showing a steady decline with a red downward arrow, symbolizing financial loss, economic downturn, business decline, or negative performance trends. Analysis decrease illustrations Economic Downtrend Bar Chart for Business concept 3d Rendering. A bar chart showing a steady decline with a red downward arrow, symbolizing financial loss, economic downturn, business decline, or negative performance trends