Free with trial A bar chart showing a steady decline with a red downward arrow, symbolizing financial loss, economic downturn, business decline, or negative performance trends. Analysis decrease illustrations Economic Downtrend Bar Chart for Business concept 3d Rendering. A bar chart showing a steady decline with a red downward arrow, symbolizing financial loss, economic downturn, business decline, or negative performance trends
Free with trial Businessman hand on head and looks up to a downward trending arrow chart. Analysis decrease illustrations Businessman hand on head and looks up to a downward trending arrow chart
Free with trial A simple bar chart and line graph with a downward arrow illustrates a negative trend like recession or business failure ideal for financial reports about crisis or loss. Analysis decrease illustrations Declining Blue Bar Chart and Line Graph Showing Financial Loss on Gray Background. A simple bar chart and line graph with a downward arrow illustrates a negative trend like recession or business failure ideal for financial reports about crisis or loss
Free with trial Abstract 3D Bar Chart Showing Data Growth. Analysis decrease illustrations Abstract 3D Bar Chart Showing Data Growth
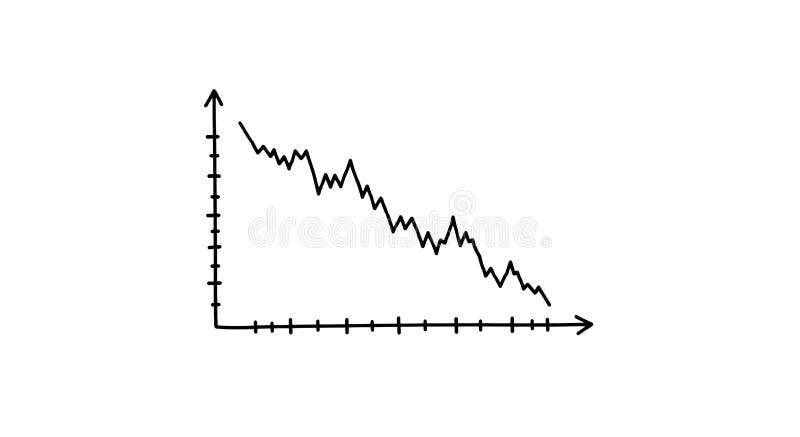
Free with trial A simple, hand-drawn line graph displayed on a plain white background illustrates a notable downward trend. The black line demonstrates decreasing values over time along the defined axes. Analysis decrease vectors Descending line graph displays a downward trend, isolated on white background. A simple, hand-drawn line graph displayed on a plain white background illustrates a notable downward trend. The black line demonstrates decreasing values over time along the defined axes.
Free with trial 3d bar chart with orange and green bars on a blue grid background isolated on white. Analysis decrease illustrations 3d bar chart with orange and green bars on blue grid background graph data. 3d bar chart with orange and green bars on a blue grid background isolated on white
Free with trial A shiny red arrow curves downwards, indicating a downward trend or negative growth. This image visually represents concepts like financial decline market crash or falling stock prices. Analysis decrease illustrations Red arrow points downward showing decline trend and negative growth concept. A shiny red arrow curves downwards, indicating a downward trend or negative growth. This image visually represents concepts like financial decline market crash or falling stock prices
Free with trial Blue coin with dollar sign paired with downward arrow suggesting decreased value, budget cuts, or cost reductions. Ideal for economics, money management, cost-saving, depreciation, finance. Analysis decrease illustrations Coin with Dollar Sign and Downward Arrow Representing Financial Decline or Cost Reduction. Blue coin with dollar sign paired with downward arrow suggesting decreased value, budget cuts, or cost reductions. Ideal for economics, money management, cost-saving, depreciation, finance
Free with trial An icon representing financial downturn, featuring a stack of coins and a line graph with a downward arrow, indicating a decrease in value or performance. This visual signifies economic hardship or in. Analysis decrease vectors Graph showing financial decline with coins isolated on transparent background. An icon representing financial downturn, featuring a stack of coins and a line graph with a downward arrow, indicating a decrease in value or performance. This visual signifies economic hardship or in
Free with trial This whiteboard displays hand-drawn charts illustrating a sharp market decline. The red lines, representing a dramatic downturn, are prominently featured, alongside other less defined financial graphs. This image was generated by AI for illustrative purposes. Analysis decrease illustrations Red Ink Market Crash Whiteboard. This whiteboard displays hand-drawn charts illustrating a sharp market decline. The red lines, representing a dramatic downturn, are prominently featured, alongside other less defined financial graphs. This image was generated by AI for illustrative purposes.
Free with trial Modern smartphone displaying financial data generative ai image. Analysis decrease illustrations Modern smartphone displaying financial data
Free with trial The image shows a hand holding holographic arrows pointing up and down, representing growth and decline, with percentages shown. It symbolizes business trends. Analysis decrease illustrations A hand holding holographic arrows pointing up and down with percentages shown. The image shows a hand holding holographic arrows pointing up and down, representing growth and decline, with percentages shown. It symbolizes business trends
Free with trial A pair of hands holds a sheet of paper displaying a red line graph on a grid pattern the graph illustrates a downward trend, indicating a decline in business, finance or economy the image represents loss, failure, or a recession, generated by AI. Analysis decrease illustrations Hands holding paper showing a declining red business graph data. a pair of hands holds a sheet of paper displaying a red line graph on a grid pattern the graph illustrates a downward trend, indicating a decline in business, finance or economy the image represents loss, failure, or a recession, generated by AI.
Free with trial Women in technology concept. Analyzing cryptocurrency trends and market data. Collaboration in digital finance research. Vector illustration. Analysis decrease vectors Women In Technology. Flat Vector. Women in technology concept. Analyzing cryptocurrency trends and market data. Collaboration in digital finance research. Vector illustration.
Free with trial A sharp, transparent glass arrow pointing downwards, surrounded by glistening water droplets, signifying a downward trend or decline in a conceptual manner. Analysis decrease illustrations Transparent arrow pointing downwards, isolated on white background background copy space. A sharp, transparent glass arrow pointing downwards, surrounded by glistening water droplets, signifying a downward trend or decline in a conceptual manner.
Free with trial A red grid background displays a financial chart with alternating green and white candlesticks and a prominent white arrow pointing downwards. Analysis decrease illustrations Red financial chart with green and white candlesticks showing downward trend. A red grid background displays a financial chart with alternating green and white candlesticks and a prominent white arrow pointing downwards
Free with trial A 3D bar chart with a red arrow indicating a significant downward trend, symbolizing financial loss or economic decline. Isolated on a white background. Analysis decrease illustrations Bar chart showing a downward trend isolated on white background. A 3D bar chart with a red arrow indicating a significant downward trend, symbolizing financial loss or economic decline. Isolated on a white background
Free with trial Bar chart showing a steep downward trend with a large arrow indicating decline. Analysis decrease vectors Bar chart showing a steep downward trend with a large arrow indicating decline
Free with trial This 3D rendering showcases stacks of Bitcoin-like coins alongside a rising bar graph, illustrating cryptocurrency market growth. The image is generated by AI and ideal for illustrating financial concepts related to digital currencies. Analysis decrease illustrations Cryptocurrency Growth Chart. This 3D rendering showcases stacks of Bitcoin-like coins alongside a rising bar graph, illustrating cryptocurrency market growth. The image is generated by AI and ideal for illustrating financial concepts related to digital currencies.
Free with trial View of Graphs showing declining CO₂ emissions. Analysis decrease illustrations Graphs showing declining CO₂ emissions
Free with trial A visual depiction of decreasing financial returns with a pyramid of coins descending alongside a sloping graph illustrating a downward economic trend. Analysis decrease illustrations Declining interest rates represented by stacked coins and downward trend graph. A visual depiction of decreasing financial returns with a pyramid of coins descending alongside a sloping graph illustrating a downward economic trend
Free with trial A cartoon Bitcoin character is presenting a chart showing cryptocurrency market trends. The image is suitable for illustrating financial news, investment advice, or educational materials about Bitcoin and the crypto market. Analysis decrease illustrations Bitcoin Cartoon Character Explaining Crypto Market Trends. A cartoon Bitcoin character is presenting a chart showing cryptocurrency market trends. The image is suitable for illustrating financial news, investment advice, or educational materials about Bitcoin and the crypto market.
Free with trial Doodle style bar chart with a downward trending arrow indicating financial loss. Analysis decrease vectors Doodle style bar chart with a downward trending arrow indicating financial loss
Free with trial A striking red arrow curves downward, representing economic downturn, financial loss, or a negative trend. This visual metaphor is perfect for presentations on market changes or business performance. Analysis decrease illustrations Red downward arrow symbolizing decline and negative trend in business and finance. A striking red arrow curves downward, representing economic downturn, financial loss, or a negative trend. This visual metaphor is perfect for presentations on market changes or business performance
Free with trial Business decline, Businessman examines decreasing bar graph and chart. Analysis decrease vectors Business decline, Businessman examines decreasing bar graph and chart
Free with trial A man holds a sign displaying a sharply declining graph, symbolizing economic hardship. The image, generated by AI, is a powerful visual representation of market instability and financial distress. It's perfect for illustrating articles or presentations related to recession, financial crisis, or ma. Analysis decrease illustrations Declining Graph: Economic Downturn. A man holds a sign displaying a sharply declining graph, symbolizing economic hardship. The image, generated by AI, is a powerful visual representation of market instability and financial distress. It's perfect for illustrating articles or presentations related to recession, financial crisis, or ma
Free with trial Sad face beside declining line graph and bar chart, symbolizing setbacks. Ideal for finance, business, economy, loss, analytics, crisis performance. Simple flat metaphor. Analysis decrease vectors Negative Trend Line and Declining Bar Chart Representing Business Loss or Financial Downturn. Sad face beside declining line graph and bar chart, symbolizing setbacks. Ideal for finance, business, economy, loss, analytics, crisis performance. Simple flat metaphor
Free with trial Falling financial chart with a sharp decline. Space for text. Analysis decrease illustrations Falling financial chart with a sharp decline. Space for text.
Free with trial Versus prior year on white paper background. Analysis decrease illustrations Versus prior year on white paper
Free with trial An isometric view of a bar chart with five blue bars of decreasing height, representing a downward trend. A red arrow points downwards, indicating a negative trajectory. Analysis decrease illustrations Bar chart showing a downward trend with a red arrow isolated on white background. An isometric view of a bar chart with five blue bars of decreasing height, representing a downward trend. A red arrow points downwards, indicating a negative trajectory
Free with trial Decreasing graph icon Business chart with downward arrow Financial loss symbol. Analysis decrease vectors Decreasing graph icon Business chart with downward arrow Financial loss symbol
Free with trial This image depicts a house with a rising stock market graph overlay on a green lawn, symbolizing growth and prosperity in the real estate and financial markets. The graph shows a mix of green and red lines, indicating fluctuations in the market, but overall trending upwards. The image conveys a sense of optimism and hope for the future. Analysis decrease illustrations A house with a rising stock market graph overlay on a green lawn. This image depicts a house with a rising stock market graph overlay on a green lawn. This image depicts a house with a rising stock market graph overlay on a green lawn, symbolizing growth and prosperity in the real estate and financial markets. The graph shows a mix of green and red lines, indicating fluctuations in the market, but overall trending upwards. The image conveys a sense of optimism and hope for the future.
Free with trial Conceptual image representing financial growth and investment. The scene features a golden percentage coin, stacks of coins, and a money bag against a backdrop of financial charts and graphs. The composition suggests themes of investment opportunities, interest rates, and economic prosperity. Suitable for illustrating financial articles, investment strategies, and economic forecasts. Analysis decrease illustrations Financial Growth and Investment Concept. Conceptual image representing financial growth and investment. The scene features a golden percentage coin, stacks of coins, and a money bag against a backdrop of financial charts and graphs. The composition suggests themes of investment opportunities, interest rates, and economic prosperity. Suitable for illustrating financial articles, investment strategies, and economic forecasts.
Free with trial A simple black and white line art illustration of a house with a percentage sign next to it, representing mortgage rates and the cost of home ownership. Analysis decrease vectors Illustration of a house with a percentage sign indicating mortgage interest rates. A simple black and white line art illustration of a house with a percentage sign next to it, representing mortgage rates and the cost of home ownership
Free with trial A businesswoman presents data graphs and charts on a whiteboard during a meeting in a modern office setting. The scene is minimalist and uses a dark blue color palette, emphasizing the data visualization. The image depicts a professional work environment. Analysis decrease illustrations Businesswoman Giving Presentation. A businesswoman presents data graphs and charts on a whiteboard during a meeting in a modern office setting. The scene is minimalist and uses a dark blue color palette, emphasizing the data visualization. The image depicts a professional work environment.
Free with trial Pyramid chart line icon. Neumorphic, Flat shadow, 3d buttons. Analytics graph sign. Market analytics symbol. Line pyramid chart icon. Social media icons. Vector. Analysis decrease vectors Pyramid chart line icon. Analytics graph sign. Neumorphic buttons. Vector. Pyramid chart line icon. Neumorphic, Flat shadow, 3d buttons. Analytics graph sign. Market analytics symbol. Line pyramid chart icon. Social media icons. Vector
Free with trial This image shows two bar graphs. One shows an upward trend with an arrow pointing up. The other shows a downward trend with an arrow pointing down. Black and white. Analysis decrease illustrations Black and white illustration showing upward and downward trending bar graphs with arrows pointing up down. This image shows two bar graphs. One shows an upward trend with an arrow pointing up. The other shows a downward trend with an arrow pointing down. Black and white.
Free with trial A neon glowing graph with blue bars and pink zigzag arrow showing fluctuating growth on black background. Generative AI. Analysis decrease illustrations Neon glowing graph with blue bars and pink zigzag arrow showing fluctuating growth on black background
Free with trial This chart depicts a significant downward trend in stock value over a period. The red line graphically represents the declining prices, indicating a bearish market or a stock facing substantial losses. Analysis decrease illustrations Stock market downturn visualized red line chart showing price decline over time. This chart depicts a significant downward trend in stock value over a period. The red line graphically represents the declining prices, indicating a bearish market or a stock facing substantial losses
Free with trial Graphic element displays contrasting financial indicators featuring a jagged green arrow pointing up signifying growth alongside a similar red arrow pointing sharply down representing decline or market correction. Analysis decrease vectors Graphic representation contrasting upward trending market growth with sharp downward trending financial decline. Graphic element displays contrasting financial indicators featuring a jagged green arrow pointing up signifying growth alongside a similar red arrow pointing sharply down representing decline or market correction
Free with trial Falling bar chart with up and right arrows illustrating declining business trends. Analysis decrease vectors Falling bar chart with up and right arrows illustrating declining business trends
Free with trial Bar chart collapse icon with downward arrow. Decline and negative trend sign symbol vector. Analysis decrease vectors Bar chart collapse icon with downward arrow. Decline and negative trend sign symbol
Free with trial This image shows a bar graph with a downward trend, indicated by a red arrow. It represents a decline in business, finance, or the economy, isolated on white. Analysis decrease illustrations A bar graph showing a downward trend with a red arrow isolated on white background. This image shows a bar graph with a downward trend, indicated by a red arrow. It represents a decline in business, finance, or the economy, isolated on white
Free with trial Red falling arrow and declining chart with stock market data overlay on office interior background, symbolizing global financial collapse impact. Analysis decrease illustrations Financial market crash with red downward arrow and stock graph lines descending sharply over modern office background during. Red falling arrow and declining chart with stock market data overlay on office interior background, symbolizing global financial collapse impact
Free with trial Digital illustration depicting a financial decline with red downward-trending graphs, coin stacks, and scattered currency symbols. Set against a dark grid background with neon highlights, this image conveys themes of market loss, economic recession, and financial analysis�ideal for business, editorial, and presentation use. Analysis decrease illustrations Economic Downturn Illustration Red Decline Graph with Coin Stacks on Digital Grid. Digital illustration depicting a financial decline with red downward-trending graphs, coin stacks, and scattered currency symbols. Set against a dark grid background with neon highlights, this image conveys themes of market loss, economic recession, and financial analysis�ideal for business, editorial, and presentation use.
Free with trial Blue bars on a graph display a downward trend highlighted by a yellow arrow showing decline Great for illustrating economic concepts and market trends. Analysis decrease illustrations Decreasing Bar Graph with Arrow Downward Financial Decline. Blue bars on a graph display a downward trend highlighted by a yellow arrow showing decline Great for illustrating economic concepts and market trends
Free with trial A high-tech illustration of a glowing blue -2% percentage symbol displayed in a sleek, modern office environment. Surrounded by digital data icons and futuristic charts, this image is perfect for representing concepts like small financial losses, minor discounts, data drops, business trends, or analytical reports. Ideal for presentations, websites, digital marketing, or economic graphics. Analysis decrease illustrations Glowing -2% Discount Graphic in Modern Office Environment. A high-tech illustration of a glowing blue -2% percentage symbol displayed in a sleek, modern office environment. Surrounded by digital data icons and futuristic charts, this image is perfect for representing concepts like small financial losses, minor discounts, data drops, business trends, or analytical reports. Ideal for presentations, websites, digital marketing, or economic graphics.
Free with trial A stock market chart with a downward trend and shattered glass evokes a sense of financial loss and failure, and is used to illustrate economic downturns or market crashes. Analysis decrease illustrations Financial Downfall Stock Market Chart with Shattered Glass. A stock market chart with a downward trend and shattered glass evokes a sense of financial loss and failure, and is used to illustrate economic downturns or market crashes
Free with trial Downward trend graph with large sad face and woman in casual attire. Ideal for business performance, feedback, failure, regret, decisions, emotions, analytics. Clean simple flat metaphor. Analysis decrease vectors Declining Trend Graph with Sad Face and Casual Woman Highlighting Failure or Negative Feedback. Downward trend graph with large sad face and woman in casual attire. Ideal for business performance, feedback, failure, regret, decisions, emotions, analytics. Clean simple flat metaphor
Free with trial A stark red arrow zigzags downwards, powerfully representing economic downturns, market crashes, and negative financial trends. This visual signifies a crisis or significant drop. Analysis decrease illustrations Red downward arrow symbolizing financial decline and economic recession trends. A stark red arrow zigzags downwards, powerfully representing economic downturns, market crashes, and negative financial trends. This visual signifies a crisis or significant drop
Free with trial A vibrant image featuring a thick, textured green arrow pointing upwards, symbolizing growth, success, and progress. Contrasting this, a bold red arrow points downwards, representing decline, loss, and failure. Both arrows are rendered with a painterly style, suggesting a hand-drawn or artistic representation of financial or market trends. The clean white background isolates the arrows, emphasizing their symbolic meaning. This visual is ideal for illustrating concepts like stock market fluctuations, business performance, positive and negative trends, or decision-making. Analysis decrease illustrations Up and Down Arrows: Growth vs. Decline. A vibrant image featuring a thick, textured green arrow pointing upwards, symbolizing growth, success, and progress. Contrasting this, a bold red arrow points downwards, representing decline, loss, and failure. Both arrows are rendered with a painterly style, suggesting a hand-drawn or artistic representation of financial or market trends. The clean white background isolates the arrows, emphasizing their symbolic meaning. This visual is ideal for illustrating concepts like stock market fluctuations, business performance, positive and negative trends, or decision-making.
Free with trial A visual representation of a declining stock market trend, depicted by a bold red arrow descending across a financial graph, symbolizing economic downturn and investment loss. Analysis decrease illustrations A red arrow pointing downwards on a stock market graph, isolated on white background. A visual representation of a declining stock market trend, depicted by a bold red arrow descending across a financial graph, symbolizing economic downturn and investment loss
Free with trial This striking image depicts a downward arrow crashing through a globe, symbolizing market decline. The glowing red elements evoke urgency in financial analytics. Analysis decrease illustrations Downward Arrow Crashing Through the Globe Concept. This striking image depicts a downward arrow crashing through a globe, symbolizing market decline. The glowing red elements evoke urgency in financial analytics
Free with trial Collection of various red infographic elements including charts, graphs, diagrams, and symbols, perfect for presentations and data visualization. Ideal for showcasing data trends, progress, and comparisons. Easily customizable and adaptable to diverse projects. Analysis decrease illustrations Red Infographic Elements
Free with trial A graph shows a downward trend. Green bars diminish in height along a timeline. A red arrow underscores the downward movement of the data on the timeline. Analysis decrease illustrations Decreasing graph showing green bars plunging downward with a red arrow indication. A graph shows a downward trend. Green bars diminish in height along a timeline. A red arrow underscores the downward movement of the data on the timeline
Free with trial This vibrant 3D bar chart illustrates strong business growth and upward progress. The colorful, glossy bars represent data points, clearly showing an increase. Ideal for presentations and reports. Analysis decrease illustrations Colorful 3D Bar Chart Showing Business Growth and Progress. This vibrant 3D bar chart illustrates strong business growth and upward progress. The colorful, glossy bars represent data points, clearly showing an increase. Ideal for presentations and reports.
Free with trial A collection of black and white icons representing financial concepts such as growth charts, decline arrows, and money symbols, all presented clearly on a plain white background for easy integration i. Analysis decrease vectors Financial growth and decline icons isolated on transparent background. A collection of black and white icons representing financial concepts such as growth charts, decline arrows, and money symbols, all presented clearly on a plain white background for easy integration i
Free with trial Stacks of gold and silver coins in front of a blurred background with a financial graph and percentages. Analysis decrease illustrations Stacks of coins and financial graph with percentages in background finance money. Stacks of gold and silver coins in front of a blurred background with a financial graph and percentages
Free with trial Interface displaying downward-trending bar chart and dotted line on dashboard, with ticker symbols. Finance, analytics, data visualization, investment, technological, corporate, digital. Analysis decrease illustrations Interface displaying downward-trending bar chart and dotted line on dashboard, with ticker symbols
Free with trial Close-up of stacks of gold coins resting on a financial chart, symbolizing wealth, investment, finance, and economic growth. The image evokes a sense of prosperity and success in business and trading. Analysis decrease illustrations Stacks of Gold Coins on Financial Chart. Close-up of stacks of gold coins resting on a financial chart, symbolizing wealth, investment, finance, and economic growth. The image evokes a sense of prosperity and success in business and trading.
Free with trial Visualize cost reduction strategies with this image. A finger touches a glowing hexagon icon with "cost reduction" text, representing business finance and savings. Ideal for corporate presentations on management. Analysis decrease illustrations Touching a glowing hexagon icon with the words cost reduction on a dark background. Visualize cost reduction strategies with this image. A finger touches a glowing hexagon icon with "cost reduction" text, representing business finance and savings. Ideal for corporate presentations on management
Free with trial Stock fall recession economy crisis financial global market chart on red decline background concept with loss price down finance graph or digital crash diagram failure money. Analysis decrease illustrations Stock fall recession economy crisis financial global market chart on red decline background concept with loss price down finance
Free with trial Down crisis financial business market graph on investment economy finance chart background of loss money economic crash exchange or stock recession diagram concept. Analysis decrease illustrations Down crisis financial business market graph on investment economy finance chart background of loss money economic crash exchange
Free with trial Hand loss business graph crisis chart diagram financial economy on down arrow investment market background of digital technology inflation strategy economic stock. Analysis decrease illustrations Hand loss business graph crisis chart diagram financial economy on down arrow investment market background of digital technology
Free with trial A currency icon with downward arrows represents loss and declining financial value. This graphic suits risk reports, business dashboards, accounting materials, and market analysis presentations. Analysis decrease vectors Loss Finance Downward Currency Symbol. A currency icon with downward arrows represents loss and declining financial value. This graphic suits risk reports, business dashboards, accounting materials, and market analysis presentations
Free with trial Year to year on white paper background. Analysis decrease illustrations Year to year on white paper
Free with trial Colorful Bar Chart Graph Showing Growth and Performance Over Time with Upward Trend. Analysis decrease vectors Colorful Bar Chart Graph Showing Growth and Performance Over Time with Upward Trend
Free with trial Revenue turnover word block on white background. Analysis decrease illustrations Revenue turnover word block on white
Free with trial A snarling brown bear symbolizes a bear market, with a declining stock chart and red candlestick graph, illustrating financial downturn and investment losses against a dark red background. Analysis decrease illustrations Bear Market Snarl: Stock Chart Downtrend, Candlestick Graph Plunge. A snarling brown bear symbolizes a bear market, with a declining stock chart and red candlestick graph, illustrating financial downturn and investment losses against a dark red background
Free with trial Red downward arrows symbolize a decline in financial markets or economic downturn. The background features blurred lights, enhancing the dramatic effect. Analysis decrease illustrations Red downward arrows symbolize a decline in financial markets or economic downturn.
Free with trial A 3D illustration depicts a financial chart with a downward trend. Four vertical bars, colored yellow, orange, and green, are arranged in descending order of height, suggesting a decline. To the left, a prominent orange circle contains a white downward-pointing arrow, reinforcing the theme of a negative trend or decrease. The entire composition is set against a plain white background. Analysis decrease illustrations Financial chart with downward trend indicator stock market. A 3D illustration depicts a financial chart with a downward trend. Four vertical bars, colored yellow, orange, and green, are arranged in descending order of height, suggesting a decline. To the left, a prominent orange circle contains a white downward-pointing arrow, reinforcing the theme of a negative trend or decrease. The entire composition is set against a plain white background
Free with trial This vibrant image, generated by AI, depicts a cityscape with a dynamic graph illustrating growth and potential decline. The color transition symbolizes economic fluctuations, offering a visual representation of urban development and market trends. Analysis decrease illustrations AI-Generated Cityscape Growth Chart. This vibrant image, generated by AI, depicts a cityscape with a dynamic graph illustrating growth and potential decline. The color transition symbolizes economic fluctuations, offering a visual representation of urban development and market trends.
Free with trial This futuristic visualization, generated by AI, depicts a global Bitcoin network, highlighting its worldwide reach and digital infrastructure. Data streams and interactive elements showcase the complex interplay of transactions and information flow within the cryptocurrency ecosystem. Analysis decrease illustrations Global Bitcoin Network
Free with trial Growth and decline chart icon. Green upward and red downward arrow symbol illustration. Analysis decrease vectors Growth and decline chart icon. Green upward and red downward arrow symbol
Free with trial Simple vector graph illustration showing increasing and decreasing trend with bars. Analysis decrease vectors Simple vector graph illustration showing increasing and decreasing trend with bars
Free with trial Outline financial tax icons set featuring a book, magnifying glass, money, documents, and charts for financial accounting and business concept design. Analysis decrease illustrations Outline financial tax icons set featuring a book, magnifying glass, money, documents, and charts for financial
Free with trial A striking 3D rendering features an abstract bar graph composed of numerous translucent blue rectangular blocks against a dark, almost black, background. The varying heights of the blocks create a dynamic visual representation of data, statistics, or growth trends. This modern and futuristic design is ideal for illustrating concepts related to business, finance, technology, analytics, market research, or digital information in presentations, reports, websites, and corporate media. Analysis decrease illustrations Abstract 3D Blue Bar Graph Visualization. A striking 3D rendering features an abstract bar graph composed of numerous translucent blue rectangular blocks against a dark, almost black, background. The varying heights of the blocks create a dynamic visual representation of data, statistics, or growth trends. This modern and futuristic design is ideal for illustrating concepts related to business, finance, technology, analytics, market research, or digital information in presentations, reports, websites, and corporate media.
Free with trial Travel industry decline, concept. Colorful suitcases with downward red arrow. 3D rendering isolated on white background. Analysis decrease illustrations Travel industry decline, concept. Colorful suitcases with downward red arrow. 3D rendering
Free with trial Hand crisis business graph red 3d arrow fall financial chart investment market concept on banking crash background of down finance global economy loss stock recession. Analysis decrease illustrations Hand crisis business graph red 3d arrow fall financial chart investment market concept on banking crash background of down finance
Free with trial Viewing Progress Icon Line Design Style Finance and Business Symbol Vector Illustrations. Analysis decrease vectors Viewing Progress Icon Line Design Style Finance and Business Symbol