Free with trial Financial Growth Chart on a Suitcase Business Investment Economy Graphic Illustration. Analysis decrease vectors Financial Growth Chart on a Suitcase Business Investment Economy Graphic Illustration
Free with trial This image represents a financial crisis with a downward trend and a broken surface. Analysis decrease illustrations Economic downturn concept with a red graph and a blue arrow pointing down. This image represents a financial crisis with a downward trend and a broken surface
Free with trial Financial arrows up and down icon on circle. Growth and decline graph sign symbol illustration. Analysis decrease vectors Financial arrows up and down icon on circle. Growth and decline graph sign symbol
Free with trial A financial graph depicting a decline, featuring vibrant red and yellow candlesticks on a sleek digital background, conveying market downturns. Analysis decrease illustrations Digital stock market chart showing a downward trend with red and yellow candlesticks. A financial graph depicting a decline, featuring vibrant red and yellow candlesticks on a sleek digital background, conveying market downturns
Free with trial Falling bar chart with a red warning sign signifies financial risk and economic decline, suggesting the need for caution in investing and business strategies. Analysis decrease illustrations Declining Chart with Warning Sign Illustrating Market Downturn. Falling bar chart with a red warning sign signifies financial risk and economic decline, suggesting the need for caution in investing and business strategies
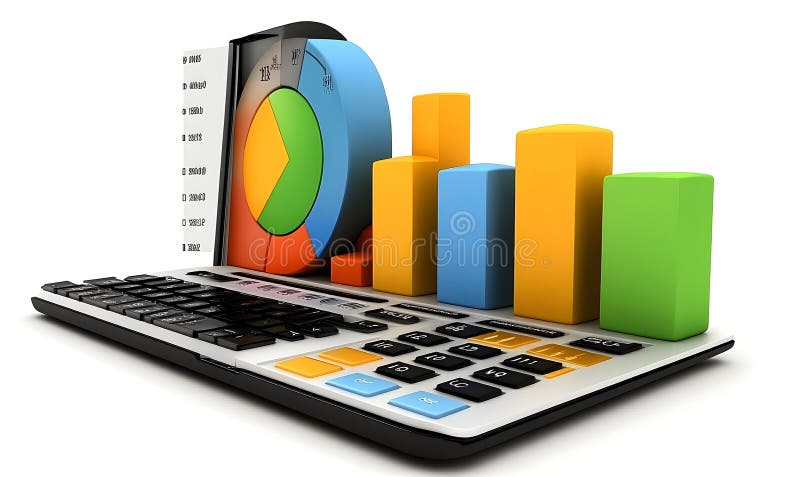
Free with trial Colorful Charts on a Calculator Keyboard. Analysis decrease illustrations Colorful Charts on a Calculator Keyboard
Free with trial A visual representation of a declining real estate market, showing smaller houses and a sharp downward trending green arrow. Analysis decrease illustrations Real estate market decline illustrated by decreasing house sizes and downward arrow. A visual representation of a declining real estate market, showing smaller houses and a sharp downward trending green arrow
Free with trial A vibrant circular chart displaying a twenty percent decrease with bright colors and clean design, ideal for business, finance, and analytics presentations. Analysis decrease illustrations Colorful Circular Chart with Percentage Reduction in Modern Data Visualization Style. A vibrant circular chart displaying a twenty percent decrease with bright colors and clean design, ideal for business, finance, and analytics presentations
Free with trial A vintage green gas pump with a red and white sign stands on a concrete floor against a black wall, while a large screen on the right displays a stock market chart with red, yellow, and green lines showing a downward trend, creating a mood of decay and economic decline in a dark, atmospheric setting. Analysis decrease illustrations Vintage gas pump with stock market chart on screen in dark background. A vintage green gas pump with a red and white sign stands on a concrete floor against a black wall, while a large screen on the right displays a stock market chart with red, yellow, and green lines showing a downward trend, creating a mood of decay and economic decline in a dark, atmospheric setting
Free with trial Stacks of coins with a world map overlay and a red downward trend line, symbolizing financial decline. The composition uses a shallow depth of field. Analysis decrease illustrations Stacks of Coins with World Map and Declining Financial Trend. Stacks of coins with a world map overlay and a red downward trend line, symbolizing financial decline. The composition uses a shallow depth of field
Free with trial Graphs set with line charts, bar charts, and scatter plots illustrating upward and downward trends with arrows and data points. Analysis decrease vectors Graphs set with line charts, bar charts, and scatter plots illustrating upward and
Free with trial A simple, hand-drawn style icon depicting a magnifying glass with a minus sign inside the lens, representing the zoom out function. Analysis decrease illustrations Minimalist line art icon of a magnifying glass with a minus symbol indicating zoom out. A simple, hand-drawn style icon depicting a magnifying glass with a minus sign inside the lens, representing the zoom out function
Free with trial A close-up shot shows a hand placing a wooden block with a percentage symbol and downward arrow onto others spelling COST, representing a decrease in expenses or savings. Analysis decrease illustrations Hand adjusting wooden blocks spelling cost with percentage symbol implying cost reduction. A close-up shot shows a hand placing a wooden block with a percentage symbol and downward arrow onto others spelling COST, representing a decrease in expenses or savings
Free with trial A striking visual representation of sustainable energy and financial growth. Wind turbines stand tall against a dramatic sunset, symbolizing renewable energy. A superimposed financial chart illustrates upward trends, suggesting positive investment and economic progress in the green energy sector. The image combines environmental consciousness with business concepts, ideal for illustrating investment, sustainability, and future-oriented themes. Analysis decrease illustrations Sustainable Energy Investment: Wind Turbines and Financial Chart. A striking visual representation of sustainable energy and financial growth. Wind turbines stand tall against a dramatic sunset, symbolizing renewable energy. A superimposed financial chart illustrates upward trends, suggesting positive investment and economic progress in the green energy sector. The image combines environmental consciousness with business concepts, ideal for illustrating investment, sustainability, and future-oriented themes.
Free with trial A 3D illustration of a statistic down icon isolated on a white background symbolizing decline in data or business performance. Analysis decrease illustrations Statistic down 3D illustration. A 3D illustration of a statistic down icon isolated on a white background symbolizing decline in data or business performance
Free with trial A 3D illustration of a statistic down icon isolated on a white background symbolizing decline in data or business performance. Analysis decrease illustrations Statistic down 3D illustration. A 3D illustration of a statistic down icon isolated on a white background symbolizing decline in data or business performance
Free with trial A simple bar graph illustrating upward growth and financial success. Ideal for presentations, reports, and website use. Analysis decrease vectors Upward Trending Bar Graph: Business Growth and Financial Success. A simple bar graph illustrating upward growth and financial success. Ideal for presentations, reports, and website use.
Free with trial Close-up of a financial chart showing a red line declining. The chart is on a piece of white paper and the red line is the main focus. Analysis decrease illustrations Financial Chart Showing Decline. Close-up of a financial chart showing a red line declining. The chart is on a piece of white paper and the red line is the main focus
Free with trial A striking 3D rendering depicts a bold red downward trend arrow overlaid on a subtle grid, immediately conveying a sense of decline and loss. Set against a pristine white background, the graphic powerfully symbolizes financial instability, market downturns, and the potential for recession. This illustration is ideal for conveying concepts of investment risk, negative business trends, and economic. Analysis decrease illustrations Red downward trend arrow and grid symbolizing decline or recession on white background. A striking 3D rendering depicts a bold red downward trend arrow overlaid on a subtle grid, immediately conveying a sense of decline and loss. Set against a pristine white background, the graphic powerfully symbolizes financial instability, market downturns, and the potential for recession. This illustration is ideal for conveying concepts of investment risk, negative business trends, and economic
Free with trial Illustrative line graph charting downward trend, representing losses, recession or market decline, isolated stock diagram. Analysis decrease vectors Illustrative line graph charting downward trend, representing losses, recession or market decline, isolated stock
Free with trial Business growth and loss icon. Bar chart with rising and falling arrow symbol illustration. Analysis decrease vectors Business growth and loss icon. Bar chart with rising and falling arrow symbol
Free with trial Financial planning graph shows coins and pen. Analysis decrease illustrations Financial planning graph shows coins and pen
Free with trial Wooden cubes with the inscription COST and a percent symbol. Concept of reducing costs, cutting expenses, promotions and discounts. Analysis decrease illustrations Wooden cubes with the inscription COST and a percent symbol.
Free with trial Brightly colored wooden blocks arranged as a bar graph with one block falling represents decline Use for financial or business illustrations. Analysis decrease illustrations Colorful Wooden Blocks Forming a Graph, One Falling, on Data Chart. Brightly colored wooden blocks arranged as a bar graph with one block falling represents decline Use for financial or business illustrations
Free with trial A 3D rendering of a dollar coin with a downward-pointing arrow on a black background, representing economic decline, financial loss, and market downturn. Analysis decrease vectors Dollar Coin with Downward Arrow 3D Rendering for Economic Decline. A 3D rendering of a dollar coin with a downward-pointing arrow on a black background, representing economic decline, financial loss, and market downturn
Free with trial A close-up shot of a printed financial report showing market fluctuations indicated by a red line graph. Analysis decrease illustrations A financial document showing a fluctuating red line graph displayed. A close-up shot of a printed financial report showing market fluctuations indicated by a red line graph
Free with trial A sharp red arrow graphically showcases a significant decline on a financial chart display. Analysis decrease illustrations A sharp red arrow graphically showcases a significant decline on a financial chart display
Free with trial Tax blocks with percentage symbol and up and down arrows on financial charts, concept of tax rate changes and fiscal policy featuring taxes, taxation, percent with VAT and government elements for. Analysis decrease illustrations Tax blocks with percentage symbol and up and down arrows on financial charts
Free with trial A 3D rendered image showing a decreasing purple bar graph with an orange arrow pointing downwards. Stacks of coins are placed near the graph, suggesting financial loss or economic downturn. The graph is displayed on a white surface with lines indicating a chart. Analysis decrease illustrations 3d purple bar graph with orange downward arrow. A 3D rendered image showing a decreasing purple bar graph with an orange arrow pointing downwards. Stacks of coins are placed near the graph, suggesting financial loss or economic downturn. The graph is displayed on a white surface with lines indicating a chart
Free with trial A black graph on a white background depicts a sharp downward trend with an arrow indicating further decline. Analysis decrease illustrations Black graph showing a downward trend on a white background chart decline. A black graph on a white background depicts a sharp downward trend with an arrow indicating further decline
Free with trial 3 Candles vector Stock Market Trading concept colored icon or logo element. Analysis decrease vectors 3 Candles vector Stock Market Trading colored icon or logo element
Free with trial An eye-catching 3D bar graph illustration with yellow, blue, and red elements. It is designed to represent data or growth concepts. Analysis decrease vectors Colorful 3D bar graph illustration showing descending values on transparent background. An eye-catching 3D bar graph illustration with yellow, blue, and red elements. It is designed to represent data or growth concepts.
Free with trial A dynamic 3D rendering of a bar graph, depicting a downward trend with vibrant red bars and a prominent white arrow pointing downwards. The scene is set against a dark, subtly textured background, creating a dramatic visual contrast. This image effectively symbolizes decline, loss, negative financial trends, or challenges in business. Analysis decrease illustrations 3D Bar Graph with Declining Red Bars and White Arrow Ai Generated. A dynamic 3D rendering of a bar graph, depicting a downward trend with vibrant red bars and a prominent white arrow pointing downwards. The scene is set against a dark, subtly textured background, creating a dramatic visual contrast. This image effectively symbolizes decline, loss, negative financial trends, or challenges in business.
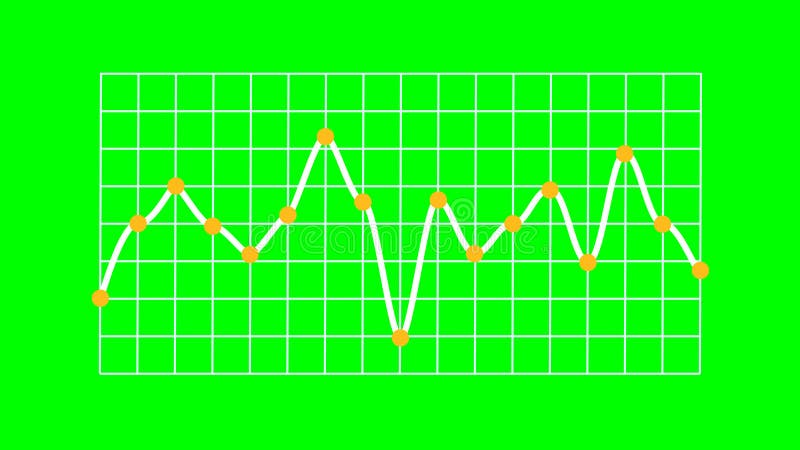
Free with trial Rendered line graph showing a single white line indicating data trends with distinct fluctuations. Yellow marker points animate vertically from the X-axis, and each plotted value features an orange circular dot. The white line runs over a structured white grid on a bright green screen background, enabling chroma keying. No axis values or units are present, emphasizing visual representation of abstract data and business trends. Analysis decrease illustrations Business Trend Line Graph Showing Trading on Green Screen. Rendered line graph showing a single white line indicating data trends with distinct fluctuations. Yellow marker points animate vertically from the X-axis, and each plotted value features an orange circular dot. The white line runs over a structured white grid on a bright green screen background, enabling chroma keying. No axis values or units are present, emphasizing visual representation of abstract data and business trends.
Free with trial This image depicts a financial downturn with a graphic arrow indicating a decline in value. Analysis decrease illustrations Downward trend represented by a blue arrow breaking through the floor. This image depicts a financial downturn with a graphic arrow indicating a decline in value
Free with trial A person analyzing stock market data on multiple computer screens, indicating financial trends, likely related to investments or trading. Analysis decrease illustrations A man watches financial data on multiple computer screens in a dark office. A person analyzing stock market data on multiple computer screens, indicating financial trends, likely related to investments or trading
Free with trial Behavioral Economics concept. An investor experiences loss aversion amid falling market graphs and diminishing returns. Investment risk, financial decision making. Vector illustration. Analysis decrease vectors Behavioral Economics. Flat Vector Illustration. Behavioral Economics concept. An investor experiences loss aversion amid falling market graphs and diminishing returns. Investment risk, financial decision making. Vector illustration.
Free with trial Hand drawing a down arrow over a decreasing bar chart on a green chalkboard. Analysis decrease illustrations Hand drawing declining bar graph on blackboard. Hand drawing a down arrow over a decreasing bar chart on a green chalkboard
Free with trial A vibrant bar graph shows an upward trend with a green arrow, indicating growth. The bars are blue, yellow, green, and red, set against a clean white background. Analysis decrease illustrations Colorful Bar Graph with Upward Trend Line and Green Arrow Indicator on White Background. A vibrant bar graph shows an upward trend with a green arrow, indicating growth. The bars are blue, yellow, green, and red, set against a clean white background
Free with trial This image represents a stock market crash, symbolized by a red arrow pointing downwards on a graph. It signifies economic downturn, financial loss, and investment risk. Analysis decrease illustrations Stock market crash with red arrow pointing down on a graph background. This image represents a stock market crash, symbolized by a red arrow pointing downwards on a graph. It signifies economic downturn, financial loss, and investment risk
Free with trial This image depicts a computer screen displaying a sharply declining stock market graph, generated by AI. The red line dramatically illustrates a significant market downturn, accompanied by numerous data points and financial indicators. The dark aesthetic enhances the sense of urgency and potential. Analysis decrease illustrations AI-Generated Stock Market Decline. This image depicts a computer screen displaying a sharply declining stock market graph, generated by AI. The red line dramatically illustrates a significant market downturn, accompanied by numerous data points and financial indicators. The dark aesthetic enhances the sense of urgency and potential
Free with trial Reciprocal tariffs and stock market crashes and economic decline or falling stock market prices. Analysis decrease illustrations Reciprocal tariffs and stock market crashes and economic decline or falling stock market prices
Free with trial This image illustrates a comparison between an increasing trend and a decreasing trend using bar graphs and arrows. Analysis decrease illustrations Comparison of increasing and decreasing trends. This image illustrates a comparison between an increasing trend and a decreasing trend using bar graphs and arrows
Free with trial Financial business concept going bankrupt flat vector design. design vector illustration. Analysis decrease vectors Flat design bankruptcy concept. financial business concept going bankrupt flat vector design.design vector illustration
Free with trial This 3D rendered image shows a computer screen displaying various charts and graphs, including bar charts, pie charts, and line graphs. The data visualization is colorful and easy to understand, generated by AI for quick data interpretation. The design is simple and modern, ideal for presentations. Analysis decrease illustrations AI-Generated Data Dashboard. This 3D rendered image shows a computer screen displaying various charts and graphs, including bar charts, pie charts, and line graphs. The data visualization is colorful and easy to understand, generated by AI for quick data interpretation. The design is simple and modern, ideal for presentations
Free with trial Plus and minus blocks on desk with hand placing plus symbol, concept of positive change, balance and decision making featuring negative, math, arithmetic with addition and subtraction elements for. Analysis decrease illustrations Plus and minus blocks on desk with hand placing plus symbol, concept of positive
Free with trial Illustration of economic growth is depicted by a green staircase ascending toward light, symbolizing progress and increased prosperity. Analysis decrease vectors Illustration of economic growth is depicted by a green staircase ascending toward light
Free with trial A woman analyzes stock market data using a magnifying glass, with a falling coin and downward trending charts indicating a potential loss. Analysis decrease vectors Woman analyzing stock market data with magnifying glass tool. a woman analyzes stock market data using a magnifying glass, with a falling coin and downward trending charts indicating a potential loss.
Free with trial Modern, minimalistic chart icon for business and finance. Analysis decrease illustrations Modern, minimalistic chart icon for business and finance
Free with trial The concept of a business financial crash depicted by a vibrant 3D rendering of a declining chart. Analysis decrease illustrations The concept of a business financial crash depicted by a vibrant 3D rendering of a declining chart.
Free with trial Flat design business icons depict various charts, percentage signs, targets, hierarchical diagrams, and coin stacks representing financial growth and data analysis in monochrome. Generative AI. Analysis decrease vectors Black and white flat design business icons including charts percentage target and money stacks illustrating financial growth and. Flat design business icons depict various charts, percentage signs, targets, hierarchical diagrams, and coin stacks representing financial growth and data analysis in monochrome. Generative AI
Free with trial Red line graph shows a sharp stock market decline. Economic downturn visualized. Analysis decrease illustrations Stock Market Decline: A Visual Representation of Economic Downturn. Red line graph shows a sharp stock market decline. Economic downturn visualized
Free with trial A stack of coins rests on a financial chart showing a downward trend. This image, generated by AI, visually represents economic fluctuations and market instability. The dark coins emphasize the seriousness of the financial situation depicted by the graph. Analysis decrease illustrations Financial Market Trends. A stack of coins rests on a financial chart showing a downward trend. This image, generated by AI, visually represents economic fluctuations and market instability. The dark coins emphasize the seriousness of the financial situation depicted by the graph.
Free with trial A minimalist, black and white vector icon representing a bar chart or graph. The icon features a series of vertical bars of varying heights, set against a base of horizontal lines. This clean and modern design is ideal for representing data, statistics, progress, growth, or financial information in digital and print media. Its simple aesthetic makes it versatile for use in presentations, websites, apps, and infographics. Analysis decrease vectors Abstract Bar Chart Icon. A minimalist, black and white vector icon representing a bar chart or graph. The icon features a series of vertical bars of varying heights, set against a base of horizontal lines. This clean and modern design is ideal for representing data, statistics, progress, growth, or financial information in digital and print media. Its simple aesthetic makes it versatile for use in presentations, websites, apps, and infographics.
Free with trial Financial chart displays data points and lines indicating trends against a blue background and is useful for presentations. Analysis decrease illustrations Financial Data on Chart. Financial chart displays data points and lines indicating trends against a blue background and is useful for presentations
Free with trial This image showcases a person using a tablet to interact with business analytics data, generated by AI. The visualization includes graphs and charts, providing real-time insights into key performance indicators. This technology streamlines business decision-making. Analysis decrease illustrations AI-Powered Business Analytics. This image showcases a person using a tablet to interact with business analytics data, generated by AI. The visualization includes graphs and charts, providing real-time insights into key performance indicators. This technology streamlines business decision-making.
Free with trial This vibrant image depicts a stock market graph, generated by AI, showcasing a dramatic decline. The fiery red and orange hues emphasize the volatility and potential losses. The futuristic cityscape backdrop adds a layer of technological complexity, suggesting the interconnectedness of global fina. Analysis decrease illustrations AI-Generated Stock Market Decline. This vibrant image depicts a stock market graph, generated by AI, showcasing a dramatic decline. The fiery red and orange hues emphasize the volatility and potential losses. The futuristic cityscape backdrop adds a layer of technological complexity, suggesting the interconnectedness of global fina
Free with trial A conceptual illustration of digital currency coins with a financial candlestick chart in the background, representing cryptocurrency market fluctuations and investment trends. Analysis decrease vectors Digital currency coins on financial stock market candlestick chart showing trading trends and investment growth. a conceptual illustration of digital currency coins with a financial candlestick chart in the background, representing cryptocurrency market fluctuations and investment trends
Free with trial This image shows a downward-trending red arrow graph, generated by AI, illustrating a significant decline. The visual representation is clear and effective in communicating a negative trend, potentially in stock prices, sales figures, or other quantifiable data. Analysis decrease illustrations Downward Trending Graph. This image shows a downward-trending red arrow graph, generated by AI, illustrating a significant decline. The visual representation is clear and effective in communicating a negative trend, potentially in stock prices, sales figures, or other quantifiable data.
Free with trial Displaying green fluctuating data line moving across dashboard grid overlay, with red area graph. Financial, analytics, dashboard, data, technology, investment, digital. Analysis decrease illustrations Displaying green fluctuating data line moving across dashboard grid overlay, with red area graph
Free with trial Zoom out vector line icon with a magnifying glass and minus symbol for search and view controls. Analysis decrease vectors Zoom out vector line icon with a magnifying glass and minus symbol for search and view controls
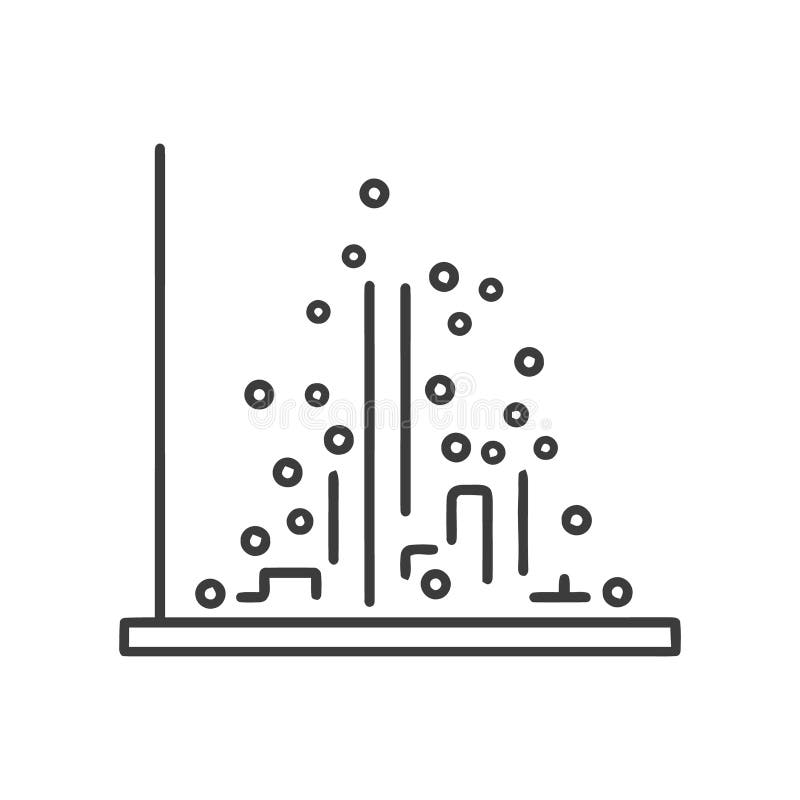
Free with trial Description: Simple line art illustration of a scatter plot graph showing an uneven distribution of data points. Perfect for presentations or reports. Analysis decrease vectors Abstract Data Visualization: Scatter Plot Chart with Irregular Data Points. Description: Simple line art illustration of a scatter plot graph showing an uneven distribution of data points. Perfect for presentations or reports.
Free with trial A visual representation of negative financial performance and economic downturn. This graphic depicts a sharp decline, indicating losses and a downward trend in market or business metrics. Analysis decrease vectors Red downward trending graph with arrow signifying financial decline and economic recession concept. A visual representation of negative financial performance and economic downturn. This graphic depicts a sharp decline, indicating losses and a downward trend in market or business metrics
Free with trial Photo of handwritten charts illustrating inflation and potential recession. Graphs show rising prices and economic downturn concerns. Financial crisis concept depicted with, business. Analysis decrease illustrations Photo of handwritten charts illustrating inflation and potential recession. Graphs show rising prices and economic downturn
Free with trial Unemployment rate gauge shows the current economic climate with a red needle pointing towards a high rate indicating potential financial instability market downturn and job insecurity reflecting conc. Analysis decrease illustrations Unemployment rate gauge showing economic conditions with a red indicator needle pointing up. Unemployment rate gauge shows the current economic climate with a red needle pointing towards a high rate indicating potential financial instability market downturn and job insecurity reflecting conc
Free with trial Red bar graph with decreasing values. Generative AI. Analysis decrease illustrations Red bar graph with decreasing values
Free with trial Global economic downturn sketch falling arrows, documents around Earth business illustration. Analysis decrease illustrations Global Economy Sketch - World Globe with Growth and Decline Arrows. Global economic downturn sketch falling arrows, documents around Earth business illustration
Free with trial A line graph showing a declining stock market trend over time, with a downward sloping orange line and multiple blue and. Analysis decrease illustrations Stock Market Decline Graph. A line graph showing a declining stock market trend over time, with a downward sloping orange line and multiple blue and. A line graph showing a declining stock market trend over time, with a downward sloping orange line and multiple blue and.
Free with trial Colorful blocks in decreasing order on a blue surface. Represents decline or recession in a vibrant, illustrative manner. Stock photo. Analysis decrease illustrations Colorful blocks in decreasing order on a blue surface. Represents decline or recession in a vibrant, illustrative manner
Free with trial Candlestick Chart vector Professional Financial Trading concept icon or symbol. Analysis decrease vectors Candlestick Chart vector Professional Financial Trading icon or symbol
Free with trial Golden jewelry with a down and growth arrows. Price of gold. Analysis decrease illustrations Golden jewelry with a down and growth arrows. Price of gold
Free with trial Downward trend bar chart with red arrow icon. Financial loss, decline, or economic crisis symbol vector. Analysis decrease vectors Downward trend bar chart with red arrow icon. Financial loss, decline, or economic crisis symbol
Free with trial A dynamic image of coins falling against a blurred stock market graph background, symbolizing finance, investment, and economic trends in today's market. Generative AI. Analysis decrease illustrations Falling Coins with Stock Market Graph in Background Display. A dynamic image of coins falling against a blurred stock market graph background, symbolizing finance, investment, and economic trends in today's market. Generative AI
Free with trial Stylized digital illustration showing a virtual coin with a declining market chart in the background. this image symbolizes financial risks, price fluctuations, and market volatility in the electronic currency sector. Analysis decrease vectors Digital illustration of a virtual currency coin with a falling market graph representing financial price volatility. stylized digital illustration showing a virtual coin with a declining market chart in the background. this image symbolizes financial risks, price fluctuations, and market volatility in the electronic currency sector
Free with trial Up and down curved arrow chart icon illustration. Business trend bar symbol in black circle. Analysis decrease vectors Up and down curved arrow chart icon. Business trend bar symbol in black circle
Free with trial Stacks of coins on laptop with stock market graph. Analysis decrease illustrations Stacks of coins on laptop with stock market graph
Free with trial Up and down graph icon on black circle. Outline bar chart with uptrend and downtrend arrow symbol vector. Analysis decrease vectors Up and down graph icon on black circle. Outline bar chart with uptrend and downtrend arrow symbol
Free with trial This vibrant 3D rendering showcases a bar chart and pie chart, illustrating data growth and proportions. Ideal for presentations, reports, or educational materials. The colorful design makes it visually appealing and easy to understand. Analysis decrease illustrations Colorful 3D Bar Chart and Pie Chart Data Presentation. This vibrant 3D rendering showcases a bar chart and pie chart, illustrating data growth and proportions. Ideal for presentations, reports, or educational materials. The colorful design makes it visually appealing and easy to understand.
Free with trial A 3D rendered icon featuring a vibrant blue circular shape with a white percentage symbol prominently displayed in the center. The icon has a glossy finish and is presented on a white background, making it suitable for various digital and print applications related to finance, sales, and discounts. Analysis decrease illustrations Blue Circle With White Percentage Symbol 3D Icon sign. A 3D rendered icon featuring a vibrant blue circular shape with a white percentage symbol prominently displayed in the center. The icon has a glossy finish and is presented on a white background, making it suitable for various digital and print applications related to finance, sales, and discounts