Free with trial The Economic Recession 3D Icon Render Clipart is a striking design of realistic and professional 3D illustrations that represent key elements of an economic downturn. Arrow financial growth decrease vectors Economic Recession 3d icon render clipart
Free with trial A 3D illustration of four golden coins with dollar signs, arranged above three red downward-pointing arrows, symbolizing financial decline or loss, isolated on a white background. Arrow financial growth decrease illustrations Four yellow coins with dollar signs and three red arrows pointing down, isolated on white background. A 3D illustration of four golden coins with dollar signs, arranged above three red downward-pointing arrows, symbolizing financial decline or loss, isolated on a white background
Free with trial Eight circular icons with black backgrounds each feature a different chart or graph symbol. The frames are bordered by a sequence of colorful lines: red, green, blue, and yellow. The icons include bar graphs, line graphs, a pie chart, and scatter plots, all depicted in white. Each symbol includes axes and grid patterns, indicating statistical or financial data representation. The arrangement is in two rows of four, emphasizing symmetry and variety in chart types. A i Generated. Arrow financial growth decrease vectors Collection of eight different chart and graph icons displayed in circular black frames with colorful borders. Eight circular icons with black backgrounds each feature a different chart or graph symbol. The frames are bordered by a sequence of colorful lines: red, green, blue, and yellow. The icons include bar graphs, line graphs, a pie chart, and scatter plots, all depicted in white. Each symbol includes axes and grid patterns, indicating statistical or financial data representation. The arrangement is in two rows of four, emphasizing symmetry and variety in chart types. A i Generated
Free with trial The Economic Recession 3D Icon Render Clipart is a striking design of realistic and professional 3D illustrations that represent key elements of an economic downturn. Arrow financial growth decrease vectors Economic Recession 3d icon render clipart
Free with trial The Economic Recession 3D Icon Render Clipart is a striking design of realistic and professional 3D illustrations that represent key elements of an economic downturn. Arrow financial growth decrease vectors Economic Recession 3d icon render clipart
Free with trial The Economic Recession 3D Icon Render Clipart is a striking design of realistic and professional 3D illustrations that represent key elements of an economic downturn. Arrow financial growth decrease vectors Economic Recession 3d icon render clipart
Free with trial Percent down icon vector line logo mark or symbol set collection outline style. Arrow financial growth decrease vectors Percent down icon vector
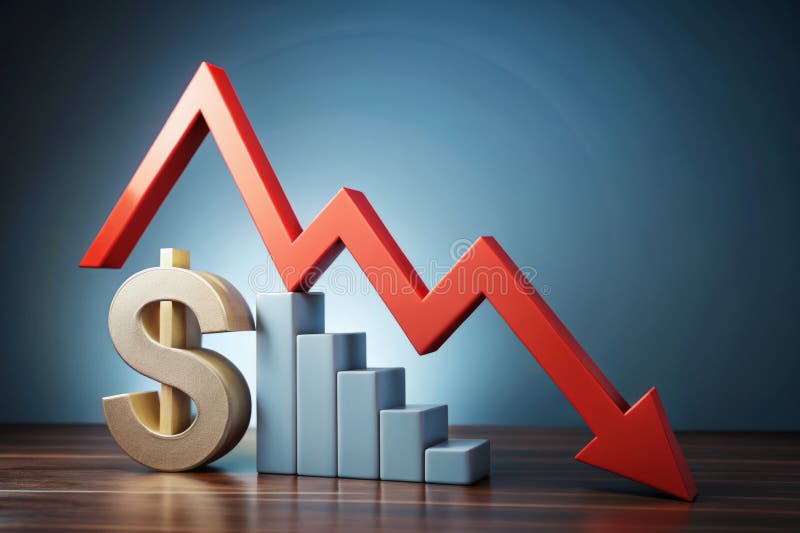
Free with trial This 3D rendering shows a bar graph with a sharp downward trend, symbolized by a large red arrow. The graph visually represents a significant decline or decrease in a particular metric. The dark red bars and bright red arrow create a strong visual impact. Arrow financial growth decrease illustrations Declining Bar Graph. This 3D rendering shows a bar graph with a sharp downward trend, symbolized by a large red arrow. The graph visually represents a significant decline or decrease in a particular metric. The dark red bars and bright red arrow create a strong visual impact.
Free with trial A grid of black icons representing various types of graphs and charts, including bar graphs and line graphs with upward arrows, on a white background. Arrow financial growth decrease vectors Collection of Ai-Generated black and white graph and chart icons. A grid of black icons representing various types of graphs and charts, including bar graphs and line graphs with upward arrows, on a white background
Free with trial Set of economic crisis icons. Thin linear style icons Pack. Vector Illustration Outline icons collection. Arrow financial growth decrease vectors Set of economic crisis icons. Thin linear style icons Pack. Vector Illustration
Free with trial The business concept of both crisis and recovery. Arrow financial growth decrease illustrations Business concept of both crisis and recovery
Free with trial A close-up image of an orange percentage symbol leaning against a wooden surface. Arrow financial growth decrease illustrations Increasing Percentage Interest Rate Shown with Stacks of Coins. A close-up image of an orange percentage symbol leaning against a wooden surface.
Free with trial Reduction chart icon set in thin line outline style and linear vector sign. Arrow financial growth decrease vectors Reduction chart icon thin line illustration. Reduction chart icon set in thin line outline style and linear vector sign
Free with trial Reduction chart icon vector line logo mark or symbol set collection outline style. Arrow financial growth decrease vectors Reduction chart icon thin line illustration. Reduction chart icon vector line logo mark or symbol set collection outline style
Free with trial Business banner red, decreasing pointing down red and black arrows business composition on red backdrop banner. Arrow financial growth decrease vectors Business banner red, decreasing pointing down red and black arrows business composition
Free with trial Digita blue bar charts descend steadily across a digital grid, illustrating a decline in financial performance and market trends. Downward arrows emphasize loss, negative growth, and economic challenges, while smooth transitions and a tech-inspired layout enhance the visual impact of the data downturn. Arrow financial growth decrease illustrations Digital blue bar chart with decreasing business concept. Digita blue bar charts descend steadily across a digital grid, illustrating a decline in financial performance and market trends. Downward arrows emphasize loss, negative growth, and economic challenges, while smooth transitions and a tech-inspired layout enhance the visual impact of the data downturn.
Free with trial Economic recovery concept with the line charts. Arrow financial growth decrease illustrations Economic recovery concept with the line charts
Free with trial Presentation board with decreasing bar graph for business statistics. Arrow financial growth decrease vectors Presentation board with decreasing bar graph for business statistics
Free with trial Barrel oil with stock charts of oil price quotes. Generative AI. Arrow financial growth decrease illustrations Barrel oil with stock charts of oil price quotes
Free with trial Conceptual illustration of a document showing market volatility with up and down arrows, and a dollar symbol for currency. Arrow financial growth decrease illustrations Document with up and down arrows showing market volatility and dollar currency sign. Conceptual illustration of a document showing market volatility with up and down arrows, and a dollar symbol for currency
Free with trial Sad Character Observing a Declining Graph in a Minimalist Illustration j. Arrow financial growth decrease illustrations Sad Character Observing a Declining Graph in a Minimalist Illustration
Free with trial Down graphic of business stats outline icon in white and black colors. down graphic of business stats flat vector icon from business collection for web, mobile apps and ui. Arrow financial growth decrease vectors Down graphic of business stats outline icon in white and black colors. down graphic of business stats flat vector icon from
Free with trial Two lines illustrate a contrasting trend, one declining and the other rising, blending harmoniously in shades of orange, evoking a sense of change. Arrow financial growth decrease illustrations Dynamic Trends Showcased Through Contrasting Lines in Warm Hues of Orange. Two lines illustrate a contrasting trend, one declining and the other rising, blending harmoniously in shades of orange, evoking a sense of change
Free with trial Gold coins with bitcoin and dollar signs showing contrasting financial trends with long shadows on a blue background. Arrow financial growth decrease illustrations Bitcoin increasing while dollar decreasing showing cryptocurrency investment success. Gold coins with bitcoin and dollar signs showing contrasting financial trends with long shadows on a blue background
Free with trial GDP Decline line icon. Universal creative premium symbol. Vector sign icon logo template. Vector illustration. Arrow financial growth decrease vectors GDP Decline line icon. Universal creative premium symbol. Vector sign icon logo template. Vector illustration
Free with trial Woman dressed in gray and red points at a downward red line graph symbolizing loss or decline, conveying concern and analysis mood. Generative AI. Arrow financial growth decrease vectors Woman pointing at declining red line graph showing financial loss vector illustration. Woman dressed in gray and red points at a downward red line graph symbolizing loss or decline, conveying concern and analysis mood. Generative AI
Free with trial This image captures a conceptual business planning session, suggesting a focus on market trend analysis, charting of progress and addressing potential declines. Arrow financial growth decrease illustrations Conceptual business strategy session with downward trend and coffee break. This image captures a conceptual business planning session, suggesting a focus on market trend analysis, charting of progress and addressing potential declines
Free with trial Wooden blocks spelling TAX with the last block showing up and down arrows, illustrating the concept of tax changes, fluctuations, and economic uncertainty. The image conveys the dynamic nature of taxation and its potential impact. Arrow financial growth decrease illustrations Tax concept wooden blocks illustrating changes fluctuations and uncertainty. Wooden blocks spelling TAX with the last block showing up and down arrows, illustrating the concept of tax changes, fluctuations, and economic uncertainty. The image conveys the dynamic nature of taxation and its potential impact
Free with trial Concept of high interest rates and heavy loan payments, economic recession, risk of debt burden. Vector illustration. Arrow financial growth decrease vectors Concept of high interest rates and heavy loan payments, economic recession, risk of debt burden.
Free with trial Revenue Decline line icon. Universal creative premium symbol. Vector sign icon logo template. Vector illustration. Arrow financial growth decrease vectors Revenue Decline line icon. Universal creative premium symbol. Vector sign icon logo template. Vector illustration
Free with trial The up and down nature of interest rates is the subject of this 3-d illustration with percentage rate symbols indicating either up or down movement. Arrow financial growth decrease illustrations The up and down nature of interest rates is the subject of this 3-d illustration with percentage rate symbols
Free with trial A man in a blue suit holds a glowing blue bar graph showing increasing quality and decreasing cost with arrows and text. Arrow financial growth decrease illustrations Businessman holding glowing bar graph showing cost reduction and quality increase. A man in a blue suit holds a glowing blue bar graph showing increasing quality. A man in a blue suit holds a glowing blue bar graph showing increasing quality and decreasing cost with arrows and text
Free with trial Downward trend chart with falling interest rates or discounts depicted by price tag. Arrow financial growth decrease vectors Downward trend chart with falling interest rates or discounts depicted by price tag
Free with trial Stock market bear market. Downward tread chart on the investment. Bear trader wearing eyeglasses sitting at office monitoring stock market. Generative Ai. Arrow financial growth decrease illustrations Bull trader wearing eyeglasses sitting at office monitoring stock market. Generative Ai. Stock market bear market. Downward tread chart on the investment. Bear trader wearing eyeglasses sitting at office monitoring stock market. Generative Ai
Free with trial A stylized stock market chart showing a downward trend with blue and orange bars on white. Generative AI. Arrow financial growth decrease illustrations A stylized stock market chart showing a downward trend with blue and orange bars on white
Free with trial This image visually depicts the impact of declining currency and interest rates within an economic context. A percentage model, a fundamental tool in economic analysis, serves as the foundation. The downward-pointing arrow dramatically illustrates the negative trend, signifying a decrease in both the value of a specific currency and the interest rates associated with loans and investments. This. Arrow financial growth decrease illustrations Understanding Declining Currency and Interest Rates: A Visual Representation of Economic Trends. This image visually depicts the impact of declining currency and interest rates within an economic context. A percentage model, a fundamental tool in economic analysis, serves as the foundation. The downward-pointing arrow dramatically illustrates the negative trend, signifying a decrease in both the value of a specific currency and the interest rates associated with loans and investments. This
Free with trial Business refers to the organized efforts and activities of individuals or groups to produce, buy, sell, and exchange goods or services for profit. Arrow financial growth decrease illustrations The piggy bank and coins for Business concept 3d rendering. Business refers to the organized efforts and activities of individuals or groups to produce, buy, sell, and exchange goods or services for profit
Free with trial Cost reduction concept on wooden cube, Expenses and saving money, Business strategy and project management, cost reduction, efficient business and budget cutting. Arrow financial growth decrease illustrations Cost reduction concept on wooden cube, Expenses and saving money, Business strategy and project management, cost reduction
Free with trial Reduction chart icon vector logo set collection for web app ui. Arrow financial growth decrease vectors Reduction chart icon set depicting data reduction symbols, ideal for business analytics and performance visuals. Reduction chart icon vector logo set collection for web app ui
Free with trial Business refers to the organized efforts and activities of individuals or groups to produce, buy, sell, and exchange goods or services for profit. Arrow financial growth decrease illustrations The piggy bank and coins for Business concept 3d rendering. Business refers to the organized efforts and activities of individuals or groups to produce, buy, sell, and exchange goods or services for profit
Free with trial Business refers to the organized efforts and activities of individuals or groups to produce, buy, sell, and exchange goods or services for profit. Arrow financial growth decrease illustrations The piggy bank and coins for Business concept 3d rendering. Business refers to the organized efforts and activities of individuals or groups to produce, buy, sell, and exchange goods or services for profit
Free with trial Business refers to the organized efforts and activities of individuals or groups to produce, buy, sell, and exchange goods or services for profit. Arrow financial growth decrease illustrations The piggy bank and coins for Business concept 3d rendering. Business refers to the organized efforts and activities of individuals or groups to produce, buy, sell, and exchange goods or services for profit
Free with trial The image is a digital illustration of a stock market chart. The chart is blue in color and has a line graph in the center. The line graph shows a downward trend, indicating a decrease in the stock market. On the top left corner of the chart, there is a white text that reads "10. 03570". The background of the image is made up of small white dots, which are scattered across the chart. Arrow financial growth decrease illustrations The image is a digital illustration of a stock market chart. The chart is blue in color and has a line graph in the center.
Free with trial The Red Bear on Mother Board for Business concept 3d Rendering. Arrow financial growth decrease illustrations The Red Bear on Mother Board for Business concept 3d Rendering
Free with trial The Red Bear on Mother Board for Business concept 3d Rendering. Arrow financial growth decrease illustrations The Red Bear on Mother Board for Business concept 3d Rendering
Free with trial Lower price. Text effect design with modern colors and 3D font look. Arrow financial growth decrease illustrations Lower price. Text effect with modern colors and 3D font look
Free with trial The Red Bear on Mother Board for Business concept 3d Rendering. Arrow financial growth decrease illustrations The Red Bear on Mother Board for Business concept 3d Rendering
Free with trial The Red Bear on Mother Board for Business concept 3d Rendering. Arrow financial growth decrease illustrations The Red Bear on Mother Board for Business concept 3d Rendering
Free with trial The Red Bear on Mother Board for Business concept 3d Rendering. Arrow financial growth decrease illustrations The Red Bear on Mother Board for Business concept 3d Rendering
Free with trial The Red Bear on Mother Board for Business concept 3d Rendering. Arrow financial growth decrease illustrations The Red Bear on Mother Board for Business concept 3d Rendering
Free with trial The Red Bear on Mother Board for Business concept 3d Rendering. Arrow financial growth decrease illustrations The Red Bear on Mother Board for Business concept 3d Rendering
Free with trial Vector icon of percentage change with up and down arrows. Interest rate and discount fluctuation concept. Arrow financial growth decrease vectors Vector icon of percentage change with up and down arrows. Interest rate and discount fluctuation concept
Free with trial Wooden blocks displaying inflation symbols next to stacks of coins, with a hand adding to the higher stack, symbolizing rising costs and decreasing purchasing power. Arrow financial growth decrease illustrations Inflation concept with wooden blocks coins and hand showing rising costs and decreasing purchasing power. wooden blocks displaying inflation symbols next to stacks of coins, with a hand adding to the higher stack, symbolizing rising costs and decreasing purchasing power.
Free with trial Animated Stream Of Interfaces With Economic and stock information in blue color. Arrow financial growth decrease illustrations Animated Stream Of Interfaces With Economic and stock information in blue color
Free with trial Animated Stream Of Interfaces With Economic and stock information in blue color. Arrow financial growth decrease illustrations Animated Stream Of Interfaces With Economic and stock information in blue color
Free with trial Animated Stream Of Interfaces With Economic and stock information in blue color. Arrow financial growth decrease illustrations Animated Stream Of Interfaces With Economic and stock information in blue color
Free with trial Animated Stream Of Interfaces With Economic and stock information in blue color. Arrow financial growth decrease illustrations Animated Stream Of Interfaces With Economic and stock information in blue color
Free with trial Animated Stream Of Interfaces With Economic and stock information in blue color. Arrow financial growth decrease illustrations Animated Stream Of Interfaces With Economic and stock information in blue color
Free with trial Businessman analyzes office management. The performance concept improves quality, speed, and efficiency and reduces costs. Cost Reduction concept. trend modern vector flat illustration. Arrow financial growth decrease vectors Businessman analyzes office management. The performance concept improves quality, speed, and efficiency and reduces costs.
Free with trial Stock market plunged falling down, economic crash, investing failure or mistake, price drop, recession, investment risk concept, graph fall down to the floor. Arrow financial growth decrease illustrations Economic crash, investing failure or mistake, price drop, recession, investment risk concept, graph fall down to the floor.
Free with trial Two entrepreneurs created a business strategy to reduce project operational costs using laptops. Cost Reduction concept. trend modern vector flat illustration. Arrow financial growth decrease vectors Two entrepreneurs created a business strategy to reduce project operational costs using laptops. Cost Reduction concept.
Free with trial That US economy is changing the trend and goes up instead of down (or vice versa). 3D rendering on blue background. Arrow financial growth decrease illustrations That US economy is changing the trend and goes up instead of down (or vice versa).
Free with trial That US economy is changing the trend and goes up instead of down (or vice versa). 3D rendering on green background. Arrow financial growth decrease illustrations That US economy is changing the trend and goes up instead of down (or vice versa).
Free with trial That US economy is changing the trend and goes up instead of down (or vice versa). 3D rendering on wooden background. Arrow financial growth decrease illustrations That US economy is changing the trend and goes up instead of down (or vice versa).
Free with trial That US economy is changing the trend and goes up instead of down (or vice versa). 3D rendering on green background. Arrow financial growth decrease illustrations That US economy is changing the trend and goes up instead of down (or vice versa).
Free with trial That US economy is changing the trend and goes up instead of down (or vice versa). 3D rendering on red background. Arrow financial growth decrease illustrations That US economy is changing the trend and goes up instead of down (or vice versa).
Free with trial That US economy is changing the trend and goes up instead of down (or vice versa). 3D rendering on orange background. Arrow financial growth decrease illustrations That US economy is changing the trend and goes up instead of down (or vice versa).
Free with trial That US economy is changing the trend and goes up instead of down (or vice versa). 3D rendering on yellow background. Arrow financial growth decrease illustrations That US economy is changing the trend and goes up instead of down (or vice versa).
Free with trial That US economy is changing the trend and goes up instead of down (or vice versa). 3D rendering on orange background. Arrow financial growth decrease illustrations That US economy is changing the trend and goes up instead of down (or vice versa).
Free with trial That US economy is changing the trend and goes up instead of down (or vice versa). 3D rendering on red background. Arrow financial growth decrease illustrations That US economy is changing the trend and goes up instead of down (or vice versa).
Free with trial That US economy is changing the trend and goes up instead of down (or vice versa). Supports PNG files with transparent backgrounds. Arrow financial growth decrease vectors That US economy is changing the trend and goes up instead of down (or vice versa)
Free with trial That US economy is changing the trend and goes up instead of down (or vice versa). 3D rendering on gold background. Arrow financial growth decrease illustrations That US economy is changing the trend and goes up instead of down (or vice versa).
Free with trial Animated Stream Of Interfaces With Economic and stock information red and yellow color, speculation fall. Arrow financial growth decrease illustrations Animated Stream Of Interfaces With Economic and stock information red and yellow color, speculation fall
Free with trial Animated Stream Of Interfaces With Economic and stock information red and yellow color, speculation fall. Arrow financial growth decrease illustrations Animated Stream Of Interfaces With Economic and stock information red and yellow color, speculation fall
Free with trial Animated Stream Of Interfaces With Economic and stock information red and yellow color, speculation fall. Arrow financial growth decrease illustrations Animated Stream Of Interfaces With Economic and stock information red and yellow color, speculation fall
Free with trial Animated Stream Of Interfaces With Economic and stock information red and yellow color, speculation fall. Arrow financial growth decrease illustrations Animated Stream Of Interfaces With Economic and stock information red and yellow color, speculation fall
Free with trial Animated Stream Of Interfaces With Economic and stock information red and yellow color, speculation fall. Arrow financial growth decrease illustrations Animated Stream Of Interfaces With Economic and stock information red and yellow color, speculation fall
Free with trial Loan Related and Investment Line Vector Icon. Investment, Percentage, Interest Rate. Low total cost icon vector image. Thin Outline Vector illustration isolated on background. Arrow financial growth decrease vectors Loan Related and Investment Line Vector Icon. Investment, Percentage, Interest Rate. Low total cost icon vector image.
Free with trial Loan Related and Investment Line Vector Icon. Investment, Percentage, Interest Rate. Low total cost icon vector image. Thin Outline Vector illustration isolated on background. Arrow financial growth decrease vectors Loan Related and Investment Line Vector Icon. Investment, Percentage, Interest Rate. Low total cost icon vector image.