Free with trial Black and white vector logo of a simple house outline with stylized upward arrow and a small dollar sign icon, simple design, on a solid background, simple shapes, flat illustration style, simple lines, no shadows or gradients, symmetrical composition, centered, no text, high contrast, no color, high resolution, very detailed, high definition --chaos 30 --ar 16:9 --v 7 Job ID: cfd6ce0d-9e1a-412b-. Arrow financial growth decrease illustrations Dollar Sign with Arrows Showing Income and Expenses Under a Roof. black and white vector logo of a simple house outline with stylized upward arrow and a small dollar sign icon, simple design, on a solid background, simple shapes, flat illustration style, simple lines, no shadows or gradients, symmetrical composition, centered, no text, high contrast, no color, high resolution, very detailed, high definition --chaos 30 --ar 16:9 --v 7 Job ID: cfd6ce0d-9e1a-412b-
Free with trial Colorful flat design depicts bull and bear market fluctuation. Rising and falling arrows symbolize investment direction with a simple yet informative design. Arrow financial growth decrease vectors Bull and Bear Market Illustration with Price Fluctuation Indicators on Black Background. Colorful flat design depicts bull and bear market fluctuation. Rising and falling arrows symbolize investment direction with a simple yet informative design.
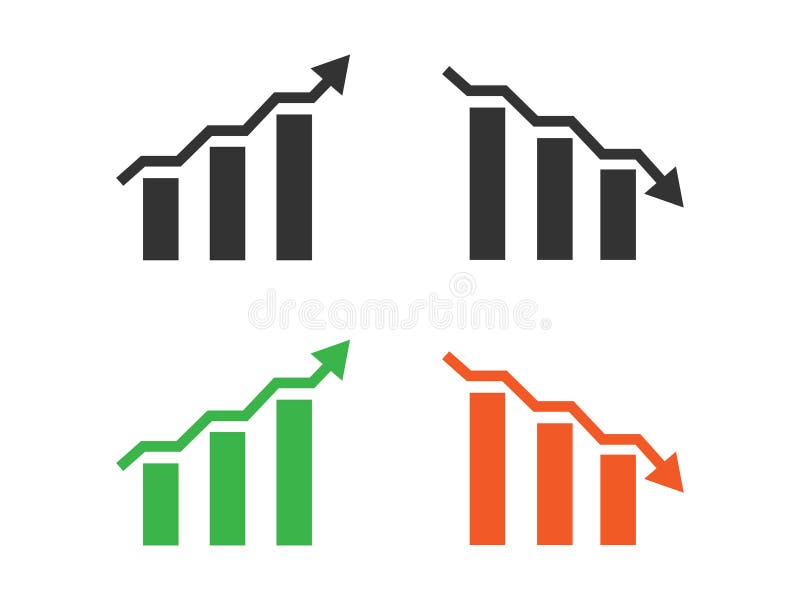
Free with trial Three green arrows pointing downwards, each displaying a white percentage symbol. Isolated on a transparent background. Arrow financial growth decrease vectors Three Green Downward Arrows with Percent Symbol isolated on a transparent background. Three green arrows pointing downwards, each displaying a white percentage symbol. Isolated on a transparent background
Free with trial Cubes form the German expression 'Leitzins 0. 25 percent' (key interest rate 0. 25 percent). Symbol for the increase or decrease of the key interest rate by the European central bank. Arrow financial growth decrease illustrations Cubes form the German expression \'Leitzins 0.25 percent\' (key interest rate 0.25 percent). Cubes form the German expression 'Leitzins 0.25 percent' (key interest rate 0.25 percent). Symbol for the increase or decrease of the key interest rate by the European central bank.
Free with trial A stylized stock market chart showing a downward trend with blue and orange bars on white. Generative AI. Arrow financial growth decrease illustrations A stylized stock market chart showing a downward trend with blue and orange bars on white
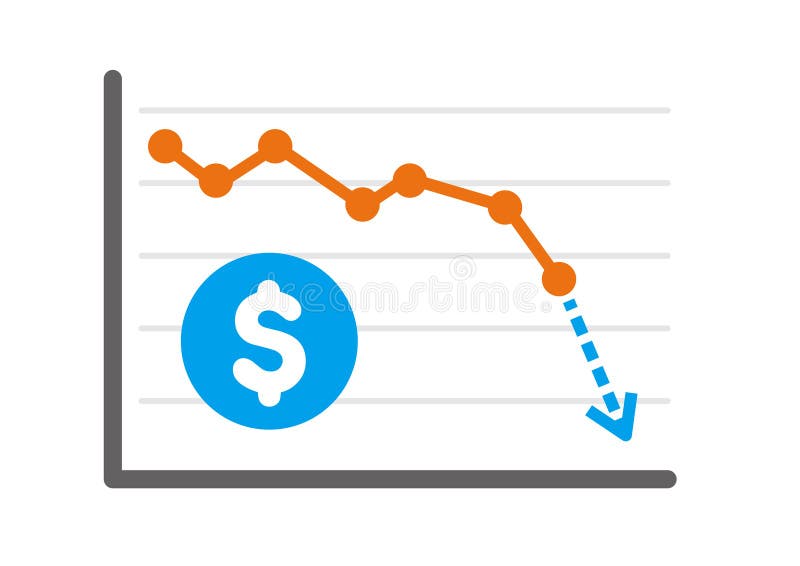
Free with trial Financial success and loss, currency value change, stock market fluctuation, investment profit risk, economic business analysis. Arrow financial growth decrease vectors Gold coins with dollar sign showing market trend up and down arrows. Financial success and loss, currency value change, stock market fluctuation, investment. Financial success and loss, currency value change, stock market fluctuation, investment profit risk, economic business analysis
Free with trial Two different graphs with a downward trend. One is red and the other is white. Arrow financial growth decrease illustrations Two different graphs with a downward trend
Free with trial Image is a conceptual photograph featuring a close-up view of four wooden blocks arranged in a row, each with a letter printed in black, spelling out the word 'COST'. On top of each block, there is a stack of coins, with the number of coins decreasing from left to right. Above the blocks, a white zigzag arrow points downward, symbolizing a reduction or decrease. The background is blurred, with a. Arrow financial growth decrease illustrations Cost reduction concept with coins and blocks. Image is a conceptual photograph featuring a close-up view of four wooden blocks arranged in a row, each with a letter printed in black, spelling out the word 'COST'. On top of each block, there is a stack of coins, with the number of coins decreasing from left to right. Above the blocks, a white zigzag arrow points downward, symbolizing a reduction or decrease. The background is blurred, with a
Free with trial Four blue square icons with arrows indicating percentage changes, two with upward green arrows and two with downward red arrows. Arrow financial growth decrease illustrations Set of four icons showing percentage changes. Four blue square icons with arrows indicating percentage changes, two with upward green arrows and two with downward red arrows
Free with trial A creative visual representation of the impact of tax increases on savings, featuring a hand holding a 'TAX' block above stacks of coins with percentage blocks, a jar of coins, and a house model in the background. Arrow financial growth decrease illustrations Tax Increase Concept with Coins and House Model. A creative visual representation of the impact of tax increases on savings, featuring a hand holding a 'TAX' block above stacks of coins with percentage blocks, a jar of coins, and a house model in the background.
Free with trial Set of twelve linear icons representing various business and financial concepts. These include documents, briefcase, graphs, charts, and more. Ideal for presentations, websites, or app design. Arrow financial growth decrease vectors Collection of Business and Finance Line Icons. Set of twelve linear icons representing various business and financial concepts. These include documents, briefcase, graphs, charts, and more. Ideal for presentations, websites, or app design.
Free with trial Financial-themed illustration featuring bar and line graphs with upward trends, a red percentage symbol, and a pie chart with dollar signs. A laptop displays an arrow with coins, suggesting growth. Circular icons with arrows indicate increase and decrease, emphasizing data fluctuation. The background is light blue. Arrow financial growth decrease vectors Charts and diagram icon set. Charts and graphs. Pie , Line , Candlestick Chart. Planning and visualization of statistics. Financial-themed illustration featuring bar and line graphs with upward trends, a red percentage symbol, and a pie chart with dollar signs. A laptop displays an arrow with coins, suggesting growth. Circular icons with arrows indicate increase and decrease, emphasizing data fluctuation. The background is light blue.
Free with trial US Dollar Exchange Chart Illustration Falling. Arrow financial growth decrease illustrations US Dollar Exchange Chart Illustration Falling
Free with trial Fuel Pump Nozzle With Glowing Gasoline Drop and Market Chart. Arrow financial growth decrease illustrations Fuel Pump Nozzle With Glowing Gasoline Drop and Market Chart
Free with trial A depiction of business challenges with a figure expressing concern over declining market trends, represented by stacks of coins and a decreasing chart. Arrow financial growth decrease illustrations Business Struggles and Market Trends with Coins and Figure. A depiction of business challenges with a figure expressing concern over declining market trends, represented by stacks of coins and a decreasing chart
Free with trial A graph with two lines, one red and one blue. The red line is higher than the blue line, indicating a positive trend. Arrow financial growth decrease vectors A graph with a red line and a blue line. A graph with two lines, one red and one blue. The red line is higher than the blue line, indicating a positive trend
Free with trial Conceptual image depicting declining sales and the need for analysis. Arrow financial growth decrease illustrations Declining Sales Analysis Magnifying Glass, Chart, Calendar. Conceptual image depicting declining sales and the need for analysis.
Free with trial Japanese Yen Exchange Chart Illustration Falling. Arrow financial growth decrease illustrations Japanese Yen Exchange Chart Illustration Falling
Free with trial Statistical bar chart icon with upward and downward curved arrows. Business trend performance symbol illustration. Arrow financial growth decrease vectors Statistical bar chart icon with upward and downward curved arrows. Business trend performance symbol
Free with trial Cost reduction icon linear logo mark set collection in black and white. Arrow financial growth decrease vectors Cost reduction icon linear logo isolated. Cost reduction icon linear logo mark set collection in black and white
Free with trial A black and white icon depicting a decreasing percentage graph under a magnifying glass, representing sales drop, loss,. Arrow financial growth decrease illustrations Decreasing Percentage Magnifier Icon Sales Drop, Loss Concept. A black and white icon depicting a decreasing percentage graph under a magnifying glass, representing sales drop, loss,.
Free with trial Reduction chart icon Vector symbol or sign set collection in black and white outline. Arrow financial growth decrease vectors Reduction chart icon flat line symbol set. Reduction chart icon Vector symbol or sign set collection in black and white outline
Free with trial This graphic shows the dollar symbol within a horizontal rectangle with arrows indicating up and down movement, representing changes in finance or economic fluctuation, isolated on white. Arrow financial growth decrease vectors Up and Down: Dollar Fluctuation Graphic Symbol in Black and White. This graphic shows the dollar symbol within a horizontal rectangle with arrows indicating up and down movement, representing changes in finance or economic fluctuation, isolated on white.
Free with trial US Dollar Exchange Rate Chart Illustration Forecast. Arrow financial growth decrease illustrations US Dollar Exchange Rate Chart Illustration Forecast
Free with trial Collection of simple black vector icons representing financial charts, data analysis graphs, and business statistics. Includes trend arrows, magnifier, and settings symbols. Arrow financial growth decrease illustrations Set of black business graph and chart icons for data analysis. Collection of simple black vector icons representing financial charts, data analysis graphs, and business statistics. Includes trend arrows, magnifier, and settings symbols
Free with trial Shiny red and green arrows intersecting symbolize opposing directions or viewpoints This graphic is suitable for business presentations or conflict resolution materials. Arrow financial growth decrease illustrations Red and Green Arrows Pointing in Opposite Directions Symbolize Conflict. Shiny red and green arrows intersecting symbolize opposing directions or viewpoints This graphic is suitable for business presentations or conflict resolution materials
Free with trial A hand-drawn business graph showing a decreasing trend line. It represents a down market, financial loss, economic downturn, or a business crisis. This could be used to illustrate various business presentations or reports. Arrow financial growth decrease illustrations Hand Drawn Business Graph with Decreasing Trend Line on White Background. A hand-drawn business graph showing a decreasing trend line. It represents a down market, financial loss, economic downturn, or a business crisis. This could be used to illustrate various business presentations or reports
Free with trial A simple line drawing depicts a magnifying glass focusing on a declining bar chart with a downward arrow and zig-zag. Arrow financial growth decrease illustrations Declining Market Analysis Magnifying Glass, Downward Trend Chart. A simple line drawing depicts a magnifying glass focusing on a declining bar chart with a downward arrow and zig-zag.
Free with trial A detailed close-up shot of a stock market chart display featuring multiple graphs and charts divided into sections representing different market aspects, including a red line graph labeled OTC Markets, a blue line graph showing a downward trend, another section with an upward trend marked by a red downward arrow, and additional charts on the right side displaying stock performance over time with. Arrow financial growth decrease illustrations Close-up view of multiple stock market charts and graphs showing OTC markets performance with upward and downward trends. A detailed close-up shot of a stock market chart display featuring multiple graphs and charts divided into sections representing different market aspects, including a red line graph labeled OTC Markets, a blue line graph showing a downward trend, another section with an upward trend marked by a red downward arrow, and additional charts on the right side displaying stock performance over time with
Free with trial Red arrows illustrate upward and downward trends among scattered gold coins and stacks. Arrow financial growth decrease vectors Financial graph showing rise and fall with stacks of gold coins. Red arrows illustrate upward and downward trends among scattered gold coins and stacks
Free with trial Declining Bar Graph Representing Downturn or Reduction in Statistics. Arrow financial growth decrease vectors Declining Bar Graph Representing Downturn or Reduction in Statistics
Free with trial Japanese Yen Exchange Rate Chart Illustration Forecast. Arrow financial growth decrease illustrations Japanese Yen Exchange Rate Chart Illustration Forecast
Free with trial A person in a suit points a finger at a percentage symbol. The symbol is surrounded by red and green arrows on a dark background. The composition is close-up. Arrow financial growth decrease illustrations Businessman pointing at percentage symbol with red and green arrows on a dark background finance. A person in a suit points a finger at a percentage symbol. The symbol is surrounded by red and green arrows on a dark background. The composition is close-up
Free with trial Hand-drawn graph of business progress, with upward and downward arrows. Arrow financial growth decrease vectors Hand-drawn graph of business progress, with upward and downward arrows
Free with trial A magnifying glass highlights a "Buy" signal amidst a declining stock market graph. Arrow financial growth decrease illustrations Buy Opportunity Stock Market Downturn Analysis with Magnifying Glass. A magnifying glass highlights a "Buy" signal amidst a declining stock market graph.
Free with trial That US economy is changing the trend and goes up instead of down (or vice versa). Supports PNG files with transparent backgrounds. Arrow financial growth decrease vectors That US economy is changing the trend and goes up instead of down (or vice versa).
Free with trial That US economy is changing the trend and goes up instead of down (or vice versa). Supports PNG files with transparent backgrounds. Arrow financial growth decrease vectors That US economy is changing the trend and goes up instead of down (or vice versa)
Free with trial That US economy is changing the trend and goes up instead of down (or vice versa). Supports PNG files with transparent backgrounds. Arrow financial growth decrease vectors That US economy is changing the trend and goes up instead of down (or vice versa)
Free with trial That US economy is changing the trend and goes up instead of down (or vice versa). Supports PNG files with transparent backgrounds. Arrow financial growth decrease vectors That US economy is changing the trend and goes up instead of down (or vice versa)
Free with trial The visual features a black line graph illustration showing a downward trend. Positioned on a light blue backdrop, the minimalist design may represent decline, loss or negative progression. The image suits presentations, reports, or articles related to finance, statistics, business, or economic subjects, for editorial or commercial use. Arrow financial growth decrease illustrations Decreasing trend line graph on blue background finance visual concept. The visual features a black line graph illustration showing a downward trend. Positioned on a light blue backdrop, the minimalist design may represent decline, loss or negative progression. The image suits presentations, reports, or articles related to finance, statistics, business, or economic subjects, for editorial or commercial use
Free with trial Graph chart going up and down sign arrows flat design vector illustration on white background. Arrow financial growth decrease vectors Graph chart going up and down sign arrows flat design vector illustration
Free with trial Interest rate cuts diminish savings investment returns. Visualized impact on yields potential losses. Arrow financial growth decrease illustrations Interest Rate Cuts: Impact on Savings & Investments - Visual Representation of Decreasing Returns. Interest rate cuts diminish savings investment returns. Visualized impact on yields potential losses
Free with trial A visual representation of cost reduction, featuring stacks of coins diminishing in height and wooden blocks spelling out COST. Arrow financial growth decrease illustrations Decreasing Cost Concept Illustrated with Stacks of Coins and Wooden Blocks. A visual representation of cost reduction, featuring stacks of coins diminishing in height and wooden blocks spelling out COST
Free with trial Lower cost icon logo sign vector outline in black and white color. Arrow financial growth decrease vectors Lower cost icon logo set vector. Lower cost icon logo sign vector outline in black and white color
Free with trial A black and white image showing two currency symbols with arrows indicating rising and falling values, representing financial fluctuations. Arrow financial growth decrease illustrations Illustration of fluctuating currency values with upward and downward arrows. A black and white image showing two currency symbols with arrows indicating rising and falling values, representing financial fluctuations
Free with trial A black icon depicting stacked coins, upward and downward arrows, and a dollar sign. Arrow financial growth decrease illustrations Black icon of stacked coins with upward and downward arrows and dollar sign money. A black icon depicting stacked coins, upward and downward arrows, and a dollar sign
Free with trial This is an detailed collection of minimalist line icons representing various business graphs and data trends. Arrow financial growth decrease vectors Professional business graph and data visualization line icon set for reports. This is an detailed collection of minimalist line icons representing various business graphs and data trends
Free with trial Illustration features worried blocks stacked with a data chart and arrows pointing up and down, in a flat, graphic style. Arrow financial growth decrease vectors Worried blocks stacked with data chart and arrows depicting volatile market conditions or economic uncertainty. Illustration features worried blocks stacked with a data chart and arrows pointing up and down, in a flat, graphic style.
Free with trial Digital smartwatch screen with a percentage symbol and circulating directional arrows. Arrow financial growth decrease vectors Digital smartwatch screen with a percentage symbol and circulating directional arrows
Free with trial Lower cost icon Vector symbol or sign set collection in black and white outline. Arrow financial growth decrease vectors Lower cost icon mark in filled style. Lower cost icon Vector symbol or sign set collection in black and white outline
Free with trial A white rectangular featuring a bar chart with blue and gray bars and a line graph with blue and gray lines. Upward and downward arrows with horizontal bars are positioned to the right of the. Arrow financial growth decrease illustrations Blue and gray bar chart with upward and downward arrows on a white background line graph. A white rectangular featuring a bar chart with blue and gray bars and a line graph with blue and gray lines. Upward and downward arrows with horizontal bars are positioned to the right of the
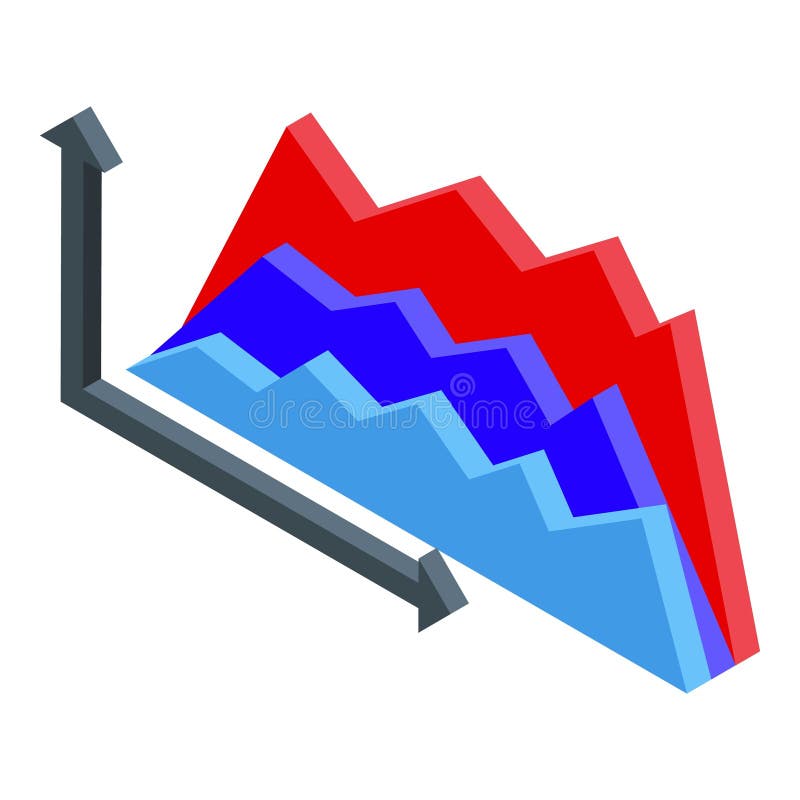
Free with trial Isometric graph showing different trends with ups and downs, concept of trading and business analysis. Arrow financial growth decrease illustrations Isometric graph showing different trends with ups and downs
Free with trial Line icon representing money flow with some arrows going up and others going down. Arrow financial growth decrease vectors Money flow concept with arrows going up and down. Line icon representing money flow with some arrows going up and others going down
Free with trial This is an detailed set of clean line icons for infographic design, corporate data analysis, and finance. Arrow financial growth decrease vectors Clean infographic symbols for corporate data analysis and financial tracking applications. This is an detailed set of clean line icons for infographic design, corporate data analysis, and finance
Free with trial This is an detailed series of analytical icons for data visualization and statistical reporting in a clean line style. Arrow financial growth decrease vectors Comprehensive analytical data and statistics symbols for corporate business presentations. This is an detailed series of analytical icons for data visualization and statistical reporting in a clean line style
Free with trial Concept of volatile market with one stack of coins growing and another one decreasing. Arrow financial growth decrease illustrations Money stack growing while one is decreasing showing market volatility. Concept of volatile market with one stack of coins growing and another one decreasing
Free with trial Cost reduction icon logo sign vector outline in black and white color. Arrow financial growth decrease vectors Cost reduction logo sign set vector outline. Cost reduction icon logo sign vector outline in black and white color
Free with trial Cost symbol dollar increase icon isolated on white background. Set icons colorful. Simple vector logo. Arrow financial growth decrease vectors Cost symbol dollar increase icon isolated on white background. Set icons colorful
Free with trial A flat style illustration of market trend with upward and downward arrows and wavy lines against black background. Arrow financial growth decrease vectors Stock market trend illustration showing upward and downward direction in financial trading. A flat style illustration of market trend with upward and downward arrows and wavy lines against black background.
Free with trial This is an detailed set of line icons showing asset management techniques, cryptocurrency market trends, and professional trading chart indicators. Arrow financial growth decrease vectors Asset management and cryptocurrency trading icons featuring candlestick charts and trend indicators. This is an detailed set of line icons showing asset management techniques, cryptocurrency market trends, and professional trading chart indicators
Free with trial Cost reduction icon Black line art vector in black and white outline set collection sign. Arrow financial growth decrease vectors Cost reduction icon Black line art vector logo. Cost reduction icon Black line art vector in black and white outline set collection sign
Free with trial The Red Bear on Mother Board for Business concept 3d Rendering. Arrow financial growth decrease illustrations The Red Bear on Mother Board for Business concept 3d Rendering
Free with trial A 3D bar graph with a jagged trend line shows rising data followed by a sudden drop, set against a bright blue background. Arrow financial growth decrease illustrations A 3D bar graph with a jagged trend line shows rising data followed by a sudden drop, set against a bright blue background
Free with trial The Red Bear on Mother Board for Business concept 3d Rendering. Arrow financial growth decrease illustrations The Red Bear on Mother Board for Business concept 3d Rendering
Free with trial The Red Bear on Mother Board for Business concept 3d Rendering. Arrow financial growth decrease illustrations The Red Bear on Mother Board for Business concept 3d Rendering
Free with trial Black and white icon of a dollar sign surrounded by arrows pointing up and down, representing market volatility. Arrow financial growth decrease illustrations Dollar currency fluctuating up and down with arrows icon. Black and white icon of a dollar sign surrounded by arrows pointing up and down, representing market volatility
Free with trial A magnifying glass hovers over a grid paper background displaying two line graphs, one red and one blue. The red graph a general upward trend with several peaks and valleys, while the blue graph a downward trend. The magnifying glass focuses on a prominent red upward arrow within the red graph, highlighting an increase. Arrow financial growth decrease illustrations Magnifying glass over red and blue upward and downward trending graphs on grid paper chart data analysis. A magnifying glass hovers over a grid paper background displaying two line graphs, one red and one blue. The red graph a general upward trend with several peaks and valleys, while the blue graph a downward trend. The magnifying glass focuses on a prominent red upward arrow within the red graph, highlighting an increase
Free with trial That US economy is changing the trend and goes up instead of down (or vice versa). 3D rendering on yellow background. Arrow financial growth decrease illustrations That US economy is changing the trend and goes up instead of down (or vice versa)
Free with trial That US economy is changing the trend and goes up instead of down (or vice versa). 3D rendering on black background. Arrow financial growth decrease illustrations That US economy is changing the trend and goes up instead of down (or vice versa)
Free with trial That US economy is changing the trend and goes up instead of down (or vice versa). 3D rendering on green background. Arrow financial growth decrease illustrations That US economy is changing the trend and goes up instead of down (or vice versa)
Free with trial That US economy is changing the trend and goes up instead of down (or vice versa). 3D rendering on blue background. Arrow financial growth decrease illustrations That US economy is changing the trend and goes up instead of down (or vice versa).
Free with trial That US economy is changing the trend and goes up instead of down (or vice versa). 3D rendering on white background. Arrow financial growth decrease illustrations That US economy is changing the trend and goes up instead of down (or vice versa)
Free with trial A businessman in suit pushing a percent sign for your needs. Concept for online bank or your finance company. Special offer, sale, gift. Vector illustration. Arrow financial growth decrease vectors A businessman in suit pushing a percent sign for your needs. Concept for online bank or your finance company. Special
Free with trial Finances statistics descending bars graphic outline icon in white and black colors. finances statistics descending bars graphic flat vector icon from business collection for web, mobile apps and ui. Arrow financial growth decrease vectors Finances statistics descending bars graphic outline icon in white and black colors. finances statistics descending bars graphic
Free with trial Set of chart icons with dollar sign in even silhouette on a white background. The graph shows downward and upward trends. Vector. Arrow financial growth decrease vectors Set of graphic icons with dollar. Set of chart icons with dollar sign in even silhouette on a white background. The graph shows downward and upward trends. Vector
Free with trial Illustration symbolizing economic decline with a descending bar graph and dollar sign. Arrow financial growth decrease vectors Economic downturn concept with bar chart. Illustration symbolizing economic decline with a descending bar graph and dollar sign
Free with trial Percent down icon Thin line illustration set. Arrow financial growth decrease vectors Percent down icon Flat vector set outline. Percent down icon Thin line illustration set
Free with trial Cardboard box with percentage decreases cost graphic vector illustration. Arrow financial growth decrease vectors Cardboard box with percentage decreases cost graphic vector illustration
Free with trial Isometric graph with dollar sign. The graph shows a downward trend. Vector. Arrow financial growth decrease vectors Isometric graphic icon with dollar. Isometric graph with dollar sign. The graph shows a downward trend. Vector
Free with trial Percent down icon vector logo set collection for web app ui. Arrow financial growth decrease vectors Percent down icon Thin line illustration set. Percent down icon vector logo set collection for web app ui