Free with trial Vector illustration of a downward arrow symbolizing economic decline, recession, and financial downturn. Bar chart decrease vectors Vector illustration of a downward arrow symbolizing economic decline, recession
Free with trial A bold infographic in flat-style depicting inflation through an upward red arrow, a concerned professional figure, and financial icons symbolizing rising prices and reduced purchasing power �. Bar chart decrease illustrations . A bold infographic in flat-style depicting inflation through an upward red arrow, a concerned professional figure, and financial icons symbolizing rising prices and reduced purchasing power �
Free with trial Financial arrows up and down icon on circle. Growth and decline graph sign symbol illustration. Bar chart decrease vectors Financial arrows up and down icon on circle. Growth and decline graph sign symbol
Free with trial Dollar and bitcoin Coins with Upward Arrows Representing Financial Growth in Minimalist Flat Style. Bar chart decrease vectors Dollar and bitcoin Coins with Upward Arrows Representing Financial Growth in Minimalist Flat Style
Free with trial A black and white line drawing depicts a magnifying glass focusing on a gear, a descending bar graph, and a. Bar chart decrease illustrations Decline Analysis Magnifying Glass, Gear, and Downward Graph. A black and white line drawing depicts a magnifying glass focusing on a gear, a descending bar graph, and a.
Free with trial A simple line drawing depicts a declining bar graph with an arrow pointing downwards, all viewed through a magnifying. Bar chart decrease illustrations Declining Graph Under Magnifying Glass Loss Analysis Icon. A simple line drawing depicts a declining bar graph with an arrow pointing downwards, all viewed through a magnifying.
Free with trial Graph Declining with Arrow Line Art Minimalist Representation. Bar chart decrease vectors Graph Declining with Arrow Line Art Minimalist Representation
Free with trial This illustration depicts a financial concept with a bar graph showing a downward trend, alternating between green (profit) and red (loss) bars. A red line graph with an arrow indicates a significant decline. To the right, a stack of documents represents a profit and loss statement, with 'Profit' and 'Loss' clearly labeled. This visual is ideal for representing financial performance, business challenges, economic downturns, or the need for strategic adjustments. Bar chart decrease vectors Declining Profit and Loss Statement with Downward Trend Graph. This illustration depicts a financial concept with a bar graph showing a downward trend, alternating between green (profit) and red (loss) bars. A red line graph with an arrow indicates a significant decline. To the right, a stack of documents represents a profit and loss statement, with 'Profit' and 'Loss' clearly labeled. This visual is ideal for representing financial performance, business challenges, economic downturns, or the need for strategic adjustments.
Free with trial Doodle Graph icon. Blue pen hand drawn infographic symbol on a notepaper piece. Line art style graphic design element. Web button with shadow. Decline, save on expences concept. Bar chart decrease vectors Doodle Graph icon
Free with trial A horizontal layout of multiple data visualizations illustrates key trends in HIV treatment and diagnosis, featuring line and bar graphs with upward and downward trajectories indicating changes in patient numbers, diagnosis percentages, and global infection rates, where a blue line graph shows increasing patient counts, a second bar chart reflects diagnosed case percentages, a third displays. Bar chart decrease illustrations HIV treatment progress dashboard with statistical graphs showing patient growth, diagnosis rates, and global trends. A horizontal layout of multiple data visualizations illustrates key trends in HIV treatment and diagnosis, featuring line and bar graphs with upward and downward trajectories indicating changes in patient numbers, diagnosis percentages, and global infection rates, where a blue line graph shows increasing patient counts, a second bar chart reflects diagnosed case percentages, a third displays
Free with trial A detailed view of gold bars and coins under a magnifying glass, set against a backdrop of financial charts and data streams. The image evokes a sense of careful scrutiny and investment analysis in the financial markets. The shiny gold textures contrast with the digital screens, creating a blend of. Bar chart decrease illustrations Golden Investment Analysis. A detailed view of gold bars and coins under a magnifying glass, set against a backdrop of financial charts and data streams. The image evokes a sense of careful scrutiny and investment analysis in the financial markets. The shiny gold textures contrast with the digital screens, creating a blend of
Free with trial This image presents a detailed analysis of business performance metrics, including market share, quarterly sales, and key performance indicators (KPIs. Bar chart decrease illustrations Comprehensive business performance metrics and growth analysis. This image presents a detailed analysis of business performance metrics, including market share, quarterly sales, and key performance indicators (KPIs
Free with trial A prominent 3D metallic US dollar sign stands against a dynamic digital background featuring various financial charts and graphs. The background displays a fluctuating line graph and a colorful bar chart, symbolizing market trends, economic data, and investment performance. This image powerfully conveys concepts of finance, global economy, currency strength, stock market analysis, and wealth management in a modern, digital context. Ideal for illustrating reports, presentations, or articles related to business, banking, and financial growth. Bar chart decrease illustrations US Dollar Symbol with Digital Financial Charts and Market Data. A prominent 3D metallic US dollar sign stands against a dynamic digital background featuring various financial charts and graphs. The background displays a fluctuating line graph and a colorful bar chart, symbolizing market trends, economic data, and investment performance. This image powerfully conveys concepts of finance, global economy, currency strength, stock market analysis, and wealth management in a modern, digital context. Ideal for illustrating reports, presentations, or articles related to business, banking, and financial growth.
Free with trial Businesswoman drags a ripped money bag and losing money and coins for bankruptcy, financial crisis and recession concept illustration. Bar chart decrease vectors Businesswoman Drags Ripped Money Bag and Losing Money and Coins for Bankruptcy, Financial Crisis Recession Concept Illustration. Businesswoman drags a ripped money bag and losing money and coins for bankruptcy, financial crisis and recession concept illustration
Free with trial Dollar Coins with Upward and Downward Arrows Representing Financial Growth and Decline in Minimalist Flat Style. Bar chart decrease vectors Dollar Coins with Upward and Downward Arrows Representing Financial Growth and Decline in Minimalist Flat Style.
Free with trial Business graph with up arrow down arrow logo template. Bar chart decrease vectors Business graph with up arrow down arrow logo template
Free with trial Displaying purple world map with rising red bars, red line graph on slide with green grid. Infographic, analytics, digital, technology, finance, strategic, modern. Bar chart decrease illustrations Displaying purple world map with rising red bars, red line graph on slide with green grid
Free with trial Illustration of a business activities. Bar chart decrease vectors Illustration of a business activities
Free with trial A 3D rendering shows a financial graph with a decreasing rate. The pink arrow points downwards, indicating a loss. The bars represent data points in a business or economic context. Bar chart decrease illustrations Decreasing rate financial graph on white background. A 3D rendering shows a financial graph with a decreasing rate. The pink arrow points downwards, indicating a loss. The bars represent data points in a business or economic context
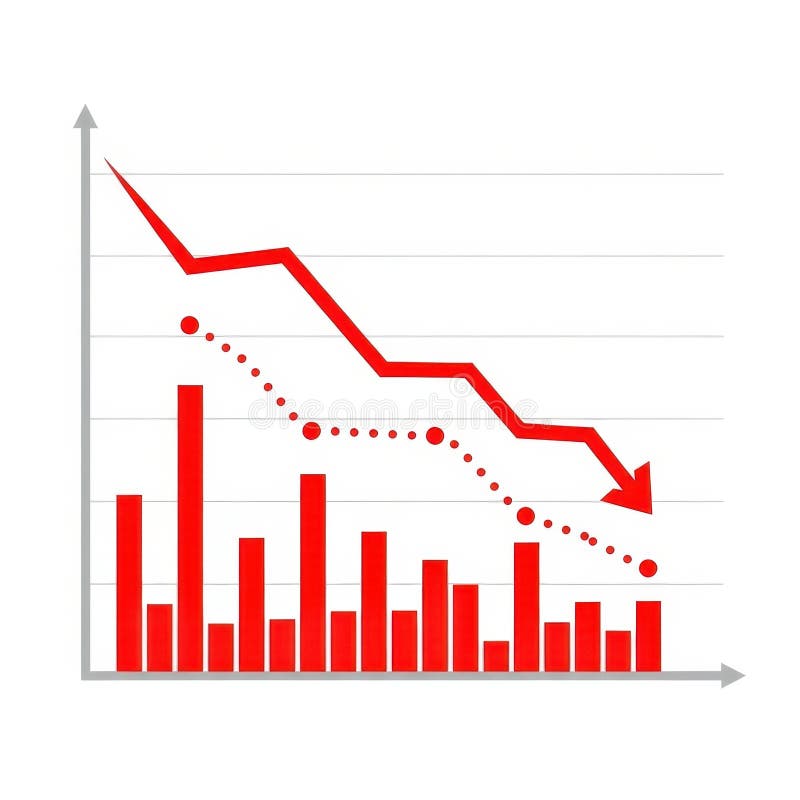
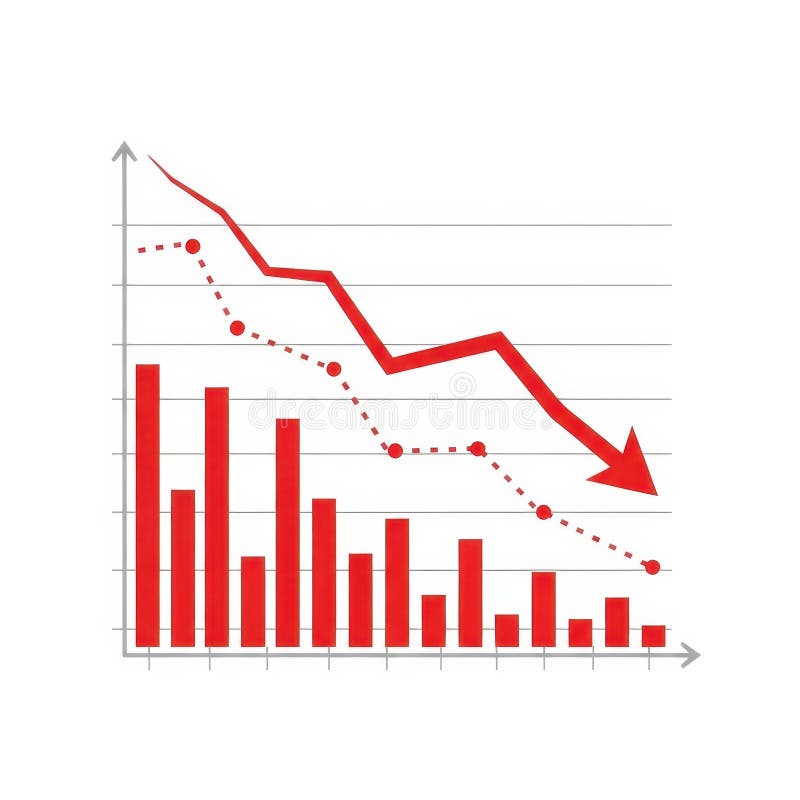
Free with trial A visual representation of negative financial performance. It features red bars and a red line graph showing a downward trend, accompanied by a dotted line indicating a similar pattern. Bar chart decrease illustrations Red downward trending graph with bars and dotted line. A visual representation of negative financial performance. It features red bars and a red line graph showing a downward trend, accompanied by a dotted line indicating a similar pattern
Free with trial Financial arrows up and down. Financial growth and decline. Graph with green and red arrows. Finance diagram, graphic charts icon set. Bar chart decrease vectors Financial arrows up and down. Financial growth and decline. Graph with green and red arrows. Finance diagram, graphic charts icon
Free with trial This vector illustration shows a set of black graph icons with rising and falling charts indicated by arrows showing trends in data with clear simple design and sharp edges calm. Generative AI. Bar chart decrease vectors Black graph icons set rising and falling charts with arrows vector illustration simple design. This vector illustration shows a set of black graph icons with rising and falling charts indicated by arrows showing trends in data with clear simple design and sharp edges calm. Generative AI
Free with trial Green up and red down 3d arrow graph showing rising, descending trend, business result, profit or loss symbol symbol. Business arrow, goals concept. 3d world money symbols. Financial growth. Bar chart decrease illustrations Green up and red down 3d arrow graph showing rising, descending trend, business result, 3d world money symbols. Financial growth. Green up and red down 3d arrow graph showing rising, descending trend, business result, profit or loss symbol symbol. Business arrow, goals concept. 3d world money symbols. Financial growth
Free with trial Green up and red down 3d arrow graph showing rising, descending trend, business result, profit or loss symbol symbol. Business arrow, goals concept. 3d world money symbols. Financial growth. Bar chart decrease illustrations Green up and red down 3d arrow graph showing rising, descending trend, business result, 3d world money symbols. Financial growth. Green up and red down 3d arrow graph showing rising, descending trend, business result, profit or loss symbol symbol. Business arrow, goals concept. 3d world money symbols. Financial growth
Free with trial Green up and red down 3d arrow graph showing rising, descending trend, business result, profit or loss symbol symbol. Business arrow, goals concept. 3d world money symbols. Financial growth. Bar chart decrease illustrations Green up and red down 3d arrow graph showing rising, descending trend, business result, 3d world money symbols. Financial growth. Green up and red down 3d arrow graph showing rising, descending trend, business result, profit or loss symbol symbol. Business arrow, goals concept. 3d world money symbols. Financial growth
Free with trial Green up and red down 3d arrow graph showing rising, descending trend, business result, profit or loss symbol symbol. Business arrow, goals concept. 3d world money symbols. Financial growth. Bar chart decrease illustrations Green up and red down 3d arrow graph showing rising, descending trend, business result, 3d world money symbols. Financial growth. Green up and red down 3d arrow graph showing rising, descending trend, business result, profit or loss symbol symbol. Business arrow, goals concept. 3d world money symbols. Financial growth
Free with trial Green up and red down 3d arrow graph showing rising, descending trend, business result, profit or loss symbol symbol. Business arrow, goals concept. 3d world money symbols. Financial growth. Bar chart decrease illustrations Green up and red down 3d arrow graph showing rising, descending trend, business result, 3d world money symbols. Financial growth. Green up and red down 3d arrow graph showing rising, descending trend, business result, profit or loss symbol symbol. Business arrow, goals concept. 3d world money symbols. Financial growth
Free with trial Green up and red down 3d arrow graph showing rising, descending trend, business result, profit or loss symbol symbol. Business arrow, goals concept. 3d world money symbols. Financial growth. Bar chart decrease illustrations Green up and red down 3d arrow graph showing rising, descending trend, business result, 3d world money symbols. Financial growth. Green up and red down 3d arrow graph showing rising, descending trend, business result, profit or loss symbol symbol. Business arrow, goals concept. 3d world money symbols. Financial growth
Free with trial The background features blurred lights, creating a dramatic effect. financial markets. Bar chart decrease illustrations A red downward arrow symbolizes a decline in financial markets. The background features blurred lights, creating a dramatic effect. financial markets
Free with trial A black shopping basket icon displays various financial charts and graphs in blue and green, indicating business analytics. Bar chart decrease illustrations Shopping basket icon with financial charts and graphs on white background cart retail. A black shopping basket icon displays various financial charts and graphs in blue and green, indicating business analytics
Free with trial A visual representation of negative financial performance, illustrating a significant downward trend with a red arrow pointing downwards, indicating a loss or decline in value. Bar chart decrease illustrations Red graph showing a downward trend isolated on white background. A visual representation of negative financial performance, illustrating a significant downward trend with a red arrow pointing downwards, indicating a loss or decline in value
Free with trial A medium shot shows a person's hands cupped together, palms up. Hovering above the hands are two glowing neon outlines of arrows, one pointing down and the other pointing up. Both arrows contain a percentage symbol. A blurred background features faint digital data and bar graphs, suggesting a financial or economic context. The overall mood is abstract and conceptual. Bar chart decrease illustrations Hands holding glowing up and down percentage arrows. A medium shot shows a person's hands cupped together, palms up. Hovering above the hands are two glowing neon outlines of arrows, one pointing down and the other pointing up. Both arrows contain a percentage symbol. A blurred background features faint digital data and bar graphs, suggesting a financial or economic context. The overall mood is abstract and conceptual
Free with trial Financial crisis concept. Decreasing graph with falling columns. Vector illustration showing recession, bankruptcy, and economic decline. Bar chart decrease vectors Financial crisis concept. Decreasing graph with falling columns. Vector illustration showing recession, bankruptcy
Free with trial Businessman hand holding digital graph with cost reduction concept showing financial growth saving strategy economic efficiency and business success in modern finance. Bar chart decrease illustrations Businessman hand holding digital graph with cost reduction concept showing financial growth saving strategy economic efficiency
Free with trial This image features a bold 2. 29% percentage symbol in metallic blue on a black background, ideal for financial presentations and business reports. Bar chart decrease illustrations Metallic Blue Percentage Symbol 229 on Black Background for Financial and Business Concepts. This image features a bold 2.29% percentage symbol in metallic blue on a black background, ideal for financial presentations and business reports
Free with trial Economy growth arrow icons on white. Bar chart decrease illustrations Economy growth arrow icons
Free with trial Indicating negative trend red arrow slanting down on finance dashboard, with bars and data points. Financial, analytics, data visualization, technology, digital interface, dashboard, statistical. Bar chart decrease illustrations Indicating negative trend red arrow slanting down on finance dashboard, with bars and data points
Free with trial Loss Graph Neon Sign. Vector Illustration of Analytics Data Symbol. Bar chart decrease vectors Loss Graph Neon Sign
Free with trial Line graph with a green line and a red dot on top. The red dot is located at the top left corner of the graph. Bar chart decrease illustrations Graph with a green line and a red dot
Free with trial A close-up view of four ice formations, resembling pillars or bars, arranged in descending order of height on a dark, textured surface, evoking a sense of cold and decline. Bar chart decrease illustrations Four ice pillars of varying heights stand on a dark, textured surface. A close-up view of four ice formations, resembling pillars or bars, arranged in descending order of height on a dark, textured surface, evoking a sense of cold and decline
Free with trial A futuristic digital infographic showcasing business strategy and growth. The scene features glowing charts, bar graphs, circular progress indicators with percentages, and stacks of gold coins, symbolizing financial success. A prominent neon arrow curves upwards, indicating a positive trend and progress. The dark, high-tech background enhances the visual impact, making it ideal for presentations on finance, business, technology, and data analysis. Bar chart decrease illustrations Digital Growth Infographic with Financial Data and Upward Trend Arrow. A futuristic digital infographic showcasing business strategy and growth. The scene features glowing charts, bar graphs, circular progress indicators with percentages, and stacks of gold coins, symbolizing financial success. A prominent neon arrow curves upwards, indicating a positive trend and progress. The dark, high-tech background enhances the visual impact, making it ideal for presentations on finance, business, technology, and data analysis.
Free with trial This image showcases a collection of finance and government icons, generated by AI, perfect for use in presentations, reports, or websites related to business, economics, or politics. The stylized monochrome design provides a professional and consistent aesthetic. Bar chart decrease illustrations Finance and Government Icons
Free with trial Growth vector icon. Graph or diagram with arrow going up and down. Vector illustration. Bar chart decrease vectors Growth vector icon. Graph or diagram with arrow going up and down. Vector
Free with trial A graph with a reduction report. A dagram showing the recession and bankruptcy. Business and finance concept. Vector illustration. Bar chart decrease vectors Graph with a reduction report. A dagram showing the recession and bankruptcy. Business and finance concept. Vector illustration
Free with trial Business performance decline icon vector. Productivity drop and process efficiency loss symbol. Bar chart decrease vectors Business performance decline icon. Productivity drop and process efficiency loss symbol
Free with trial Hand-drawn financial charts, graphs, and calculators perfect for business, finance, and accounting illustrations. These vector illustrations depict various tools used for data analysis and financial calculations. Bar chart decrease vectors Collection of Hand Drawn Financial Charts and Calculators. Hand-drawn financial charts, graphs, and calculators perfect for business, finance, and accounting illustrations. These vector illustrations depict various tools used for data analysis and financial calculations.
Free with trial Digital illustration depicting a financial decline with red downward-trending graphs, coin stacks, and scattered currency symbols. Set against a dark grid background with neon highlights, this image conveys themes of market loss, economic recession, and financial analysis�ideal for business, editorial, and presentation use. Bar chart decrease illustrations Economic Downturn Illustration Red Decline Graph with Coin Stacks on Digital Grid. Digital illustration depicting a financial decline with red downward-trending graphs, coin stacks, and scattered currency symbols. Set against a dark grid background with neon highlights, this image conveys themes of market loss, economic recession, and financial analysis�ideal for business, editorial, and presentation use.
Free with trial Collection of various red infographic elements including charts, graphs, diagrams, and symbols, perfect for presentations and data visualization. Ideal for showcasing data trends, progress, and comparisons. Easily customizable and adaptable to diverse projects. Bar chart decrease illustrations Red Infographic Elements
Free with trial A 3D rendered image depicts a teal bar graph with a sharply downward trending red arrow. Gold coins with dollar signs are scattered around the graph, some appearing to fall. A large gold dollar sign rests near the base of the graph. The background is a blurred cityscape at night. The overall mood is one of financial downturn or crisis. The style is realistic 3D rendering with a focus on metallic. Bar chart decrease illustrations 3 D Render Falling Stock Market Graph Teal Red Gold Coins. A 3D rendered image depicts a teal bar graph with a sharply downward trending red arrow. Gold coins with dollar signs are scattered around the graph, some appearing to fall. A large gold dollar sign rests near the base of the graph. The background is a blurred cityscape at night. The overall mood is one of financial downturn or crisis. The style is realistic 3D rendering with a focus on metallic
Free with trial A collection of black and white icons representing financial concepts such as growth charts, decline arrows, and money symbols, all presented clearly on a plain white background for easy integration i. Bar chart decrease vectors Financial growth and decline icons isolated on transparent background. A collection of black and white icons representing financial concepts such as growth charts, decline arrows, and money symbols, all presented clearly on a plain white background for easy integration i
Free with trial Colorful Charts on a Calculator Keyboard. Bar chart decrease illustrations Colorful Charts on a Calculator Keyboard
Free with trial 3D financial graph, red zigzag, gold coin stacks, blue grid, minimalist. Bar chart decrease illustrations 3D financial graph, red zigzag, gold coin stacks, blue grid, minimalist
Free with trial Business data is visually represented in black and white through various charts and graphs illustrating growth analysis and strategic planning for financial reporting showing a clear picture of market. Bar chart decrease vectors Black and white business data visualization with charts and graphs showing growth and analysis for financial reporting and. Business data is visually represented in black and white through various charts and graphs illustrating growth analysis and strategic planning for financial reporting showing a clear picture of market
Free with trial Tax blocks with percentage symbol and up and down arrows on financial charts, concept of tax rate changes and fiscal policy featuring taxes, taxation, percent with VAT and government elements for. Bar chart decrease illustrations Tax blocks with percentage symbol and up and down arrows on financial charts
Free with trial 3 Candles vector Stock Market Trading concept colored icon or logo element. Bar chart decrease vectors 3 Candles vector Stock Market Trading colored icon or logo element
Free with trial Business decline icon vector with downward arrow. Loss, failure, or economic crisis symbol with long shadow. Bar chart decrease vectors Business decline icon with downward arrow. Loss, failure, or economic crisis symbol with long shadow
Free with trial Growth vector icon. Graph or diagram with arrow going up and down. Vector illustration. Bar chart decrease vectors Growth vector icon. Graph or diagram with arrow going up and down. Vector
Free with trial Graph showing a line that is green and has a black background. The line is going up and to the right. Bar chart decrease illustrations Graph showing a line that is green and has a black background
Free with trial Graph with a green arrow pointing upwards. The graph is labeled with numbers and the numbers are increasing. Bar chart decrease illustrations Graph with a green arrow pointing upwards
Free with trial Decreasing Coin Stacks with Red Arrow Showcasing Financial Loss or Negative Trend Illustration. Bar chart decrease illustrations Decreasing Coin Stacks with Red Arrow Showcasing Financial Loss or Negative Trend Illustration
Free with trial This graphic illustration depicts the concepts of stress, calmness, energy level, and mental load. The image features four distinct sections, each representing one of these aspects. The stress section is represented by a gauge with a needle pointing to a high level, indicating a sense of anxiety or overwhelm. The calmness section features a wavy line, symbolizing a peaceful and serene state. The energy level section is illustrated with a bar graph, showing a decrease in energy. The mental load section is represented by a gauge with a needle pointing to a high level, indicating a heavy mental burden. This illustration can be used to represent the importance of maintaining a balance between stress and calmness, and the impact it has on our mental health and well-being. Bar chart decrease vectors Mental health A graphic illustration of stress, calmness, energy level, and mental load. This graphic illustration depicts the concepts of stress, calmness, energy level, and mental load. The image features four distinct sections, each representing one of these aspects. The stress section is represented by a gauge with a needle pointing to a high level, indicating a sense of anxiety or overwhelm. The calmness section features a wavy line, symbolizing a peaceful and serene state. The energy level section is illustrated with a bar graph, showing a decrease in energy. The mental load section is represented by a gauge with a needle pointing to a high level, indicating a heavy mental burden. This illustration can be used to represent the importance of maintaining a balance between stress and calmness, and the impact it has on our mental health and well-being.
Free with trial Neon graph shows falling trend with pink arrow pointing down. Blue bars indicate decline on, dark textured background. Modern abstract finance concept. Bar chart decrease illustrations Neon graph shows falling trend with pink arrow pointing down. Blue bars indicate decline on dark textured background. Modern. Neon graph shows falling trend with pink arrow pointing down. Blue bars indicate decline on, dark textured background. Modern abstract finance concept.
Free with trial A seamless pattern featuring various business and finance-related doodles, including graphs, charts, currencies, and other financial symbols. The doodles are drawn in a simple line style on a white background. This image can be used as a background or texture for presentations, reports, or websites related to business, finance, and economics. Bar chart decrease vectors Business finance doodle pattern. A seamless pattern featuring various business and finance-related doodles, including graphs, charts, currencies, and other financial symbols. The doodles are drawn in a simple line style on a white background. This image can be used as a background or texture for presentations, reports, or websites related to business, finance, and economics.
Free with trial Tablet computer, situated on a wooden surface, presents business charts and graphs. A small potted plant is in the foreground. Bar chart decrease illustrations A tablet computer displaying financial charts and graphs on a wooden surface. Tablet computer, situated on a wooden surface, presents business charts and graphs. A small potted plant is in the foreground
Free with trial This 3D rendering depicts stacks of gold coins rising alongside a financial graph, suggesting growth. The "Under Construction" title indicates a work in progress, possibly a project or investment. The image is generated by AI, showcasing the potential of digital art in visualizing financial concept. Bar chart decrease illustrations Financial Growth Under Construction. This 3D rendering depicts stacks of gold coins rising alongside a financial graph, suggesting growth. The "Under Construction" title indicates a work in progress, possibly a project or investment. The image is generated by AI, showcasing the potential of digital art in visualizing financial concept
Free with trial A comprehensive set of minimalist linear icons depicting financial analytics and business trends, featuring stacks of coins and both upward and downward trending bar charts. Bar chart decrease vectors Linear Business and Financial Growth Icon Set for Analytics, Investment, and Economic Trend Visualization. A comprehensive set of minimalist linear icons depicting financial analytics and business trends, featuring stacks of coins and both upward and downward trending bar charts.
Free with trial A man in a suit holds a phone and a stylus, interacting with a projected bar graph showing a downward trend in profits and an upward trend in costs. Bar chart decrease illustrations Businessman analyzes declining profits and rising costs using digital graph on a dark background. A man in a suit holds a phone and a stylus, interacting with a projected bar graph showing a downward trend in profits and an upward trend in costs
Free with trial Downward trend graph illustrating business decline and financial recession. Chalk drawing on a black chalkboard background features white bars and a prominent yellow downward arrow with ample copy space. Ideal for economic reports, marketing presentations, and educational content. Bar chart decrease illustrations Downward Trend Graph Showing Business Decline with Yellow Arrow on Chalkboard Background. Downward trend graph illustrating business decline and financial recession. Chalk drawing on a black chalkboard background features white bars and a prominent yellow downward arrow with ample copy space. Ideal for economic reports, marketing presentations, and educational content.
Free with trial Web report line icon. Continuous line with share plane. Column graph sign. Growth diagram symbol. 3d star in speech bubble. Web report single line ribbon. Loop curve pattern. Vector. Bar chart decrease vectors Web report line icon. Column graph sign. Continuous line with plane. Vector. Web report line icon. Continuous line with share plane. Column graph sign. Growth diagram symbol. 3d star in speech bubble. Web report single line ribbon. Loop curve pattern. Vector
Free with trial Chat arrow down vector icon set. black and white colors. EPS10. Bar chart decrease vectors Chat arrow down icon. Chat arrow down vector icon set. black and white colors. EPS10
Free with trial Five stacks of shiny gold coins are arranged in a descending order of height on a white background. Each coin is depicted with a ribbed edge and a smooth, reflective surface. The arrangement visually represents a financial trend, such as a decrease in value or a decline in savings. Bar chart decrease illustrations Stacks of Gold Coins Decreasing in Height on a White Background. Five stacks of shiny gold coins are arranged in a descending order of height on a white background. Each coin is depicted with a ribbed edge and a smooth, reflective surface. The arrangement visually represents a financial trend, such as a decrease in value or a decline in savings
Free with trial A photorealistic 3D render depicts a smartphone displaying a stock market trading analysis app. The screen shows a prominent red downward trending line graph overlaid on blue bar graphs. Surrounding the phone are 3D rendered dollar signs and bills, suggesting a financial context. The overall color scheme is dark with vibrant accents of red and blue in the graphs. The style is clean and modern,. Bar chart decrease illustrations 3 D Stock Trading Analysis App Smartphone Displaying Red Downward Trend Graph. A photorealistic 3D render depicts a smartphone displaying a stock market trading analysis app. The screen shows a prominent red downward trending line graph overlaid on blue bar graphs. Surrounding the phone are 3D rendered dollar signs and bills, suggesting a financial context. The overall color scheme is dark with vibrant accents of red and blue in the graphs. The style is clean and modern,
Free with trial Orange bars on white platform show sharp downward trend with arrow pointing down. Represents economic decline, business failure, financial crisis. Conceptual graphic for market. Bar chart decrease illustrations Orange bars on white platform show sharp downward trend with arrow pointing down. Represents economic decline, business failure
Free with trial Wooden blocks with percent signs sit on stacks of coins. A red graph trending downwards is in the, background indicating financial loss and economic recession. Bar chart decrease illustrations Wooden blocks with percent signs sit on stacks of coins. A red graph trending downwards is in the background indicating financial. Wooden blocks with percent signs sit on stacks of coins. A red graph trending downwards is in the, background indicating financial loss and economic recession.
Free with trial Two different graphs with a downward trend. One is red and the other is white. Bar chart decrease illustrations Two different graphs with a downward trend