Free with trial This abstract 3D composition features purple graphs symbolizing growth and decline, set against a soft purple backdrop, ideal for business concepts. Bar chart decrease illustrations Abstract 3D Purple Graphs Representing Growth and Decline on a Soft Purple Background. This abstract 3D composition features purple graphs symbolizing growth and decline, set against a soft purple backdrop, ideal for business concepts
Free with trial Infochart, Block diagram and Algorithm. Charts and graphs line icons. Presentation linear icon set Line icons set. Vector. Bar chart decrease illustrations Charts and graphs line icons. Infochart, Block diagram and Algorithm. Linear icon set. Line icons. Vector. Infochart, Block diagram and Algorithm. Charts and graphs line icons. Presentation linear icon set Line icons set. Vector
Free with trial Flipping of wooden blocks with arrow up and down. Business planning for target achievement. Measure of performance for a specific objective. 3d render. Bar chart decrease illustrations Flipping of wooden blocks with arrow up and down
Free with trial Laptop Displaying Decreasing Graph, Business Downturn Visualization, Economic Recession Concept. Bar chart decrease vectors Laptop Displaying Decreasing Graph, Business Downturn Visualization, Economic Recession Concept
Free with trial Growth vector icon. Graph or diagram with arrow going up and down. Vector illustration. Bar chart decrease vectors Growth vector icon. Graph or diagram with arrow going up and down. Vector
Free with trial A close-up shot of wooden rectangular blocks arranged in a descending staircase pattern against a solid red background. A bold, stylized red arrow overlays the blocks, pointing downwards to emphasize a negative trend, financial loss, or economic decline. The lighting is uniform, highlighting the texture of the wood and the symbolic nature of the composition, which is often used in business. Bar chart decrease illustrations A conceptual illustration of a downward market trend shown with wooden blocks and a red arrow. A close-up shot of wooden rectangular blocks arranged in a descending staircase pattern against a solid red background. A bold, stylized red arrow overlays the blocks, pointing downwards to emphasize a negative trend, financial loss, or economic decline. The lighting is uniform, highlighting the texture of the wood and the symbolic nature of the composition, which is often used in business
Free with trial Teal bars show a decreasing trend with a red arrow pointing downwards. Isolated on a transparent background. Bar chart decrease vectors Teal bar graph with red downward trending arrow isolated on a transparent background. Teal bars show a decreasing trend with a red arrow pointing downwards. Isolated on a transparent background
Free with trial Growth vector icon. Graph or diagram with arrow going up and down. Vector illustration. Bar chart decrease vectors Growth vector icon. Graph or diagram with arrow going up and down. Vector
Free with trial A flat-style graphic displaying falling stock values, shown by arrows and a graph on a monitor with dollar coins. Bar chart decrease vectors Stock market decline: Arrows showing a downward trend displayed on a screen with coins. A flat-style graphic displaying falling stock values, shown by arrows and a graph on a monitor with dollar coins.
Free with trial Growth vector icon. Graph or diagram with arrow going up and down. Vector illustration. Bar chart decrease vectors Growth vector icon. Graph or diagram with arrow going up and down. Vector
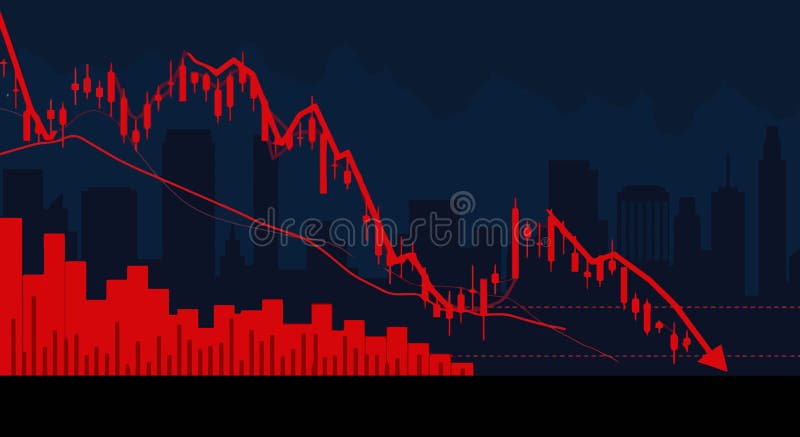
Free with trial This image depicts a clear downward trend in statistics, signifying loss or poor results and illustrating economic challenges. Bar chart decrease illustrations A dramatic decline in financial performance represented by a red arrow and decreasing bar graph. This image depicts a clear downward trend in statistics, signifying loss or poor results and illustrating economic challenges
Free with trial Economy growth graph down vector icon illustration. Bar chart decrease vectors Economy growth graph down icon design. economy growth graph down vector icon illustration
Free with trial The image presents a comprehensive display of weekly trends through multiple graphs and charts. It features line graphs, bar charts, and other visual representations of data, each highlighting different aspects of trends and statistics. The use of various colors, including green, red, and blue, against a dark background with white text enhances the visual appeal and facilitates easy comprehension. This image was generated using artificial intelligence. Bar chart decrease illustrations A collection of graphs and charts showcasing various weekly trends and statistics in a visually engaging format with multiple. The image presents a comprehensive display of weekly trends through multiple graphs and charts. It features line graphs, bar charts, and other visual representations of data, each highlighting different aspects of trends and statistics. The use of various colors, including green, red, and blue, against a dark background with white text enhances the visual appeal and facilitates easy comprehension. This image was generated using artificial intelligence.
Free with trial Arrow trend-down icon set in black and white filled and outlined stroke style. Bar chart decrease vectors Arrow trend-down icon
Free with trial Colorful data charts, graphs, and infographics on white background, illustrating business analytics, breathtaking wallpaper background Generative AI. Bar chart decrease illustrations Colorful data charts, graphs, and infographics on white background, illustrating business analytics
Free with trial Minimalistic red and white financial graph on downward trend for business design. Bar chart decrease illustrations Minimalistic red and white financial graph on downward trend for business design
Free with trial Four distinct graphs and charts illustrating various data trends and patterns, each with unique colors and styles. Bar chart decrease illustrations Collection of colorful graphs and charts displaying data trends isolated on transparent background. Four distinct graphs and charts illustrating various data trends and patterns, each with unique colors and styles
Free with trial Man in a beige brown shirt and jeans holding a paper with charts and business reports, isolated white background. AI-generated. Bar chart decrease illustrations Close up of hands holding a paper sheet with colorful business charts and graphs. Man in a beige brown shirt and jeans holding a paper with charts and business reports, isolated white background. AI-generated
Free with trial A businessman points to a digital interface displaying glowing neon icons and text related to vendor performance metrics and business growth. Bar chart decrease illustrations Businessman points to vendor performance metrics on screen. A businessman points to a digital interface displaying glowing neon icons and text related to vendor performance metrics and business growth
Free with trial This image depicts various financial concepts using graphical icons on mobile devices. It includes illustrations of rising and falling trends, balanced scales, growth, and investment themes, possibly representing market analysis, stock performance, investment growth, and financial balance. Bar chart decrease illustrations Financial trends and investment concepts illustrated with modern icons isolated on white background. This image depicts various financial concepts using graphical icons on mobile devices. It includes illustrations of rising and falling trends, balanced scales, growth, and investment themes, possibly representing market analysis, stock performance, investment growth, and financial balance
Free with trial Simple icon representing a bar graph losing value, with four black bars getting smaller. Bar chart decrease vectors Graph showing market crash with big arrow pointing down. Simple icon representing a bar graph losing value, with four black bars getting smaller
Free with trial The image displays a line graph with a blue line that increases over time, with a shaded area underneath it, the graph has a white background with a light blue gradient and features various small icons related to business and finance such as bar graphs, pie charts, and dollar signs, the icons are light blue and scattered around the graph, the overall design is simple and clean, making it easy to. This image was generated using artificial intelligence. Bar chart decrease illustrations A line graph showing revenue growth over time with various icons surrounding it to represent different aspects of business and. the image displays a line graph with a blue line that increases over time, with a shaded area underneath it, the graph has a white background with a light blue gradient and features various small icons related to business and finance such as bar graphs, pie charts, and dollar signs, the icons are light blue and scattered around the graph, the overall design is simple and clean, making it easy to. This image was generated using artificial intelligence.
Free with trial Abstract neon light bars on dark background ,Generative AI. Bar chart decrease illustrations Abstract neon light bars on dark background
Free with trial Close-up view of computer screen with colorful graphs, charts, representing financial, economic data visualization. Stock market analysis, business statistics investment data displayed. Bar chart decrease illustrations Close-up view of computer screen with colorful graphs, charts, representing financial, economic data visualization. Stock market
Free with trial Crypto Triangle Pattern vector Red and Green Candlesticks concept colored icon or design element. Bar chart decrease illustrations Crypto Triangle Pattern vector Red and Green Candlesticks colored icon or design element
Free with trial A collection of silver bars arranged in perspective with a green line graph superimposed over them, suggesting a rising trend. The bars are reflective and metallic, representing financial concepts related to silver investments. The image conveys notions of value appreciation and economic analysis. Bar chart decrease illustrations Silver bars with a green line graph. a rising trend in the price or value of silver. financial concepts design element. A collection of silver bars arranged in perspective with a green line graph superimposed over them, suggesting a rising trend. The bars are reflective and metallic, representing financial concepts related to silver investments. The image conveys notions of value appreciation and economic analysis.
Free with trial Finances statistics descending bars graphic outline icon in white and black colors. finances statistics descending bars graphic flat vector icon from business collection for web, mobile apps and ui. Bar chart decrease vectors Finances statistics descending bars graphic outline icon in white and black colors. finances statistics descending bars graphic
Free with trial Four distinct 3D graphs illustrating different data trends and representations, featuring upward and downward movements. Bar chart decrease illustrations Collection of 3d graphs showing various trends and data representations isolated on transparent background. Four distinct 3D graphs illustrating different data trends and representations, featuring upward and downward movements
Free with trial A visual representation of a downward trend in finance or business. The graphic features a series of descending blue bars accompanied by a sharp red arrow signifying a decline. Bar chart decrease illustrations Financial decline graph with red arrow indicating downtrend and decreasing bars isolated on white background. A visual representation of a downward trend in finance or business. The graphic features a series of descending blue bars accompanied by a sharp red arrow signifying a decline
Free with trial Decreasing stocks bars graphic outline icon in white and black colors. decreasing stocks bars graphic flat vector icon from business collection for web, mobile apps and ui. Bar chart decrease vectors Decreasing stocks bars graphic outline icon in white and black colors. decreasing stocks bars graphic flat vector icon from
Free with trial Decreasing graph icon with shadow. Bankrupt, market crash illustration concept. Bar chart decrease vectors Decreasing graph icon with shadow. Bankrupt, market crash concept. Decreasing graph icon with shadow. Bankrupt, market crash illustration concept
Free with trial High and Low Percent arrow icon vector logo set collection for web app ui. Bar chart decrease vectors High and Low Percent arrow icon vector set collection for web. High and Low Percent arrow icon vector logo set collection for web app ui
Free with trial Stock Market Down icon vector image. Suitable for mobile application web application and print media. Bar chart decrease vectors Stock Market Down icon vector image.
Free with trial This image represents financial loss with a graph showing a downward trend, symbolizing economic decline. A hand supports the graph, highlighting investment risks. Bar chart decrease vectors Vector art of financial loss concept a hand supports a graph showing a downward trend, indicating economic decline and potential. This image represents financial loss with a graph showing a downward trend, symbolizing economic decline. A hand supports the graph, highlighting investment risks
Free with trial Decline Visualization Dark Blue Background, Vibrant Pink Zigzags, and Yellow Bars Shown as Decreasing ThreeDimensional Cubes with Arrows Indicating the Trend by SD. Bar chart decrease illustrations Decline Visualization Dark Blue Background, Vibrant Pink Zigzags, and Yellow Bars Shown as Decreasing ThreeDimensional Cubes with
Free with trial A conceptual illustration showing stacks of gold coins arranged in a descending graph pattern with a large red arrow pointing downwards, symbolizing economic loss, financial crisis, market decline, and reduced business revenue. Bar chart decrease vectors A red arrow pointing down over stacks of gold coins representing falling profits and decreasing financial business growth isolated. A conceptual illustration. A conceptual illustration showing stacks of gold coins arranged in a descending graph pattern with a large red arrow pointing downwards, symbolizing economic loss, financial crisis, market decline, and reduced business revenue
Free with trial Arrow trend-down icon vector set on white background. EPS 10. Bar chart decrease vectors Arrow trend-down icon isolated on white background. Arrow trend-down icon vector set on white background. EPS 10
Free with trial Arrow trend-down icon vector set on white background. EPS 10. Bar chart decrease vectors Arrow trend-down icon isolated on white background. Arrow trend-down icon vector set on white background. EPS 10
Free with trial Arrow trend-down icon vector set on white background. EPS 10. Bar chart decrease vectors Arrow trend-down icon isolated on white background. Arrow trend-down icon vector set on white background. EPS 10
Free with trial Data analytics descending line graphic outline icon in white and black colors. data analytics descending line graphic flat vector icon from business collection for web, mobile apps and ui. Bar chart decrease vectors Data analytics descending line graphic outline icon in white and black colors. data analytics descending line graphic flat vector
Free with trial Reduce energy usage, in line design, green. Reduce, energy, usage, conservation, efficiency, sustainable, power on white background vector. Reduce energy usage editable stroke icon. Bar chart decrease vectors Reduce energy usage, in line design, green. Reduce, energy, usage, conservation, efficiency, sustainable, power on white
Free with trial No decline icon. Prohibition symbol with graph. Red and black warning. Financial growth concept. EPS 10. Bar chart decrease vectors No decline icon. Prohibition symbol with graph. Red and black warning. Financial growth concept.
Free with trial Arrow trend-down icon vector set on white background. EPS 10. Bar chart decrease vectors Arrow trend-down icon isolated on white background. Arrow trend-down icon vector set on white background. EPS 10
Free with trial Reduce energy usage, in line design. Reduce, energy, usage, conservation, efficiency, sustainable, power on white background vector. Reduce energy usage editable stroke icon. Bar chart decrease vectors Reduce energy usage, in line design. Reduce, energy, usage, conservation, efficiency, sustainable, power on white
Free with trial 3D rendered graph showing decreasing stock prices against a circuit board background. Illustrates market downturn in technology sector. Bar chart decrease illustrations Market Trend Analysis: 3D Render of Decreasing Stock Prices and Circuit Board Background Illustrating Technological Market. 3D rendered graph showing decreasing stock prices against a circuit board background. Illustrates market downturn in technology sector
Free with trial 3D render icon Line graph tracking energy consumption with a playful narrative icon 3d analysis. Generative AI. Bar chart decrease illustrations 3D render icon Line graph tracking energy consumption with a playful narrative icon 3d analysis
Free with trial Stock market or forex trading candlestick graph in graphic design for financial investment concept. Motion. Financial data and diagrams showing increase and decrease in profits. Bar chart decrease illustrations Stock market or forex trading candlestick graph in graphic design for financial investment concept. Motion. Financial
Free with trial This image depicts a global economic downturn using a visual representation. A large, white downward-pointing arrow dominates the scene, positioned over a grayscale world map. The map is overlaid on a dark red background, which further emphasizes the negative trend. Red bar graphs, scattered across the map, visually represent the economic decline in different regions, highlighting the severity of the situation. Numerical data points on the graph add to the visual impact and sense of decline. The overall effect creates a powerful and alarming visual metaphor for a worldwide economic crisis or recession. Bar chart decrease illustrations Global Economic Downturn Illustrated with World Map and Charts. This image depicts a global economic downturn using a visual representation. A large, white downward-pointing arrow dominates the scene, positioned over a grayscale world map. The map is overlaid on a dark red background, which further emphasizes the negative trend. Red bar graphs, scattered across the map, visually represent the economic decline in different regions, highlighting the severity of the situation. Numerical data points on the graph add to the visual impact and sense of decline. The overall effect creates a powerful and alarming visual metaphor for a worldwide economic crisis or recession.
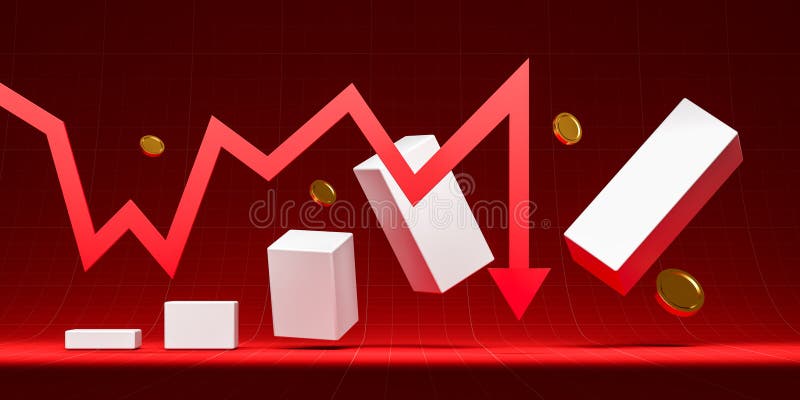
Free with trial Red downward trend graph with white falling blocks and coins on a dark red background. Concept of financial loss. 3D Rendering. Bar chart decrease illustrations Red downward trend graph with falling blocks and coins. 3D Rendering. Red downward trend graph with white falling blocks and coins on a dark red background. Concept of financial loss. 3D Rendering
Free with trial Three Candles vector Stock Market Trading concept icon or symbol. Bar chart decrease vectors Three Candles vector Stock Market Trading icon or symbol
Free with trial Stacked gold coins next to a red downward arrow on a gray grid background, representing financial decline. 3D Rendering. Bar chart decrease illustrations Stack of coins with red downward arrow on grid background. 3D Rendering. Stacked gold coins next to a red downward arrow on a gray grid background, representing financial decline. 3D Rendering
Free with trial High-Quality Vector Icons Collection with Editable Stroke. Ideal for Professional and Creative Projects. Bar chart decrease vectors Influencer icons . High-Quality Vector Icons Collection with Editable Stroke. Ideal for Professional and Creative. High-Quality Vector Icons Collection with Editable Stroke. Ideal for Professional and Creative Projects.
Free with trial This image shows a declining stock market graph with red candlesticks and bars. Vector illustration design using ai tool. Bar chart decrease vectors Stock market crash recession. This image shows a declining stock market graph with red candlesticks and bars. Vector illustration design using ai tool.
Free with trial A person analyzing stock market charts with a pointer. Vector art design using ai tool. Bar chart decrease vectors Stock Market Illustration Charts. A person analyzing stock market charts with a pointer. Vector art design using ai tool.
Free with trial High-Quality Vector Icons. Bar chart decrease vectors Rise icon vector, filled. High-Quality Vector Icons
Free with trial Graph Down glyph vector icon isolated. Graph Down stock vector icon for web, mobile app and ui design. Bar chart decrease vectors Graph Down glyph vector icon
Free with trial A collection of hand-drawn, black and white icons representing growth, decline, and financial concepts. The set includes upward and downward arrows, percentage symbols, and a bar graph illustrating trends. The simple line art style makes these icons versatile for various applications, including presentations, infographics, and website design. They convey concepts of progress, success, loss, and market fluctuations. Bar chart decrease illustrations Growth and Decline Icons Set. A collection of hand-drawn, black and white icons representing growth, decline, and financial concepts. The set includes upward and downward arrows, percentage symbols, and a bar graph illustrating trends. The simple line art style makes these icons versatile for various applications, including presentations, infographics, and website design. They convey concepts of progress, success, loss, and market fluctuations.
Free with trial Flipping of wooden blocks with arrow up and down. Business planning for target achievement. Measure of performance for a specific objective. 3d render. Bar chart decrease illustrations Flipping of wooden blocks with arrow up and down
Free with trial A conceptual illustration depicting the effects of inflation on long-term investments. The image features golden coins, stacked and scattered, alongside a rising arrow graph, and bar charts, all symbolizing financial growth and the challenges posed by inflation. The overall design conveys the concept of the impact of inflation on investment strategies and financial planning. Suitable for articles, presentations, and educational materials related to economics and finance. Bar chart decrease illustrations Inflation\'s Impact on Long-Term Investments. A conceptual illustration depicting the effects of inflation on long-term investments. The image features golden coins, stacked and scattered, alongside a rising arrow graph, and bar charts, all symbolizing financial growth and the challenges posed by inflation. The overall design conveys the concept of the impact of inflation on investment strategies and financial planning. Suitable for articles, presentations, and educational materials related to economics and finance.
Free with trial Bars down icon Thin outline art symbol vector logo thin line. Bar chart decrease vectors Bars down icon Thin outline art symbol
Free with trial Create a set of 16 vector icons related to finance and business. The style should be simple line art with a minimalist approach. Use a color palette of red and off-white/beige. The icons should include: shopping cart with upward arrow, various bar graphs (increasing and decreasing), piggy bank with coin, upward trending arrows, coins stack with upward arrow, dollar sign with gear, dollar sign in gear, calculator, bank building (classical style), torn dollar bill, credit card, cash money, and currency exchange (dollar and euro). Ensure clean lines and consistent spacing between icons. Bar chart decrease vectors Finance Icons: Vector Line Art Set. Create a set of 16 vector icons related to finance and business. The style should be simple line art with a minimalist approach. Use a color palette of red and off-white/beige. The icons should include: shopping cart with upward arrow, various bar graphs (increasing and decreasing), piggy bank with coin, upward trending arrows, coins stack with upward arrow, dollar sign with gear, dollar sign in gear, calculator, bank building (classical style), torn dollar bill, credit card, cash money, and currency exchange (dollar and euro). Ensure clean lines and consistent spacing between icons.
Free with trial Wooden blocks with arrow up and down with percentage icon. Business planning for target achievement. Measure of performance for a specific objective. 3d render. Bar chart decrease illustrations Wooden blocks with arrow up and down with percentage icon
Free with trial This image showcases a downward trending graph, generated by AI, represented by a red arrow descending within a transparent glass structure. The visual effectively communicates decline or negative growth. The clean, minimalist design enhances the impact of the falling trend. Bar chart decrease illustrations Decreasing Trend: AI-Generated Graph. This image showcases a downward trending graph, generated by AI, represented by a red arrow descending within a transparent glass structure. The visual effectively communicates decline or negative growth. The clean, minimalist design enhances the impact of the falling trend.
Free with trial The image shows a series of colorful wooden blocks arranged in ascending order of height, resembling a bar graph. the blocks are placed on a weathered wooden surface, adding a rustic and natural feel to the composition. the colors of the blocks range from orange to purple, creating a visually appealing gradient. the background is blurred, suggesting an outdoor setting with natural light filtering through. the focus is on the blocks, highlighting their texture and the interplay of colors. Bar chart decrease illustrations Colorful wooden blocks on rustic wood surface. the image shows a series of colorful wooden blocks arranged in ascending order of height, resembling a bar graph. the blocks are placed on a weathered wooden surface, adding a rustic and natural feel to the composition. the colors of the blocks range from orange to purple, creating a visually appealing gradient. the background is blurred, suggesting an outdoor setting with natural light filtering through. the focus is on the blocks, highlighting their texture and the interplay of colors.
Free with trial This image depicts a 3D rendering of a downward trending graph, generated by AI, showcasing a clear visual representation of market decline or economic downturn. The red bars and arrow emphasize the severity of the fall, suggesting potential financial instability or crisis. Bar chart decrease illustrations Declining Market Trends. This image depicts a 3D rendering of a downward trending graph, generated by AI, showcasing a clear visual representation of market decline or economic downturn. The red bars and arrow emphasize the severity of the fall, suggesting potential financial instability or crisis.
Free with trial Stock Market Down icon vector image. Suitable for mobile application web application and print media. Bar chart decrease vectors Stock Market Down icon vector image.
Free with trial A graph with a red arrow pointing upward. The graph is orange and blue. The graph is a representation of a trend or growth. Bar chart decrease vectors A graph with a red arrow pointing upward
Free with trial Collection of red infographic elements including charts, graphs, diagrams and icons. Perfect for presentations, reports, and data visualization. Clean, modern design. Bar chart decrease illustrations Red Infographic Elements
Free with trial Web report line icon. Neumorphic, Red gradient, 3d pin buttons. Column graph sign. Growth diagram symbol. Line icons. Neumorphic buttons with outline signs. Vector. Bar chart decrease illustrations Web report line icon. Column graph sign. Line icons. Vector. Web report line icon. Neumorphic, Red gradient, 3d pin buttons. Column graph sign. Growth diagram symbol. Line icons. Neumorphic buttons with outline signs. Vector
Free with trial Downward Trend Financial Graph Illustration. Bar chart decrease vectors Downward Trend Financial Graph Illustration
Free with trial 3D icon featuring a golden bear and a descending red arrow above blue bars, symbolizing a bearish trend in financial markets. Bar chart decrease vectors Bear Market Graph with Downward Trend 3D Icon. 3D icon featuring a golden bear and a descending red arrow above blue bars, symbolizing a bearish trend in financial markets
Free with trial Wooden blocks with arrow up and down on Balance scale of percentage icon. Business planning for target achievement. Measure of performance for a specific objective. 3d render. Bar chart decrease illustrations Wooden blocks with arrow up and down on Balance scale of percentage icon
Free with trial Statistic Up icon outline collection or set in black and white. Bar chart decrease vectors Statistic Up icon Line Art Logo set. Statistic Up icon outline collection or set in black and white
Free with trial Close-up of various financial charts and graphs displayed on a dark screen, with blue and orange color schemes. Image. Bar chart decrease illustrations Financial Data Charts and Graphs on Screen. Close-up of various financial charts and graphs displayed on a dark screen, with blue and orange color schemes. Image
Free with trial Report statistics line icon. Neumorphic, Green gradient, 3d pin buttons. Column graph sign. Growth diagram symbol. Line icons. Neumorphic buttons with outline signs. Vector. Bar chart decrease vectors Report statistics line icon. Column graph sign. Line icons. Vector. Report statistics line icon. Neumorphic, Green gradient, 3d pin buttons. Column graph sign. Growth diagram symbol. Line icons. Neumorphic buttons with outline signs. Vector
Free with trial Business data visualization with various charts white background. Bar chart decrease illustrations Business data visualization with various charts
Free with trial A turquoise moon hovers above a stock market graph with rising and falling arrows indicating market trends, useful for illustrating financial concepts. Bar chart decrease illustrations Stock Market Graph with Moon and Arrow Trends. A turquoise moon hovers above a stock market graph with rising and falling arrows indicating market trends, useful for illustrating financial concepts
Free with trial A modern 3D rendered abstract illustration featuring a prominent light blue downward-pointing arrow as its base. On top, a geometric structure is composed of a rectangular block, two stylized bar chart-like elements, and a central dark grey multifaceted polyhedron. Set against a clean white background, this graphic symbolizes concepts like data analysis, business trends, financial decline, foundational structures, or urban development. Its minimalist and digital aesthetic makes it suitable for technology, finance, and corporate presentations, infographics, and web design. Bar chart decrease vectors Abstract 3D Data Structure with Downward Arrow. A modern 3D rendered abstract illustration featuring a prominent light blue downward-pointing arrow as its base. On top, a geometric structure is composed of a rectangular block, two stylized bar chart-like elements, and a central dark grey multifaceted polyhedron. Set against a clean white background, this graphic symbolizes concepts like data analysis, business trends, financial decline, foundational structures, or urban development. Its minimalist and digital aesthetic makes it suitable for technology, finance, and corporate presentations, infographics, and web design.
Free with trial Digital graph showing significant drop in stock prices. Background includes various financial data and email icons, indicating a business or financial context. Bar chart decrease illustrations Digital graph showing significant drop in stock prices