Free with trial Business Down Icon - Percentage Rate Loss Icon sing symbol. Chart decrease icon vectors Business Down Icon - Percentage Rate Loss Icon
Free with trial Teal bar chart illustration for data visualization and statistical analysis. Chart decrease icon vectors Teal bar chart illustration for data visualization and statistical analysis
Free with trial Money movement icon. Dollar coin arrows. Financial flow Vector. Market trend symbol. EPS 10. Chart decrease icon vectors Money movement icon. Dollar coin arrows. Financial flow Vector. Market trend symbol.
Free with trial Doodle style bar and line graph icon representing growth and analytics. Chart decrease icon vectors Doodle style bar and line graph icon representing growth and analytics
Free with trial Marketing cost vector line icon. Business illustration is a symbol of marketing strategy and cost reduction. Thin finance and investment icon signifies growth and visual representation managing money. Chart decrease icon vectors Marketing cost vector line icon. Business illustration is a symbol of marketing strategy and cost reduction. Thin finance and
Free with trial High total cost icon vector image. Thin Outline Vector illustration isolated on background. Chart decrease icon vectors High total cost icon vector
Free with trial High total cost icon vector image. Thin Outline Vector illustration isolated on background. Chart decrease icon vectors High total cost icon vector
Free with trial High total cost icon vector image. Thin Outline Vector illustration isolated on background. Chart decrease icon vectors High total cost icon vector
Free with trial High total cost icon vector image. Thin Outline Vector illustration isolated on background. Chart decrease icon illustrations High total cost icon vector
Free with trial High total cost icon vector image. Thin Outline Vector illustration isolated on background. Chart decrease icon vectors High total cost icon vector
Free with trial This image showcases a collection of twenty distinct vector icons, each illustrating various representations of increase and decrease graphs. Chart decrease icon vectors Collection of Twenty Vector Icons Depicting Increase and Decrease Graphs. This image showcases a collection of twenty distinct vector icons, each illustrating various representations of increase and decrease graphs.
Free with trial Up and down direction arrow icon set on black circle. Upward and downward illustration concept. Chart decrease icon vectors Up and down direction arrow icon set on black circle. Upward and downward concept
Free with trial A collection of minimalist outline icons representing finance and business data charts, symbols, and indicators for graphic design and web development. Chart decrease icon vectors Minimalist Outline Finance and Business Data Chart Symbol Icon Set. A collection of minimalist outline icons representing finance and business data charts, symbols, and indicators for graphic design and web development.
Free with trial Large pie chart alongside heart and drooping plant with dashed line. Ideal for data analysis, loss, emotional impact, decline, sustainability, environmental issues, simple flat metaphor. Chart decrease icon vectors Pie Chart with Heart Symbol and Wilting Plant Representing Decline and Emotional Impact. Large pie chart alongside heart and drooping plant with dashed line. Ideal for data analysis, loss, emotional impact, decline, sustainability, environmental issues, simple flat metaphor
Free with trial This image features a striking red neon-style line graph on a black background, symbolizing decline, decrease, or downward trend in data visualization. Ideal for business, finance, and analytics concepts, it visually represents performance drops or negative growth in a modern, eye-catching manner. Chart decrease icon illustrations Red Neon Declining Graph Line Icon for Business Data Visualization. This image features a striking red neon-style line graph on a black background, symbolizing. This image features a striking red neon-style line graph on a black background, symbolizing decline, decrease, or downward trend in data visualization. Ideal for business, finance, and analytics concepts, it visually represents performance drops or negative growth in a modern, eye-catching manner.
Free with trial Graph line icons. Interest rate, AI generate, Inflation icons. Set of Chart presentation, Report, Increase growth graph icons. Analytics testing, Falling demand, Pie chart report. Vector. Chart decrease icon vectors Graph line icons. Set of Chart presentation, Report and Increase growth graph icons. App line icons. Vector. Graph line icons. Interest rate, AI generate, Inflation icons. Set of Chart presentation, Report, Increase growth graph icons. Analytics testing, Falling demand, Pie chart report. Vector
Free with trial Decreasing bar chart diagram with down arrow showing negative growth. Chart decrease icon vectors Decreasing bar chart diagram with down arrow showing negative growth
Free with trial Growth vector icon. Graph or diagram with arrow going up and down. Vector illustration. Chart decrease icon vectors Growth vector icon. Graph or diagram with arrow going up and down. Vector
Free with trial Energy Consumption Decline Chart. Visual representation of decreasing power utilization trends, indicating effective resource management and environmental efficiency. Chart decrease icon vectors (Energy Consumption Decline Chart. Visual representation of decreasing. Energy Consumption Decline Chart. Visual representation of decreasing power utilization trends, indicating effective resource management and environmental efficiency
Free with trial Bar graph and line chart showing performance decline, icons of person and movement, and a sad face symbol. Ideal for data trends, business analysis, failure, mood, feedback, decision-making. Chart decrease icon illustrations Declining Trends in Data Analysis with Emotional Impact Represented by Sad Face Icon. Bar graph and line chart showing performance decline, icons of person and movement, and a sad face symbol. Ideal for data trends, business analysis, failure, mood, feedback, decision-making
Free with trial A vibrant, 3D rendered bar chart displays ascending data, symbolizing progress and achievement. The pastel-colored bars are set against a clean white background, emphasizing their visual impact and providing a professional, modern feel. Perfect for presentations or business-related projects. Chart decrease icon illustrations Colorful 3D Bar Chart Showing Growth and Success on White Background. A vibrant, 3D rendered bar chart displays ascending data, symbolizing progress and achievement. The pastel-colored bars are set against a clean white background, emphasizing their visual impact and providing a professional, modern feel. Perfect for presentations or business-related projects.
Free with trial Growth vector icon. Graph or diagram with arrow going up and down. Vector illustration. Chart decrease icon vectors Growth vector icon. Graph or diagram with arrow going up and down. Vector
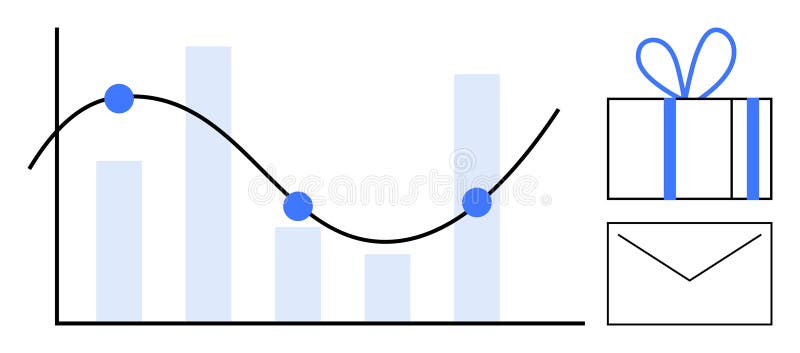
Free with trial Graph with decreasing bar chart and line graph noting key points beside a gift box and envelope. Ideal for business analysis, performance tracking, rewards programs, marketing, sales targets, client. Chart decrease icon vectors Bar Graph with Line Chart, Gift Box, and Envelope Representing Business Metrics and Rewards. Graph with decreasing bar chart and line graph noting key points beside a gift box and envelope. Ideal for business analysis, performance tracking, rewards programs, marketing, sales targets, client
Free with trial Down graphic of business stats outline icon in white and black colors. down graphic of business stats flat vector icon from business collection for web, mobile apps and ui. Chart decrease icon vectors Down graphic of business stats outline icon in white and black colors. down graphic of business stats flat vector icon from
Free with trial Up and down arrow line icon. Upward and downward sign symbol vector. Chart decrease icon vectors Up and down arrow line icon. Upward and downward sign symbol
Free with trial Graph going Up and Down sign with green and red arrows. graph increase, decrease sign design. Chart decrease icon vectors Graph going Up and Down sign with green and red arrows. graph increase, decrease sign
Free with trial Growth vector icon. Graph or diagram with arrow going up and down. Vector illustration. Chart decrease icon vectors Growth vector icon. Graph or diagram with arrow going up and down. Vector
Free with trial Growth vector icon. Graph or diagram with arrow going up and down. Vector illustration. Chart decrease icon vectors Growth vector icon. Graph or diagram with arrow going up and down. Vector
Free with trial Growth vector icon. Graph or diagram with arrow going up and down. Vector illustration. Chart decrease icon vectors Growth vector icon. Graph or diagram with arrow going up and down. Vector
Free with trial A 3D icon illustrating financial loss isolated on a white background, ideal for financial and business themes. Chart decrease icon illustrations 3D Financial Loss Icon isolated. A 3D icon illustrating financial loss isolated on a white background, ideal for financial and business themes
Free with trial Growth vector icon. Graph or diagram with arrow going up and down. Vector illustration. Chart decrease icon vectors Growth vector icon. Graph or diagram with arrow going up and down. Vector
Free with trial Growth vector icon. Graph or diagram with arrow going up and down. Vector illustration. Chart decrease icon vectors Growth vector icon. Graph or diagram with arrow going up and down. Vector
Free with trial Growth vector icon. Graph or diagram with arrow going up and down. Vector illustration. Chart decrease icon vectors Growth vector icon. Graph or diagram with arrow going up and down. Vector
Free with trial Growth vector icon. Graph or diagram with arrow going up and down. Vector illustration. Chart decrease icon vectors Growth vector icon. Graph or diagram with arrow going up and down. Vector
Free with trial Growth vector icon. Graph or diagram with arrow going up and down. Vector illustration. Chart decrease icon vectors Growth vector icon. Graph or diagram with arrow going up and down. Vector
Free with trial Business decline icon with downward arrow. Loss, failure, or economic crisis symbol vector in black circle. Chart decrease icon vectors Business decline icon with downward arrow. Loss, failure, or economic crisis symbol in black circle
Free with trial Financial arrow up and down icon on circle line. Growth and decline graph sign symbol illustration. Chart decrease icon vectors Financial arrow up and down icon on circle line. Growth and decline graph sign symbol
Free with trial Report statistics line icon. Neumorphic, Flat shadow, 3d buttons. Column graph sign. Growth diagram symbol. Line report statistics icon. Social media icons. Vector. Chart decrease icon illustrations Report statistics line icon. Column graph sign. Neumorphic buttons. Vector. Report statistics line icon. Neumorphic, Flat shadow, 3d buttons. Column graph sign. Growth diagram symbol. Line report statistics icon. Social media icons. Vector
Free with trial Report statistics line icon. Neumorphic, Flat shadow, 3d buttons. Column graph sign. Growth diagram symbol. Line report statistics icon. Social media icons. Vector. Chart decrease icon illustrations Report statistics line icon. Column graph sign. Neumorphic buttons. Vector. Report statistics line icon. Neumorphic, Flat shadow, 3d buttons. Column graph sign. Growth diagram symbol. Line report statistics icon. Social media icons. Vector
Free with trial Interest growth icon Black line art vector in black and white outline set collection sign. Chart decrease icon vectors Financial Icon Illustrating Growth, Investment Success, and Economic Prosperity. Interest growth icon Black line art vector in black and white outline set collection sign
Free with trial Simple up and down arrow line icon on black circle. Upward and downward sign symbol vector in rounded corner. Chart decrease icon vectors Simple up and down arrow line icon on black circle. Upward and downward sign symbol in rounded corner
Free with trial Financial arrows up and down icon in flat design. Growth and decline graph sign symbol illustration. Chart decrease icon vectors Financial arrows up and down icon in flat design. Growth and decline graph sign symbol
Free with trial Up and down arrow icon set on black circle. Upward and downward illustration. Chart decrease icon vectors Up and down arrow icon set on black circle
Free with trial Coin money decrease. Dollar currency downfall. Financial loss symbol. Vector economy emblem. EPS 10. Chart decrease icon vectors Coin money decrease. Dollar currency downfall. Financial loss symbol. Vector economy emblem.
Free with trial Downward arrow with SALE, bar chart displaying data trends, and dynamic stick figure. Ideal for business, marketing, analysis, economics, sales, growth statistics simple flat metaphor. Chart decrease icon illustrations Arrow pointing downward labeled SALE with bar chart and dynamic figure symbolizing action. Downward arrow with SALE, bar chart displaying data trends, and dynamic stick figure. Ideal for business, marketing, analysis, economics, sales, growth statistics simple flat metaphor
Free with trial Charts and Diagrams line icons. Interest rate, AI generate, Inflation icons. Report, 3D Chart, Block diagram and Dot Plot graph linear icons. Trend, Pyramid and Pie chart report symbols. Vector. Chart decrease icon vectors Charts and Diagrams line icons. Set of 3D Chart, Block diagram and Dot Plot graph icons. App line icons. Vector. Charts and Diagrams line icons. Interest rate, AI generate, Inflation icons. Report, 3D Chart, Block diagram and Dot Plot graph linear icons. Trend, Pyramid and Pie chart report symbols. Vector
Free with trial Profit increase and decrease graph, coin icon. Chart decrease icon vectors Profit increase and decrease graph
Free with trial Profit increase and decrease graph, coin icon. Chart decrease icon vectors Profit increase and decrease graph
Free with trial Profit increase and decrease graph, coin icon. Chart decrease icon vectors Profit increase and decrease graph
Free with trial Profit increase and decrease graph, coin icon. Chart decrease icon vectors Profit increase and decrease graph
Free with trial Profit increase and decrease graph, coin icon. Chart decrease icon vectors Profit increase and decrease graph
Free with trial Profit increase and decrease graph, coin icon. Chart decrease icon vectors Profit increase and decrease graph
Free with trial Percent growth and decline icon in rounded corner. Percentage arrow up and down sign symbol vector. Chart decrease icon vectors Percent growth and decline icon in rounded corner. Percentage arrow up and down sign symbol
Free with trial A 3D icon of a building and a downward arrow. Symbolizes real estate decline, property value loss, or a housing market crash. Ideal for financial infographics. Isolated. Chart decrease icon illustrations 3D Real Estate Decline Icon for Property Value Loss and Housing Market Crash. A 3D icon of a building and a downward arrow. Symbolizes real estate decline, property value loss, or a housing market crash. Ideal for financial infographics. Isolated
Free with trial Colorful isometric bar chart showing business data and growth with bars of different height, colored blue, yellow and green. Isolated on a transparent background, perfect for business presentations or infographics. Chart decrease icon vectors Colorful business chart illustration on transparent background AI Generated. Colorful isometric bar chart showing business data and growth with bars of different height, colored blue, yellow and green. Isolated on a transparent background, perfect for business presentations or infographics.
Free with trial A 3D rendered gold coin with a thick gold rim and a black circular face. On the black face, a gold bar chart is depicted, showing a downward trend with bars decreasing in height and an arrow pointing downwards. The coin is presented at an angle against a white background, symbolizing financial decline or economic loss. Chart decrease icon illustrations Gold coin with black background and gold bar chart showing decline money finance. A 3D rendered gold coin with a thick gold rim and a black circular face. On the black face, a gold bar chart is depicted, showing a downward trend with bars decreasing in height and an arrow pointing downwards. The coin is presented at an angle against a white background, symbolizing financial decline or economic loss
Free with trial This 3D render shows a calculator with a colorful bar chart made of cubes illustrating growth and success in business and finance. Perfect for presentations and infographics. Chart decrease icon illustrations Colorful 3D Calculator with Growing Bar Chart Cubes for Business and Finance. This 3D render shows a calculator with a colorful bar chart made of cubes illustrating growth and success in business and finance. Perfect for presentations and infographics.
Free with trial Revenue Decline line icon. Universal creative premium symbol. Vector sign icon logo template. Vector illustration. Chart decrease icon vectors Revenue Decline line icon. Universal creative premium symbol. Vector sign icon logo template. Vector illustration
Free with trial Business performance decline icon in black circle. Productivity drop and process efficiency loss symbol vector. Chart decrease icon vectors Business performance decline icon in black circle. Productivity drop and process efficiency loss symbol
Free with trial Decreasing Bar Chart with Falling Arrow Illustrates Economic Downturn, Recession. Chart decrease icon vectors Decreasing Bar Chart with Falling Arrow Illustrates Economic Downturn, Recession
Free with trial Coin with down arrow, money interest rate reduction gradient lineal icon. Finance, payment, invest finance symbol design. Isolated on white background. Chart decrease icon vectors Coin with down arrow, money interest rate reduction gradient lineal icon. Finance, payment, invest finance symbol design
Free with trial Set of Chart presentation, Report, Increase growth graph icons. Design shape elements. Graph line icons. Analytics testing, Falling demand, Pie chart report. Calendar statistics, Stats. Vector. Chart decrease icon vectors Graph line icons. Set of Chart presentation, Report and Increase growth graph icons. Design elements. Vector. Set of Chart presentation, Report, Increase growth graph icons. Design shape elements. Graph line icons. Analytics testing, Falling demand, Pie chart report. Calendar statistics, Stats. Vector
Free with trial Downward arrows icon. Decreasing trend symbol. Vector arrow group. Economic downturn. EPS 10. Chart decrease icon vectors Downward arrows icon. Decreasing trend symbol. Vector arrow group. Economic downturn.
Free with trial Top Position and Promotion Icon Line Style Design Simple Finance and Business Vector Symbol Perfect Illustration. Chart decrease icon vectors Top Position and Promotion Icon Line Style Design Simple Vector Perfect Illustration. Top Position and Promotion Icon Line Style Design Simple Finance and Business Vector Symbol Perfect Illustration
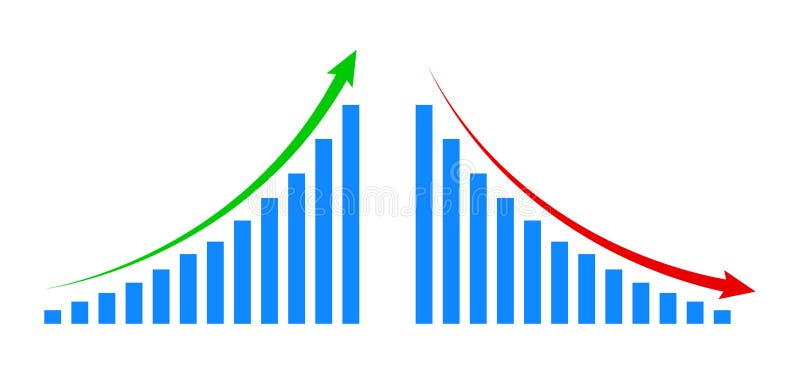
Free with trial Statistic graph progress, financial profit growth, increase and decrease line icons set. Infographic charts with arrow, circles and bars thin black and red outline symbols vector illustration. Chart decrease icon vectors Statistic graph progress, financial profit growth, increase and decrease line icons set
Free with trial Up and down arrow icon on black circle. Upward and downward sign symbol vector. Chart decrease icon vectors Up and down arrow icon on black circle. Upward and downward sign symbol
Free with trial A 3D rendered blue arrow points downwards, signifying a decrease or reduction. Attached to the top of the arrow is a bright pink circular icon containing a white percent sign. The entire graphic is isolated on a clean white background, making it suitable for use in presentations, websites, or marketing materials related to sales, discounts, or negative financial trends. Chart decrease icon illustrations 3D Blue Downward Arrow with Pink Circle and White Percent Sign Isolated on White image. A 3D rendered blue arrow points downwards, signifying a decrease or reduction. Attached to the top of the arrow is a bright pink circular icon containing a white percent sign. The entire graphic is isolated on a clean white background, making it suitable for use in presentations, websites, or marketing materials related to sales, discounts, or negative financial trends
Free with trial Decreasing graph icon vector illustration on circle line. Company bankruptcy report vector. Market crash concept. Chart decrease icon vectors Decreasing graph icon vector on circle line. Company bankruptcy report vector. Market crash concept
Free with trial Credit card decline financial chart with downward arrow. Economic and financial crisis symbol. Chart decrease icon vectors Credit card decline financial chart with downward arrow. Economic and financial crisis symbol
Free with trial Descending Bar Chart and Downward Arrow Signifying Business Loss and Economic Downturn. Chart decrease icon vectors Descending Bar Chart and Downward Arrow Signifying Business Loss and Economic Downturn
Free with trial Up and down arrow icon in rounded corner. Upward and downward sign symbol vector. Chart decrease icon vectors Up and down arrow icon in rounded corner. Upward and downward sign symbol
Free with trial Up and down arrow icon in rounded corner. Upward and downward sign symbol vector. Chart decrease icon vectors Up and down arrow icon in rounded corner. Upward and downward sign symbol
Free with trial Declining global economy icon with downward arrow, world map, and recession, line art icon set. Chart decrease icon vectors Declining global economy icon with downward arrow, world map, and recession, line art icon set
Free with trial This 3D rendering showcases a vibrant bar chart illustrating business growth and financial performance. The colorful cylinders represent data points, rising to show increasing success. A line graph adds additional information about trends over time. Chart decrease icon illustrations Colorful 3D Bar Chart with Growth Graph Showing Business Success and Financial Data. This 3D rendering showcases a vibrant bar chart illustrating business growth and financial performance. The colorful cylinders represent data points, rising to show increasing success. A line graph adds additional information about trends over time.
Free with trial Decreasing graph icon set collection. Arrow going down sign symbol vector illustration. Market crash concept. Chart decrease icon vectors Decreasing graph icon set collection. Arrow going down sign symbol vector. Market crash concept
Free with trial Report, 3D Chart, Block diagram and Dot Plot graph linear icons. Design shape elements. Charts and Diagrams line icons. Trend, Pyramid and Pie chart report symbols. Vector. Chart decrease icon vectors Charts and Diagrams line icons. Set of 3D Chart, Block diagram and Dot Plot graph icons. Design elements. Vector. Report, 3D Chart, Block diagram and Dot Plot graph linear icons. Design shape elements. Charts and Diagrams line icons. Trend, Pyramid and Pie chart report symbols. Vector
Free with trial A 3D illustration depicting financial concepts. A purple rectangular bar shows a sharp red downward trending arrow. Below it, another purple bar displays a candlestick chart with red and blue bars. To the right, a magnifying glass with an orange handle and turquoise lens hovers, suggesting analysis. A small, colorful pie chart with red, yellow, and blue segments is positioned to the left. The. Chart decrease icon illustrations 3D Financial Downward Trend Chart with Magnifying Glass and Pie Chart finance stock market. A 3D illustration depicting financial concepts. A purple rectangular bar shows a sharp red downward trending arrow. Below it, another purple bar displays a candlestick chart with red and blue bars. To the right, a magnifying glass with an orange handle and turquoise lens hovers, suggesting analysis. A small, colorful pie chart with red, yellow, and blue segments is positioned to the left. The
Free with trial Descending data analytics line graphic outline icon in white and black colors. descending data analytics line graphic flat vector icon from business collection for web, mobile apps and ui. Chart decrease icon vectors Descending data analytics line graphic outline icon in white and black colors. descending data analytics line graphic flat vector
Free with trial Decreasing graph icon set. Arrow going down sign symbol vector illustration. Market crash concept. Chart decrease icon vectors Decreasing graph icon set. Arrow going down sign symbol vector. Market crash concept
Free with trial Arrow trend-down icon vector set on white background. EPS 10. Chart decrease icon vectors Arrow trend-down icon isolated on white background. Arrow trend-down icon vector set on white background. EPS 10