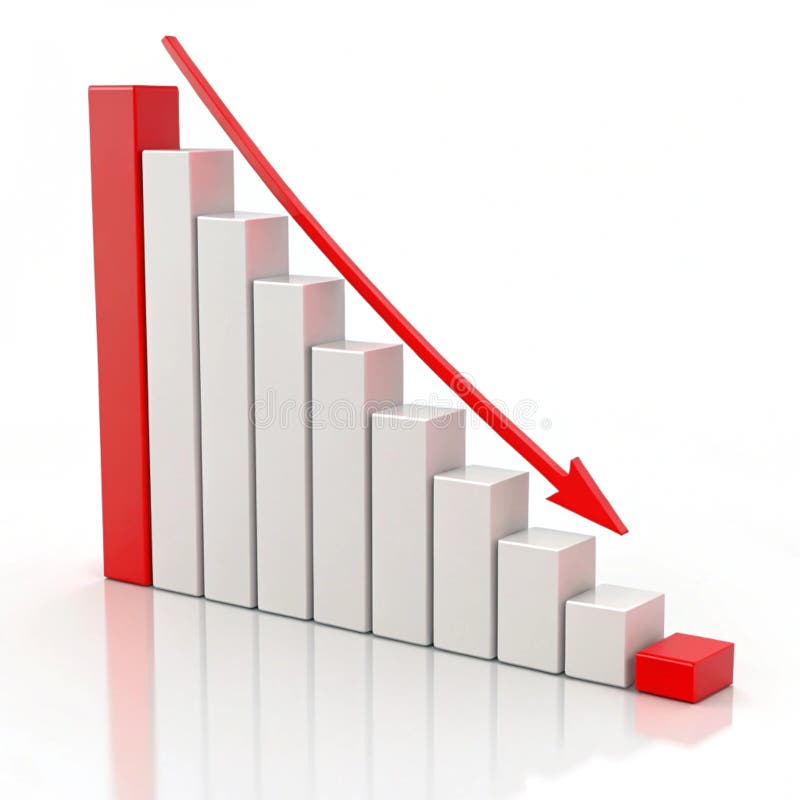
Free with trial A minimalist bar chart with a descending line graph overlay, symbolizing financial loss, performance decline, or negative data trends. Ideal for presentations, dashboards, economic reports, and warning visuals. Chart decrease icon vectors Downward Trend Bar Chart Icon. A minimalist bar chart with a descending line graph overlay, symbolizing financial loss, performance decline, or negative data trends. Ideal for presentations, dashboards, economic reports, and warning visuals
Free with trial Broken circle arrow chart is representing negative growth and failure to meet targets. Chart decrease icon illustrations Broken circle arrow chart showing negative growth data. Broken circle arrow chart is representing negative growth and failure to meet targets
Free with trial Stock Market Data Visualization vector Cryptocurrency Candlestick Chart concept seamless pattern. Chart decrease icon vectors Stock Market Data Visualization vector Cryptocurrency Candlestick Chart seamless pattern
Free with trial Set line Dollar rate decrease Glass money jar with coin Global economic crisis Broken piggy bank Calculation of expenses Hanging sign Sale and Drop crude oil price icon. Vector. Chart decrease icon vectors Set line Dollar rate decrease, Glass money jar with coin, Global economic crisis, Broken piggy bank, Calculation of. Set line Dollar rate decrease Glass money jar with coin Global economic crisis Broken piggy bank Calculation of expenses Hanging sign Sale and Drop crude oil price icon. Vector.
Free with trial Word ranking near decrease graph. 3d render. Chart decrease icon illustrations Word ranking near decrease graph
Free with trial Trend and Candlestick Chart vector Crypto Investment concept seamless pattern. Chart decrease icon vectors Trend and Candlestick Chart vector Crypto Investment seamless pattern
Free with trial Graph Down glyph vector icon isolated. Graph Down stock vector icon for web, mobile app and ui design. Chart decrease icon vectors Graph Down glyph vector icon
Free with trial A graphic illustration featuring two distinct charts on a white background. The upper chart displays three descending lines in black, red, and green, each ending with a downward-pointing arrow. Below this, a bar chart shows three black bars of increasing height, with arrows pointing upwards from the tallest bars. A stylized black graphic element resembling diverging paths or a funnel is positioned. Chart decrease icon vectors Downward and upward trending graphs with arrows chart. A graphic illustration featuring two distinct charts on a white background. The upper chart displays three descending lines in black, red, and green, each ending with a downward-pointing arrow. Below this, a bar chart shows three black bars of increasing height, with arrows pointing upwards from the tallest bars. A stylized black graphic element resembling diverging paths or a funnel is positioned
Free with trial Profit growth icon logo sign vector outline in black and white color. Chart decrease icon vectors Profit growth icon logo set vector. profit growth icon logo sign vector outline in black and white color
Free with trial Range or Levels Breakout vector Candlestick Chart concept colored seamless pattern. Chart decrease icon vectors Range or Levels Breakout vector Candlestick Chart colored seamless pattern
Free with trial Downward zigzag arrow icon vector with long shadow. Chart decrease icon vectors Downward zigzag arrow icon with long shadow
Free with trial Up-Down 3D Icon isolated on white background. Chart decrease icon illustrations Up-Down 3D Icon isolated on white background
Free with trial Loss money arrow bar graph icon on white background depicting financial decline. Chart decrease icon illustrations Loss money arrow bar graph icon
Free with trial A minimalist, flat design illustration of a bar chart featuring three vertical bars of varying heights. The bars are colored in orange, teal, and a lighter orange, set against a clean white background. This graphic represents data visualization, trends, and comparisons, suitable for business reports, educational materials, or web design elements. Chart decrease icon illustrations Simple Bar Chart with Three Bars. A minimalist, flat design illustration of a bar chart featuring three vertical bars of varying heights. The bars are colored in orange, teal, and a lighter orange, set against a clean white background. This graphic represents data visualization, trends, and comparisons, suitable for business reports, educational materials, or web design elements.
Free with trial A clean, minimalist 3D render of a blue bar chart with a blue trend line connecting circular data points. The bars vary in height, illustrating growth and fluctuations. The background is a bright, clean white, emphasizing the chart's elements. This graphic is ideal for representing financial data, business growth, market trends, statistics, and performance analysis in a modern and professional style. Chart decrease icon illustrations 3D Blue Bar Chart with Trend Line. A clean, minimalist 3D render of a blue bar chart with a blue trend line connecting circular data points. The bars vary in height, illustrating growth and fluctuations. The background is a bright, clean white, emphasizing the chart's elements. This graphic is ideal for representing financial data, business growth, market trends, statistics, and performance analysis in a modern and professional style.
Free with trial Bars down icon Thin outline art symbol vector logo thin line. Chart decrease icon vectors Bars down icon Thin outline art symbol
Free with trial A stylized illustration depicts a bar chart with blue bars of varying heights against a dark blue grid background. A prominent red and yellow arrow, symbolizing a downward trend, dramatically descends across the chart. This graphic represents financial decline, market crash, economic recession, or negative growth. Its clean, vector-style design makes it suitable for presentations, reports, and articles on business, finance, and economics. Chart decrease icon illustrations Declining Bar Chart with Red Arrow. A stylized illustration depicts a bar chart with blue bars of varying heights against a dark blue grid background. A prominent red and yellow arrow, symbolizing a downward trend, dramatically descends across the chart. This graphic represents financial decline, market crash, economic recession, or negative growth. Its clean, vector-style design makes it suitable for presentations, reports, and articles on business, finance, and economics.
Free with trial A bold, red, downward-pointing arrow graphic on a clean white background. This simple yet impactful visual represents decline, decrease, or negative trends. The design is clean and modern, making it suitable for various applications. It can be used to illustrate financial losses, falling sales, or any downward movement or negative trend. The image is versatile and can be used in presentations, reports, websites, and infographics. Chart decrease icon vectors Red Downward Arrow Icon on White Background. A bold, red, downward-pointing arrow graphic on a clean white background. This simple yet impactful visual represents decline, decrease, or negative trends. The design is clean and modern, making it suitable for various applications. It can be used to illustrate financial losses, falling sales, or any downward movement or negative trend. The image is versatile and can be used in presentations, reports, websites, and infographics.
Free with trial A visual representation of a business downturn. This blue bar chart with a descending arrow illustrates a period of negative growth, financial loss, or economic recession. Chart decrease icon vectors Business Decline Graph Vector Icon. A visual representation of a business downturn. This blue bar chart with a descending arrow illustrates a period of negative growth, financial loss, or economic recession
Free with trial Trend Line and Candlestick Chart vector Crypto Trading concept colored seamless pattern. Chart decrease icon vectors Trend Line and Candlestick Chart vector Crypto Trading colored seamless pattern
Free with trial Economic Loss icon vector logo set collection or bundle pack group. Chart decrease icon vectors Economic Loss icon Flat vector set outline. Economic Loss icon vector logo set collection or bundle pack group
Free with trial Candlestick Chart on PC Screen vector Crypto Investment concept colored seamless pattern. Chart decrease icon vectors Candlestick Chart on PC Screen vector Crypto Investment colored seamless pattern
Free with trial Economic Loss icon set in thin line outline style and linear vector sign. Chart decrease icon vectors Economic Loss icon set vector illustration. Economic Loss icon set in thin line outline style and linear vector sign
Free with trial Stock Market Down icon vector image. Suitable for mobile application web application and print media. Chart decrease icon vectors Stock Market Down icon vector image.
Free with trial Up and down arrow icon vector on black square. Upward and downward concept. Chart decrease icon vectors Up and down arrow icon on black square. Upward and downward concept
Free with trial Economic Loss icon logo sign vector outline in black and white color. Chart decrease icon vectors Economic Loss icon Flat fill set collection. Economic Loss icon logo sign vector outline in black and white color
Free with trial Vector icon of a downward arrow or falling graph, symbolizing financial decline, loss trends, market crash, and negative economic performance. Ideal for finance apps, investment platforms, business reports, stock market analysis, and economic infographics. Clean, impactful, and scalable for both digital and print use. Chart decrease icon vectors Financial Decline Trend Loss Graph Icon. Vector icon of a downward arrow or falling graph, symbolizing financial decline, loss trends, market crash, and negative economic performance. Ideal for finance apps, investment platforms, business reports, stock market analysis, and economic infographics. Clean, impactful, and scalable for both digital and print use.
Free with trial Up and down arrow icon set on square background. Upward and downward with long shadow. Chart decrease icon vectors Up and down arrow icon set on square background
Free with trial Web report line icon. Neumorphic, Red gradient, 3d pin buttons. Column graph sign. Growth diagram symbol. Line icons. Neumorphic buttons with outline signs. Vector. Chart decrease icon illustrations Web report line icon. Column graph sign. Line icons. Vector. Web report line icon. Neumorphic, Red gradient, 3d pin buttons. Column graph sign. Growth diagram symbol. Line icons. Neumorphic buttons with outline signs. Vector
Free with trial Simple up and down arrow line icon vector on black circle. Chart decrease icon vectors Simple up and down arrow line icon on black circle
Free with trial Area chart graph is going down showing market volatility. Chart decrease icon vectors Red area chart graph showing market volatility going down. Area chart graph is going down showing market volatility
Free with trial A speed arrow pointing down, isolated on a white background, representing a decrease in speed, performance, or quantity. Chart decrease icon illustrations Speed Arrow Down Isolated on White Background - Symbol of Decrease. A speed arrow pointing down, isolated on a white background, representing a decrease in speed, performance, or quantity.
Free with trial Market down arrow icon symbol isolated on transparent background. Chart decrease icon illustrations Market down arrow icon symbol isolated
Free with trial This simple icon depicts a line graph with one line trending upwards and one trending downwards. Chart decrease icon vectors Line graph showing upward and downward trends icon. This simple icon depicts a line graph with one line trending upwards and one trending downwards
Free with trial Economics Financial Loss Analytics chart vector illustration. Chart decrease icon vectors Economics Financial Loss Analytics chart
Free with trial Crypto Trading Data Visualization vector Candlestick Chart concept colored seamless pattern. Chart decrease icon vectors Crypto Trading Data Visualization vector Candlestick Chart colored seamless pattern
Free with trial Long, three dimensional arrow pointing downwards, symbolizing a decrease or decline. Chart decrease icon illustrations Isometric arrow pointing down representing decrease. Long, three dimensional arrow pointing downwards, symbolizing a decrease or decline
Free with trial Lower cost icon vector logo set collection for web app ui. Chart decrease icon vectors Lower cost icon vector set collection for web. Lower cost icon vector logo set collection for web app ui
Free with trial Uptrend and downtrend arrow icon set. Vectors. Chart decrease icon illustrations Uptrend and downtrend arrow icon set. Vectors
Free with trial A versatile set of business and finance icons isolated on a white background. This collection features various data visualization elements, including bar charts, line graphs, pie charts, and diagrams. The clean, vector style represents concepts like statistical analysis, market growth, financial reporting, and economic trends. These infographic elements are perfect for presentations, business reports, websites, and marketing materials to illustrate progress, performance, and data-driven insights. Chart decrease icon vectors Business and Finance Chart and Graph Icon Set. A versatile set of business and finance icons isolated on a white background. This collection features various data visualization elements, including bar charts, line graphs, pie charts, and diagrams. The clean, vector style represents concepts like statistical analysis, market growth, financial reporting, and economic trends. These infographic elements are perfect for presentations, business reports, websites, and marketing materials to illustrate progress, performance, and data-driven insights.
Free with trial High-Quality Vector Icons. Chart decrease icon illustrations Decrease icon vector, filled. High-Quality Vector Icons
Free with trial Chart showcasing progress. The last bar stands out as a green arrow, symbolising positive growth. Accompanied by cash, it's a powerful representation of financial success. Chart decrease icon vectors Financial Growth Chart with Positive Momentum. Chart showcasing progress. The last bar stands out as a green arrow, symbolising positive growth. Accompanied by cash, it's a powerful representation of financial success...
Free with trial A simple and bold blue arrow icon pointing directly downwards, isolated on a clean white background. This minimalist, flat design graphic is a versatile symbol representing concepts like downloading, decrease, reduction, decline, or moving down. It's an ideal vector-style element for user interfaces (UI), web design, mobile applications, presentations, and infographics. The clean and universally understood pictogram effectively indicates direction, a downward trend, or a call to action like 'scroll down' or 'download'. Chart decrease icon illustrations Blue Down Arrow Icon on White Background. A simple and bold blue arrow icon pointing directly downwards, isolated on a clean white background. This minimalist, flat design graphic is a versatile symbol representing concepts like downloading, decrease, reduction, decline, or moving down. It's an ideal vector-style element for user interfaces (UI), web design, mobile applications, presentations, and infographics. The clean and universally understood pictogram effectively indicates direction, a downward trend, or a call to action like 'scroll down' or 'download'.
Free with trial Economic Loss icon vector line logo mark or symbol set collection outline style. Chart decrease icon vectors Economic Loss icon black and white vector sign. Economic Loss icon vector line logo mark or symbol set collection outline style
Free with trial 3D icon featuring a golden bear and a descending red arrow above blue bars, symbolizing a bearish trend in financial markets. Chart decrease icon vectors Bear Market Graph with Downward Trend 3D Icon. 3D icon featuring a golden bear and a descending red arrow above blue bars, symbolizing a bearish trend in financial markets
Free with trial Economic crisis icon of economy depreciation and business downturn, vector line symbol. Banking investment recession, stock exchange trade fall and money value inflation icon of financial crisis. Chart decrease icon vectors Economic crisis icon economy business depreciation. Economic crisis icon of economy depreciation and business downturn, vector line symbol. Banking investment recession, stock exchange trade fall and money value inflation icon of financial crisis
Free with trial Candlestick Chart vector Professional Financial Trading concept seamless pattern. Chart decrease icon vectors Candlestick Chart vector Professional Financial Trading seamless pattern
Free with trial Downward zigzag arrow icon in generic style. Market crash sign symbol vector. Chart decrease icon vectors Downward zigzag arrow icon in generic style. Market crash sign symbol
Free with trial Up and down direction arrow icon set on circle line. Upward and downward concept. Chart decrease icon vectors Up and down direction arrow icon set on circle line
Free with trial Statistic Up icon outline collection or set in black and white. Chart decrease icon vectors Statistic Up icon Line Art Logo set. Statistic Up icon outline collection or set in black and white
Free with trial Downward zigzag arrow icon on black circle. Market crash sign symbol vector. Chart decrease icon vectors Downward zigzag arrow icon on black circle. Market crash sign symbol
Free with trial Simple vector icon representing a bar graph with a big arrow pointing down. Chart decrease icon illustrations Big arrow pointing down on a decreasing bar graph icon. Simple vector icon representing a bar graph with a big arrow pointing down
Free with trial A 3D icon of a red downward arrow, often used to represent a recession, economic decline, or negative financial performance. Chart decrease icon vectors 3D Red Downward Arrow Indicating Recession Icon. A 3D icon of a red downward arrow, often used to represent a recession, economic decline, or negative financial performance
Free with trial Financial loss icon design vector illustration. Chart decrease icon vectors Financial loss icon design vector illustration
Free with trial Economic Loss icon outline collection or set in black and white. Chart decrease icon vectors Economic Loss icon Line Art Logo set. Economic Loss icon outline collection or set in black and white
Free with trial Economic Loss icon Black line art vector in black and white outline set collection sign. Chart decrease icon vectors Economic Loss icon Black line art vector logo set. Economic Loss icon Black line art vector in black and white outline set collection sign
Free with trial A simple black and white graphic depicts a bar chart with decreasing bars and a downward trending arrow, indicating a decline. Chart decrease icon illustrations Bar chart showing downward trend and arrow. A simple black and white graphic depicts a bar chart with decreasing bars and a downward trending arrow, indicating a decline
Free with trial Online Candlestick Chart vector Professional Financial Trading concept colored seamless pattern. Chart decrease icon vectors Online Candlestick Chart vector Professional Financial Trading colored seamless pattern
Free with trial Oil price down icon. Vector illustration. EPS 10. Stock image. Chart decrease icon vectors Oil price down icon. Vector illustration. EPS 10.
Free with trial Statistics icon set, bar diagram illustration, business graph logo icon vector. Chart decrease icon vectors Statistics icon set, bar diagram illustration, business graph logo icon vector
Free with trial Report statistics line icon. Neumorphic, Green gradient, 3d pin buttons. Column graph sign. Growth diagram symbol. Line icons. Neumorphic buttons with outline signs. Vector. Chart decrease icon vectors Report statistics line icon. Column graph sign. Line icons. Vector. Report statistics line icon. Neumorphic, Green gradient, 3d pin buttons. Column graph sign. Growth diagram symbol. Line icons. Neumorphic buttons with outline signs. Vector
Free with trial Red bar chart with a gray arrow pointing down representing financial loss. Chart decrease icon vectors Red chart arrow pointing down representing financial loss. Red bar chart with a gray arrow pointing down representing financial loss
Free with trial Coins decrease isometric isolated on transparent background. Chart decrease icon illustrations Coins decrease isometric isolated on transparent background
Free with trial A 3D illustration of a downwards statistic chart, isolated on white background, symbolizing decline, loss, or decrease in trends. Chart decrease icon illustrations Statistic down 3D illustration isolated on white background. A 3D illustration of a downwards statistic chart, isolated on white background, symbolizing decline, loss, or decrease in trends
Free with trial A 3D illustration of a downwards statistic chart, isolated on white background, symbolizing decline, loss, or decrease in trends. Chart decrease icon illustrations Statistic down 3D illustration isolated on white background. A 3D illustration of a downwards statistic chart, isolated on white background, symbolizing decline, loss, or decrease in trends
Free with trial Simple vector showing a decreasing bar graph with an earth icon, representing the concept of global recession. Chart decrease icon illustrations Global economy showing decreasing bar graph and earth icon. Simple vector showing a decreasing bar graph with an earth icon, representing the concept of global recession
Free with trial Isometric illustration of a marketing team analyzing a falling financial chart on a tablet. Chart decrease icon illustrations Marketing team analyzing falling financial chart on tablet. Isometric illustration of a marketing team analyzing a falling financial chart on a tablet
Free with trial Red and Green Candlestick Chart vector Crypto Trading and Price Action concept colored seamless pattern. Chart decrease icon vectors Red and Green Candlestick Chart vector Crypto Trading and Price Action colored seamless pattern
Free with trial Baby height chart with clouds measuring from zero to one hundred and fifty centimeters. Chart decrease icon vectors Cartoon height chart measuring tool for kids with a cute sky theme. Baby height chart with clouds measuring from zero to one hundred and fifty centimeters
Free with trial Economic Loss icon set in thin line outline style and linear vector sign. Chart decrease icon vectors Economic Loss icon design in filled and outlined style. Economic Loss icon set in thin line outline style and linear vector sign
Free with trial 3D colorful pie chart and bar graph on a stack of documents illustrating business data and financial analysis. Perfect for presentations or reports. Chart decrease icon illustrations Colorful 3D Pie Chart and Bar Graph on Documents. 3D colorful pie chart and bar graph on a stack of documents illustrating business data and financial analysis. Perfect for presentations or reports.
Free with trial Simple line chart is showing a critical error with an exclamation point symbol. Chart decrease icon vectors Business chart showing critical error with exclamation point. Simple line chart is showing a critical error with an exclamation point symbol
Free with trial Money crash on chart graph with arrow down, fail financial business invest. Fall dollar. Vector flat illustration. Chart decrease icon vectors Money crash on chart graph with arrow down, fail financial business invest. Fall dollar. Vector illustration
Free with trial Diagram icons set in outline stroke design for web. Pack line pictograms with growth bar chart, pie data, datum, marketing, analyzing finance, flow, infographic, statistic, other. Vector illustration. Chart decrease icon vectors Diagram icons set in outline stroke design for web. Pack line pictograms with growth bar chart, pie data, datum
Free with trial A collection of financial chart icons, showcasing data analysis and business growth concepts. The image features multiple variations of a line graph and bar chart combination, presented in both grayscale and beige color schemes. These icons are ideal for illustrating financial reports, business presentations, market trends, and data visualization projects. The clean, modern design makes them suitable for a wide range of applications. Chart decrease icon vectors Financial Chart Icons: Business and Data Analysis. A collection of financial chart icons, showcasing data analysis and business growth concepts. The image. A collection of financial chart icons, showcasing data analysis and business growth concepts. The image features multiple variations of a line graph and bar chart combination, presented in both grayscale and beige color schemes. These icons are ideal for illustrating financial reports, business presentations, market trends, and data visualization projects. The clean, modern design makes them suitable for a wide range of applications.
Free with trial Colorful graph chart is showing and comparing different data results with lines and dots. Chart decrease icon vectors Colorful graph chart showing different data comparing results. Colorful graph chart is showing and comparing different data results with lines and dots
Free with trial Hearts arranged in a downward trend chart, symbolizing decline in love, relationships, or emotional connection. Perfect for breakup, lost love, and relationship analysis concepts. Chart decrease icon vectors Hearts arranged in a downward trend chart, symbolizing decline in love, relationships, or emotional connection. Perfect for
Free with trial Loss icon vector image. Suitable for mobile application web application and print media. Chart decrease icon vectors Loss icon vector image.
Free with trial A clean, flat design illustration featuring a collection of icons related to social media engagement and data analysis. The set includes a pie chart, bar graphs showing upward trends, a line graph with a heart icon and an upward arrow, another line graph with data points, a speech bubble with the word 'LIKE' and abstract shapes, and a thumbs-up icon with a notification count. These graphics are ideal for representing concepts like growth, popularity, analytics, and user feedback in digital marketing, business reports, and web design. Chart decrease icon illustrations Social Media Metrics and Data Visualization Icons. A clean, flat design illustration featuring a collection of icons related to social media engagement and data analysis. The set includes a pie chart, bar graphs showing upward trends, a line graph with a heart icon and an upward arrow, another line graph with data points, a speech bubble with the word 'LIKE' and abstract shapes, and a thumbs-up icon with a notification count. These graphics are ideal for representing concepts like growth, popularity, analytics, and user feedback in digital marketing, business reports, and web design.