Free with trial Charts and diagrams icon collection. Duotone color. Vector illustration. Containing graphic, infographic, graph, pie chart, graphs, bar chart, circular diagram, diagram, decrease, increase, with three design. Chart financial growth decrease vectors Economics strategy, analysis of sales, statistic, data statistic illustration set or collection for banner, landing web page. Charts and diagrams icon collection. Duotone color. Vector illustration. Containing graphic, infographic, graph, pie chart, graphs, bar chart, circular diagram, diagram, decrease, increase, with three design
Free with trial Doodle Graph icon. Blue pen hand drawn infographic symbol on a notepaper piece. Line art style graphic design element. Web button with shadow. Decline, save on expences concept. Chart financial growth decrease vectors Doodle Graph icon
Free with trial Set of sketched icons showing mutual fund nav increases and decreases with indian rupee signs on an alpha transparent base. Chart financial growth decrease vectors Mutual fund nav trend sketch icons with rupee symbol alpha transparent. Set of sketched icons showing mutual fund nav increases and decreases with indian rupee signs on an alpha transparent base.
Free with trial Charts and diagrams icon collection. Duotone color. Vector illustration. Containing graphic, infographic, graph, pie chart, graphs, bar chart, circular diagram, diagram, decrease, increase, with three design. Chart financial growth decrease vectors Economics strategy, analysis of sales, statistic, data statistic illustration set or collection for banner, landing web page. Charts and diagrams icon collection. Duotone color. Vector illustration. Containing graphic, infographic, graph, pie chart, graphs, bar chart, circular diagram, diagram, decrease, increase, with three design
Free with trial Illustration inflation impact on U. S. economy. Black ball labeled INFLATION breaks through distressed cracked American flag background, money concept. Economic crisis, financial market. Chart financial growth decrease illustrations Illustration inflation impact on U. S. economy. Black ball labeled INFLATION breaks through distressed cracked American flag
Free with trial Golden dollar coins stack and down arrow. Flat vector icon isolated on white. Economy, finance, money symbol. Currency pictogram. Vector illustration. decrease. Chart financial growth decrease vectors Golden dollar coins stack and down arrow. Flat vector icon isolated on white. Economy, finance, money symbol. Currency pictogram.
Free with trial Golden dollar coins stack and down arrow. Flat vector icon isolated on white. Economy, finance, money symbol. Currency pictogram. Vector illustration. decrease. Chart financial growth decrease vectors Golden dollar coins stack and down arrow. Flat vector icon isolated on white. Economy, finance, money symbol. Currency pictogram.
Free with trial Golden dollar coins stack and down arrow. Flat vector icon isolated on white. Economy, finance, money symbol. Currency pictogram. Vector illustration. decrease. Chart financial growth decrease vectors Golden dollar coins stack and down arrow. Flat vector icon isolated on white. Economy, finance, money symbol. Currency pictogram.
Free with trial Golden dollar coins stack and down arrow. Flat vector icon isolated on white. Economy, finance, money symbol. Currency pictogram. Vector illustration. decrease. Chart financial growth decrease vectors Golden dollar coins stack and down arrow. Flat vector icon isolated on white. Economy, finance, money symbol. Currency pictogram.
Free with trial Digital glowing arrow and lightning icons in low poly futuristic style on dark background. Chart financial growth decrease vectors Futuristic Polygonal Up Arrow, Lightning Bolt, and Down Arrow Icons. Digital glowing arrow and lightning icons in low poly futuristic style on dark background
Free with trial 3d Red arrow showing downward trend in stock market. Financial crisis concept with broken coins, investment risk, and money loss. Vector illustration. Chart financial growth decrease vectors 3d Red arrow downward trend in stock market. 3d Red arrow showing downward trend in stock market. Financial crisis concept with broken coins, investment risk, and money loss. Vector illustration
Free with trial Set of red 3D arrows pointing downward in various styles. Concept of business decline, market crash, or financial loss for economic visualization. Vector illustration. Chart financial growth decrease vectors Set of red 3D arrows pointing downward
Free with trial The Business man with floating icon show uptrend in investment. Chart financial growth decrease illustrations Business man with floating icon show uptrend in investment
Free with trial The Business man with floating icon show downtrend of investment. Chart financial growth decrease illustrations The Business man with floating icon show downtrend of investment
Free with trial Price Drop Icon. A flat illustration featuring a gold dollar coin with three red arrows pointing down. Chart financial growth decrease vectors Price Drop Icon
Free with trial Stock market profit with uptrend candle sticks and money coins. 3D render vector illustration, arrow and stacking coins on green background. Uptrend stock and crypto currency investment situation. Chart financial growth decrease vectors Stock market profit with uptrend candle sticks and money coins. 3D render vector illustration, arrow and stacking coins
Free with trial An illustration of a businesswoman with a briefcase looking up in concern at a massive pink downward-pointing arrow featuring a white percentage (%) symbol. Chart financial growth decrease vectors . An illustration of a businesswoman with a briefcase looking up in concern at a massive pink downward-pointing arrow featuring a white percentage (%) symbol
Free with trial Business man with floating icon show uptrend of business. Chart financial growth decrease illustrations Business man with floating icon show uptrend of business
Free with trial Business man with floating icon show uptrend of business. Chart financial growth decrease illustrations Business man with floating icon show uptrend of business
Free with trial Percentage arrow icon vector. Percent up and down icon vector. Chart financial growth decrease vectors Up arrow percentage and down arrow percentage icon. Percentage arrow icon vector. Percent up and down icon vector.
Free with trial Arrow down: Arrow down is a symbol indicating decrease or downward movement. Chart financial growth decrease vectors Arrow down
Free with trial Business falling icon isolated on background vector illustration. Non AI Generate. Chart financial growth decrease vectors Business falling icon isolated on background vector illustration.
Free with trial A hand holding magnifying glass focus on Inflation text. Downtrend price movement to show the hyper inflation has started. Symbol, icon and presentation for economy, trading stock market and forex. Chart financial growth decrease illustrations Magnifying glass focus on Inflation text.
Free with trial Cost reduction, cost efficiency, business concept. Chart financial growth decrease illustrations Cost reduction, cost efficiency, business concept
Free with trial A gold bar graph with an arrow pointing down at the end. Chart financial growth decrease illustrations A gold bar graph with an arrow
Free with trial Business arrow up success seamless pattern isolated on color background. Simple background. Chart financial growth decrease vectors Business arrow up success seamless pattern isolated on color background
Free with trial Stack of bitcoin coins. in background a graph showing decrease in value. Falling of cryptocurrency. Chart financial growth decrease vectors Bitcoin, cryptocurrency falling graph, risk, crash, collapse of BTC. Stack of bitcoin coins. in background a graph showing decrease in value. Falling of cryptocurrency.
Free with trial Declining Bar Graph with Downward Arrow, Business Loss and Negative Growth Concept on White Background. Chart financial growth decrease vectors Declining Bar Graph with Downward Arrow, Business Loss
Free with trial Marketing investment and budget speech bubble on blue background. Chart financial growth decrease illustrations Marketing investment and budget speech bubble on blue
Free with trial Sad face beside a downward trend graph with red nodes, a pointing hand, blue card. Ideal for business loss, economic decline, poor performance, failure, recession, financial crisis simple flat. Chart financial growth decrease vectors Declining Line Graph with Sad Face and Pointer Highlighting Negative Performance. Sad face beside a downward trend graph with red nodes, a pointing hand, blue card. Ideal for business loss, economic decline, poor performance, failure, recession, financial crisis simple flat
Free with trial Icon style image shows magnifying glass over finance data. Clean aesthetic with a black background and light colors. Chart financial growth decrease vectors Financial analysis magnifying glass looking at data bar graph. Icon style image shows magnifying glass over finance data. Clean aesthetic with a black background and light colors.
Free with trial Neon Bull and Bear Stock Market Trading. Chart financial growth decrease illustrations Bull Versus Bear Neon Neon Glowing Figures Facing Off, Stock Market Trend Concept. Neon Bull and Bear Stock Market Trading
Free with trial Data displays price changes for various stocks. Chart financial growth decrease illustrations Market trends show price movements for stocks and investments over time. Data displays price changes for various stocks
Free with trial Sales analysis. Sales with charts highlighting performance and revenue decline. Sales data optimization for retail strategies, e-commerce insights, and business reports. Chart financial growth decrease vectors Data Analytics and Sales Decline Concept with Graphs and Marketing Visuals on Screen. Sales analysis. Sales with charts highlighting performance and revenue decline. Sales data optimization for retail strategies, e-commerce insights, and business reports
Free with trial Large percentage sign within a speech bubble and a person holding a pointer, pointing at an arrow. Ideal for finance, business, education, statistics, analysis, presentations strategy. Simple flat. Chart financial growth decrease vectors Financial Presentation With Percentage Sign and Person Explaining Using a Pointer. Large percentage sign within a speech bubble and a person holding a pointer, pointing at an arrow. Ideal for finance, business, education, statistics, analysis, presentations strategy. Simple flat
Free with trial Illustration of a growing business intelligence with a dashboard displaying high metrics, a stack of data chips, and a simple magnifying glass. Vector flat icon design on a white background for a data analysis illustration --chaos 30 --ar 16:9 --v 7 Job ID: cfbe4cc3-3bae-455f-ac79-f340192ae4d4. Chart financial growth decrease illustrations Data Analysis and Reporting Concept Computer Screen with Charts and Magnifying Glass. Illustration of a growing business intelligence with a dashboard displaying high metrics, a stack of data chips, and a simple magnifying glass. Vector flat icon design on a white background for a data analysis illustration --chaos 30 --ar 16:9 --v 7 Job ID: cfbe4cc3-3bae-455f-ac79-f340192ae4d4
Free with trial Business man with floating icon show uptrend of petrochemical industrial. Chart financial growth decrease illustrations Business man with floating icon show uptrend of petrochemical industrial
Free with trial Bankruptcy and inflation business, man in depression. Vector of crisis finance bankruptcy, business economy inflation illustration. Chart financial growth decrease vectors Bankruptcy and inflation business, man in depression
Free with trial Wooden blocks with the word "COST" beside decreasing stacks of coins, accompanied by a downward arrow symbolizing reduced expenses. Chart financial growth decrease illustrations Wooden blocks with the word \'COST\' beside decreasing stacks of coins. Wooden blocks with the word "COST" beside decreasing stacks of coins, accompanied by a downward arrow symbolizing reduced expenses
Free with trial Isometric business analyst professional composition with conceptual financial analysis icons and people vector illustration. Chart financial growth decrease vectors Business Analyst Woman Composition. Isometric business analyst professional composition with conceptual financial analysis icons and people vector illustration
Free with trial Economic recession, business owner seated on a falling down bar graph and a red arrow. Chart financial growth decrease vectors Economic recession, business owner seated on a falling down bar graph and a red arrow.
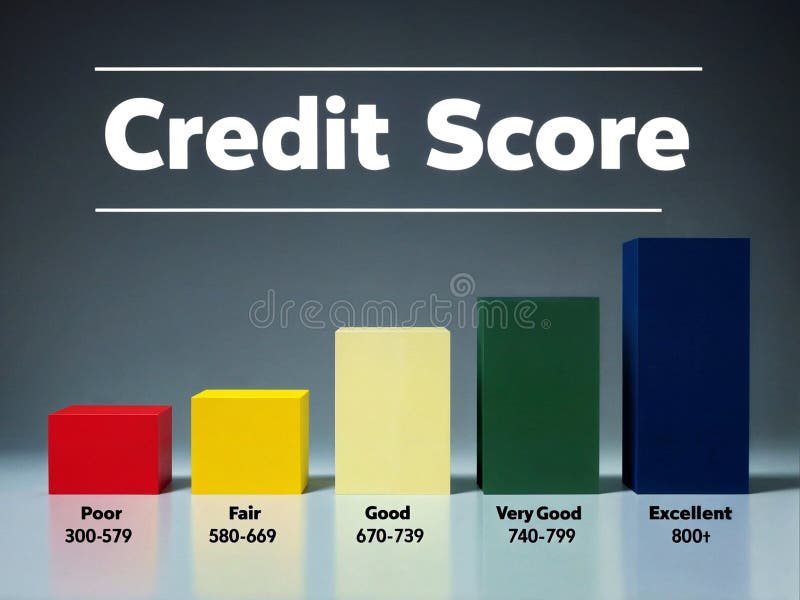
Free with trial 3d render illustration of increasing progress bar of indicating poor, fair, good, very good and excellent level of creditworthiness. Chart financial growth decrease illustrations 3d illustration render progress bars indicating credit score level. 3d render illustration of increasing progress bar of indicating poor, fair, good, very good and excellent level of creditworthiness
Free with trial Professional Vector Logo Design High-Resolution & Fully Editable This high-quality vector logo is designed with precision and creativity making it ideal for modern businesses, startups, and creative professionals The design is clean, scalable, and easy to customize�perfect for branding marketing materials, websites, and print applications. Key Features:100% Vector format (AI EPS SVG)Fully editable (colors, text, and shapes)High resolution � perfect for both web and print Modern, professional, and versatile design Ready for branding and promotional use Elevate your brand with this premium quality logo!. Chart financial growth decrease vectors Dementia icon editable stock vector logo design. Professional Vector Logo Design High-Resolution & Fully Editable This high-quality vector logo is designed with precision and creativity making it ideal for modern businesses, startups, and creative professionals The design is clean, scalable, and easy to customize�perfect for branding marketing materials, websites, and print applications. Key Features:100% Vector format (AI EPS SVG)Fully editable (colors, text, and shapes)High resolution � perfect for both web and print Modern, professional, and versatile design Ready for branding and promotional use Elevate your brand with this premium quality logo!
Free with trial U. S. Inflation and labor market weakness illustration with sad workers and declining wages. Chart financial growth decrease vectors U.S. Inflation and labor market weakness illustration
Free with trial Business arrow up success seamless pattern isolated on black background. Simple background. Chart financial growth decrease vectors Business arrow up success seamless pattern isolated on black background
Free with trial Business arrow up success seamless pattern isolated on white background. Simple background. Chart financial growth decrease vectors Business arrow up success seamless pattern isolated on white background
Free with trial Decreasing arrow and golden coins heap. Crisis, money and loss concept. 3d rendering. Chart financial growth decrease illustrations Decreasing arrow and golden coins heap
Free with trial A clean line drawing showcases a magnifying glass focusing on a hand holding a declining bar graph with a downward. Chart financial growth decrease illustrations Declining Market Analysis Magnifying Glass on Loss Trend. A clean line drawing showcases a magnifying glass focusing on a hand holding a declining bar graph with a downward.
Free with trial A dollar bill connected to a bar graph resembling a sound wave with an arrow. Clear details and vibrant colors. Chart financial growth decrease illustrations Dollar Bill and Sound Wave Bar Graph with Arrow money finance. A dollar bill connected to a bar graph resembling a sound wave with an arrow. Clear details and vibrant colors
Free with trial People and currency trading, white collar workers vector art. Chart financial growth decrease vectors Business Man Showing Rising and Falling Sales Graphs. People and currency trading, white collar workers vector art
Free with trial A person in a suit holding a magnifying glass showing blue upward and red downward percentage arrows. Chart financial growth decrease illustrations Person holding magnifying glass with percentage arrows hand blue. A person in a suit holding a magnifying glass showing blue upward and red downward percentage arrows.
Free with trial Stacked money gold coins with green up arrow and red down arrow, stock market trend icon, finance symbol, investment, profit, and loss, perfect for design and communication illustration. Chart financial growth decrease vectors Stacked money gold coins with green up arrow and red down arrow, stock market trend icon, finance symbol, investment, profit, and
Free with trial This 3D rendering showcases gold bars and coins against a backdrop of a dynamic stock market graph, generated by AI. The image evokes themes of wealth, investment, and market fluctuations. The high-quality rendering emphasizes the precious nature of gold. Chart financial growth decrease illustrations Gold Bullion & Market Graph. This 3D rendering showcases gold bars and coins against a backdrop of a dynamic stock market graph, generated by AI. The image evokes themes of wealth, investment, and market fluctuations. The high-quality rendering emphasizes the precious nature of gold.
Free with trial Business graph with up arrow down arrow logo template. Chart financial growth decrease vectors Business graph with up arrow down arrow logo template
Free with trial Displaying purple world map with rising red bars, red line graph on slide with green grid. Infographic, analytics, digital, technology, finance, strategic, modern. Chart financial growth decrease illustrations Displaying purple world map with rising red bars, red line graph on slide with green grid
Free with trial Up and down directional arrows in vector format for versatile use. Perfect for business infographics and data visualization. EPS 10. Chart financial growth decrease vectors Up and down directional arrows in vector format for versatile use. Perfect for business infographics and data visualization.
Free with trial Illustration of a business activities. Chart financial growth decrease vectors Illustration of a business activities
Free with trial A downward trend is shown on a graph. The graph is black and white. Chart financial growth decrease illustrations A downward trend is shown on a graph
Free with trial A red downward-trending arrow overlays a background of financial documents featuring colorful charts and graphs. A person in a suit is writing on one of the pages, indicating analysis or note-taking. The setting suggests a focus on market trends, possibly within a corporate or financial context. The grid pattern across the image adds a conceptual element of data analysis. a i generated. Chart financial growth decrease illustrations Declining market trends analysis with a downward trending red arrow overlay. A red downward-trending arrow overlays a background of financial documents featuring colorful charts and graphs. A person in a suit is writing on one of the pages, indicating analysis or note-taking. The setting suggests a focus on market trends, possibly within a corporate or financial context. The grid pattern across the image adds a conceptual element of data analysis. a i generated
Free with trial Two cardboard houses, one larger than the other, depict percentage increases in house prices, generated by AI. This visualization effectively communicates the impact of fluctuating real estate market values. Chart financial growth decrease illustrations House Price Percentage Increase. Two cardboard houses, one larger than the other, depict percentage increases in house prices, generated by AI. This visualization effectively communicates the impact of fluctuating real estate market values.
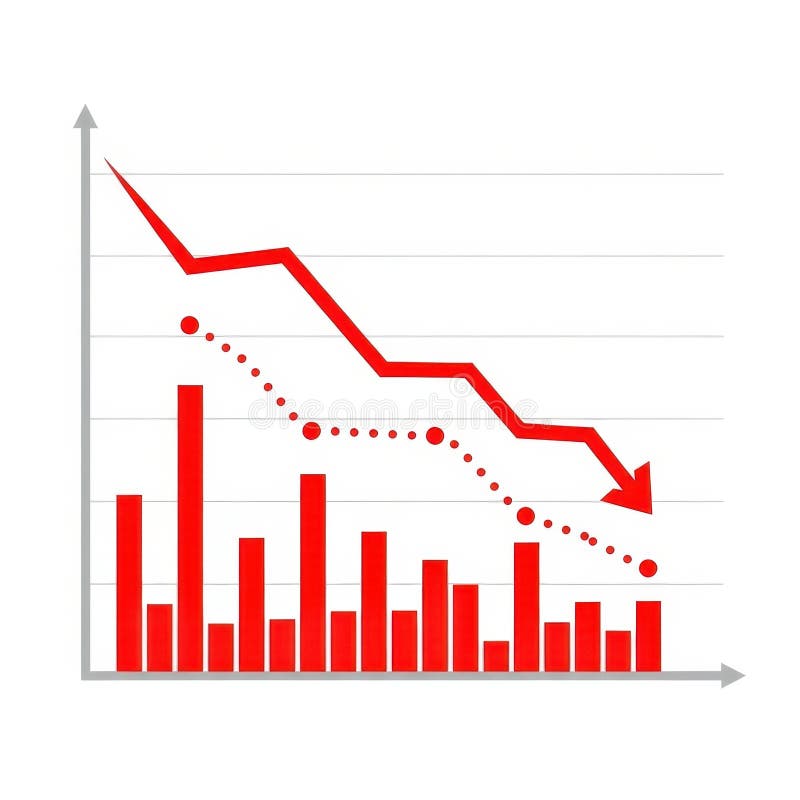
Free with trial A visual representation of negative financial performance. It features red bars and a red line graph showing a downward trend, accompanied by a dotted line indicating a similar pattern. Chart financial growth decrease illustrations Red downward trending graph with bars and dotted line. A visual representation of negative financial performance. It features red bars and a red line graph showing a downward trend, accompanied by a dotted line indicating a similar pattern
Free with trial This illustration shows a downward trend for the US dollar and an upward trend for the Japanese Yen, generated by AI. The graphic uses stylized gold coins with currency symbols and directional arrows to clearly visualize the contrasting market movements. Chart financial growth decrease illustrations USD vs. Yen: Currency Fluctuation. This illustration shows a downward trend for the US dollar and an upward trend for the Japanese Yen, generated by AI. The graphic uses stylized gold coins with currency symbols and directional arrows to clearly visualize the contrasting market movements.
Free with trial Paper cutouts Upward red arrow, zigzag green arrow & downward red arrow on pastel background. Chart financial growth decrease illustrations Red and green arrows up and. Paper cutouts Upward red arrow, zigzag green arrow & downward red arrow on pastel background