Free with trial Financial Loss : Financial loss represents a decrease in money or assets resulting from unsuccessful business activities. Chart financial growth decrease vectors Financial Loss
Free with trial Illustration of a financial decline represented by a bar graph with a downward red arrow. Chart financial growth decrease vectors Financial decline concept with downward arrow on bar graph. Illustration of a financial decline represented by a bar graph with a downward red arrow.
Free with trial This striking graphic illustrates a significant economic downturn or market crash with a bold red arrow plunging downwards. Rendered by Ai, the image uses simple colors to maximize impact setting the alarming decline against subtle background charts. It effectively communicates concepts of loss decrease and a strong negative trend in business metrics. Chart financial growth decrease illustrations Red arrow showing sharp financial market decline. This striking graphic illustrates a significant economic downturn or market crash with a bold red arrow plunging downwards. Rendered by Ai, the image uses simple colors to maximize impact setting the alarming decline against subtle background charts. It effectively communicates concepts of loss decrease and a strong negative trend in business metrics
Free with trial A person meticulously studies complex financial or historical data displayed on a paper chart. The brass-rimmed magnifying glass highlights crucial upticks and downward trends in the graph line. Rendered by Ai. This scene captures the essence of deep research, analysis, and discovery in a vintage setting. Chart financial growth decrease illustrations Magnifying glass focused on a detailed stock chart. A person meticulously studies complex financial or historical data displayed on a paper chart. The brass-rimmed magnifying glass highlights crucial upticks and downward trends in the graph line. Rendered by Ai. This scene captures the essence of deep research, analysis, and discovery in a vintage setting
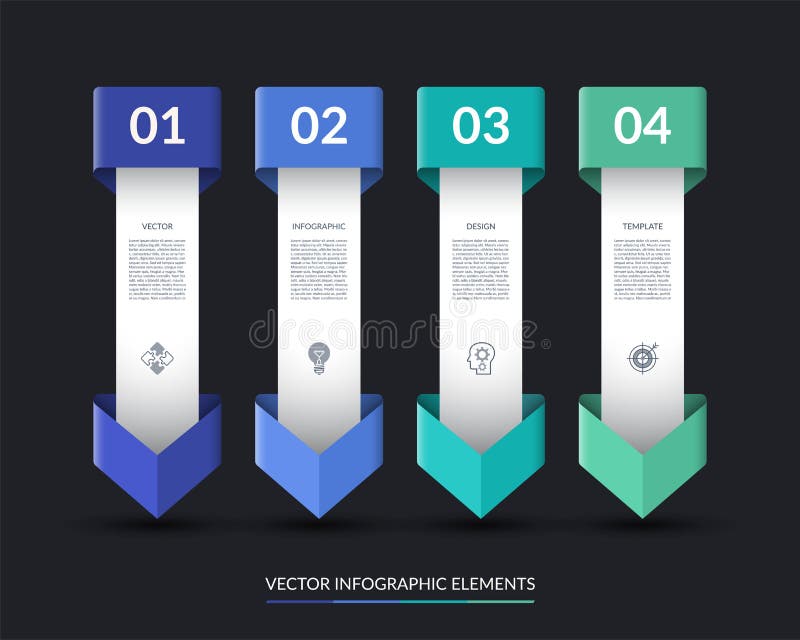
Free with trial Infographic banner with 4 arrows pointing down. Can be used for diagram, graph, chart, report, web design. Vector illustration. Chart financial growth decrease vectors Infographic banner with 4 arrows pointing down. Can be used for diagram, graph, chart, report, web design.
Free with trial Depreciation down graph fail bankruptcy diagram financial business crisis economy vector. Chart financial growth decrease illustrations Depreciation down graph fail bankruptcy diagram financial business crisis economy
Free with trial Downward trend line on a graph, sad face emotion, and cloudy visuals. Ideal for business loss, financial crisis, economic recession, failure, mood weather metaphor decline. Simple flat metaphor. Chart financial growth decrease vectors Declining Performance Chart with Sad Face and Cloudy Atmosphere. Downward trend line on a graph, sad face emotion, and cloudy visuals. Ideal for business loss, financial crisis, economic recession, failure, mood weather metaphor decline. Simple flat metaphor
Free with trial Decrease: Decrease represents a reduction in value, amount, or performance over time. Chart financial growth decrease illustrations Illustration of Decrease. Decrease: Decrease represents a reduction in value, amount, or performance over time.
Free with trial Stock Market - Falling stock prices drop down from Global economic and financial crisis red color tone. Chart financial growth decrease illustrations Stock Market - Falling stock prices drop down from Global economic and financial crisis. Stock Market - Falling stock prices drop down from Global economic and financial crisis red color tone
Free with trial Isometric Business on falling down the chart. Fail, Risk, Problem. Decline red arrow with businessman isolated on white background. Chart financial growth decrease vectors Isometric Business on falling down the chart. Fail, Risk, Problem. Decline red arrow with businessman isolated on white
Free with trial Recession economic crisis financial downturn woman climbs ladder to lightbulb over declining graph with dollar coins pastel background mobile app screen Vector illustration. Chart financial growth decrease vectors Recession economic crisis financial downturn woman climbs ladder to lightbulb over declining graph with dollar coins
Free with trial Downward arrows representing decline, calculator symbolizing calculations, and percentage sign for financial analysis. Ideal for business, finance, data analysis, interest rate, savings, growth. Chart financial growth decrease vectors Decreasing Trends with Financial Calculation and Percentage Concept. Downward arrows representing decline, calculator symbolizing calculations, and percentage sign for financial analysis. Ideal for business, finance, data analysis, interest rate, savings, growth
Free with trial Bankrupt concept. People trying to keep downward financial trend arrow economic risk crisis, money lost business vector. Financial arrow increase, turnover orientation way after downward illustration. Chart financial growth decrease vectors Bankrupt concept. People trying to keep downward financial trend arrow economic risk and crisis, money lost business. Bankrupt concept. People trying to keep downward financial trend arrow economic risk crisis, money lost business vector. Financial arrow increase, turnover orientation way after downward illustration
Free with trial Modern vector illustration of world financial crisis. Oil price drop. ollapse of the economy. Bankruptcy. Down arrow stocks graph. Helping in financial crisis. Stock Market - Arrow Graph Going Down. Chart financial growth decrease vectors Modern vector illustration of world financial crisis. Oil price drop. ollapse of the economy. Bankruptcy. Down arrow. Modern vector illustration of world financial crisis. Oil price drop. ollapse of the economy. Bankruptcy. Down arrow stocks graph. Helping in financial crisis. Stock Market - Arrow Graph Going Down
Free with trial Money increase and decrease icons. Low or high total cost icon. Price, sale, rate or profit going up or down symbol with arrow and dollar sign. Chart financial growth decrease illustrations Money increase and decrease icons. Low or high total cost icon. Price, sale, rate or profit going up or down symbol
Free with trial Money increase and decrease icons. Low or high total cost icon. Price, sale, rate or profit going up or down symbol with arrow and dollar sign. Chart financial growth decrease illustrations Money increase and decrease icons. Low or high total cost icon. Price, sale, rate or profit going up or down symbol
Free with trial Oil pump jack and barrels on newpaper with growth of price of crude oil. Stock market of crude oil, investment and petroleum industry. 3d illustraton. Chart financial growth decrease illustrations Oil pump jack and barrels on newpaper with growth of price of crude oil. Stock market of crude oil, investment and petroleum
Free with trial Line graph illustrating data analysis and business statistics, charting financial growth, market changes, and performance metrics for visual information and infographic content. Chart financial growth decrease illustrations Analyzing data with line graph showing business trends. Line graph illustrating data analysis and business statistics, charting financial growth, market changes, and performance metrics for visual information and infographic content
Free with trial Money icon with arrows, capital decrease and increase, dollar rate increase, investment concept – stock vector. Chart financial growth decrease illustrations Money icon with arrows, capital decrease and increase, dollar rate increase, investment concept – vector
Free with trial Illustration depicting financial growth 1. Chart financial growth decrease vectors Business chart 2. Illustration depicting financial growth 1
Free with trial Simple black icons representing financial growth and decline, perfect for business analytics and reporting. This scalable vector graphic is versatile for web and print. Chart financial growth decrease vectors Bar charts with arrows indicating growth or decline. Simple black icons representing financial growth and decline, perfect for business analytics and reporting. This scalable vector graphic is versatile for web and print
Free with trial A flat design vector illustration showing a graph with rising and falling bars, marked by green and red arrows indicating increase and decrease. Ideal for financial concepts. Chart financial growth decrease vectors Bar chart showing positive and negative data trends. A flat design vector illustration showing a graph with rising and falling bars, marked by green and red arrows indicating increase and decrease. Ideal for financial concepts
Free with trial Colored infographic financial elements collection of business audit management icons in sketch style isolated vector illustration. Chart financial growth decrease vectors Colored Infographic Financial Elements Collection
Free with trial Black and white outline showing a gear, a chart with falling bars, and an arrow pointing down, symbolizing economic. Chart financial growth decrease illustrations Economic Downturn Gear, Chart, Arrow Down, Black and White. Black and white outline showing a gear, a chart with falling bars, and an arrow pointing down, symbolizing economic.
Free with trial Two simple icons representing financial market performance, one showing a downward trend and the other an upward trend, both with dollar symbols. Chart financial growth decrease vectors Financial graph icons showing market trends up and down. Two simple icons representing financial market performance, one showing a downward trend and the other an upward trend, both with dollar symbols
Free with trial This graphic displays two circular icons, one depicting a downward-pointing arrow with a dollar sign, symbolizing a decrease in value, and the other an upward arrow with a dollar sign, representing an increase. Chart financial growth decrease vectors Cost decrease or increase icon. Downward vs upward dollar signs. This graphic displays two circular icons, one depicting a downward-pointing arrow with a dollar sign, symbolizing a decrease in value, and the other an upward arrow with a dollar sign, representing an increase.
Free with trial Global international chart trend. Macroeconomic data and information, changing market monocolor vector illustration. Chart financial growth decrease vectors Global international chart trend
Free with trial A clean black and white set of nine vector icons showing growth, decline, stability, and financial trends for business presentations and reports. Chart financial growth decrease vectors Economic trend icons set flat design vector illustration. A clean black and white set of nine vector icons showing growth, decline, stability, and financial trends for business presentations and reports.
Free with trial Isometric banner template showing inflation concept. Vector illustration of financial crisis, rising prices, and money value decrease. Data analysis report with charts and upward arrow for web design. Chart financial growth decrease vectors Inflation And Economic Crisis Data Analysis Isometric Banner Template Vector Illustration. Isometric banner template showing inflation concept. Vector illustration of financial crisis, rising prices, and money value decrease. Data analysis report with charts and upward arrow for web design
Free with trial A professional businessman analyzes private equity portfolio management data on a large screen, evaluating ebitda growth, revenue increase, and cost optimization charts while taking notes. Chart financial growth decrease vectors Man Analyzing Financial Charts for Private Equity Portfolio. A professional businessman analyzes private equity portfolio management data on a large screen, evaluating ebitda growth, revenue increase, and cost optimization charts while taking notes
Free with trial A simplified flat style icon displays a declining bar graph with arrow. Focuses on business and financial themes. Chart financial growth decrease vectors Flat icon illustration showing bar chart trending downwards. A simplified flat style icon displays a declining bar graph with arrow. Focuses on business and financial themes.
Free with trial A comprehensive set of vector line icons depicting bull and bear market trends. This collection features various combinations of bull and bear silhouettes integrated with financial charts, including rising and falling line graphs and bar graphs. Each icon clearly symbolizes either a bullish market (growth, upward trend) or a bearish market (decline, downward trend). Ideal for financial websites, trading applications, investment presentations, economic reports, infographics, and educational materials illustrating stock market dynamics and investment strategies. Chart financial growth decrease vectors Bull and Bear Market Stock Trading Line Icons Set. A comprehensive set of vector line icons depicting bull and bear market trends. This collection features various combinations of bull and bear silhouettes integrated with financial charts, including rising and falling line graphs and bar graphs. Each icon clearly symbolizes either a bullish market (growth, upward trend) or a bearish market (decline, downward trend). Ideal for financial websites, trading applications, investment presentations, economic reports, infographics, and educational materials illustrating stock market dynamics and investment strategies.
Free with trial Abstract green line graph on black background. Stock photo of financial chart. Chart financial growth decrease illustrations Vibrant Green Lightning Bolt on Black Background, Electric Energy Discharge. Abstract green line graph on black background. Stock photo of financial chart
Free with trial Up and down sign with green and red arrows vector illustration, sales bar chart symbol icon with arrow moving down and bar chart with arrow moving up, EPS 10. Chart financial growth decrease vectors Up and down sign with green and red arrows vector illustration, sales bar chart symbol icon. Up and down sign with green and red arrows vector illustration, sales bar chart symbol icon with arrow moving down and bar chart with arrow moving up, EPS 10
Free with trial 3D decreasing red arrow on the chart. Chart financial growth decrease illustrations Decreasing red arrow on the chart
Free with trial Data trends. Data with arrows indicating increase and decrease, growth chart, and audio waveform. Data trends highlight growth, performance tracking, and communication analysis. Suitable. Chart financial growth decrease illustrations Data Trends and Analysis with Arrows, Graph, and Audio Waveform Communication Metrics. Data trends. Data with arrows indicating increase and decrease, growth chart, and audio waveform. Data trends highlight growth, performance tracking, and communication analysis. Suitable
Free with trial Cost reduction text with downward arrow and bar chart on neutral background. Business finance concept for expense control, budget management, savings strategy, and profit optimization. Chart financial growth decrease illustrations Cost Reduction Concept with Downward Arrow and Bar Chart 3d render. Cost reduction text with downward arrow and bar chart on neutral background. Business finance concept for expense control, budget management, savings strategy, and profit optimization
Free with trial Cost reduction text with downward arrow and bar chart on neutral background. Business finance concept for expense control, budget management, savings strategy, and profit optimization. Chart financial growth decrease illustrations Cost Reduction Concept with Downward Arrow and Bar Chart 3d render. Cost reduction text with downward arrow and bar chart on neutral background. Business finance concept for expense control, budget management, savings strategy, and profit optimization
Free with trial Cost reduction text with downward arrow and bar chart on neutral background. Business finance concept for expense control, budget management, savings strategy, and profit optimization. Chart financial growth decrease illustrations Cost Reduction Concept with Downward Arrow and Bar Chart 3d render. Cost reduction text with downward arrow and bar chart on neutral background. Business finance concept for expense control, budget management, savings strategy, and profit optimization
Free with trial Cost reduction text with downward arrow and bar chart on neutral background. Business finance concept for expense control, budget management, savings strategy, and profit optimization. Chart financial growth decrease illustrations Cost Reduction Concept with Downward Arrow and Bar Chart 3d render. Cost reduction text with downward arrow and bar chart on neutral background. Business finance concept for expense control, budget management, savings strategy, and profit optimization
Free with trial Cost reduction text with downward arrow and bar chart on neutral background. Business finance concept for expense control, budget management, savings strategy, and profit optimization. Chart financial growth decrease illustrations Cost Reduction Concept with Downward Arrow and Bar Chart 3d render. Cost reduction text with downward arrow and bar chart on neutral background. Business finance concept for expense control, budget management, savings strategy, and profit optimization
Free with trial Cost reduction text with downward arrow and bar chart on neutral background. Business finance concept for expense control, budget management, savings strategy, and profit optimization. Chart financial growth decrease illustrations Cost Reduction Concept with Downward Arrow and Bar Chart 3d render. Cost reduction text with downward arrow and bar chart on neutral background. Business finance concept for expense control, budget management, savings strategy, and profit optimization
Free with trial Cost reduction text with downward arrow and bar chart on neutral background. Business finance concept for expense control, budget management, savings strategy, and profit optimization. Chart financial growth decrease illustrations Cost Reduction Concept with Downward Arrow and Bar Chart 3d render. Cost reduction text with downward arrow and bar chart on neutral background. Business finance concept for expense control, budget management, savings strategy, and profit optimization
Free with trial Cost reduction text with downward arrow and bar chart on neutral background. Business finance concept for expense control, budget management, savings strategy, and profit optimization. Chart financial growth decrease illustrations Cost Reduction Concept with Downward Arrow and Bar Chart 3d render. Cost reduction text with downward arrow and bar chart on neutral background. Business finance concept for expense control, budget management, savings strategy, and profit optimization
Free with trial Cost reduction text with downward arrow and bar chart on neutral background. Business finance concept for expense control, budget management, savings strategy, and profit optimization. Chart financial growth decrease illustrations Cost Reduction Concept with Downward Arrow and Bar Chart 3d render. Cost reduction text with downward arrow and bar chart on neutral background. Business finance concept for expense control, budget management, savings strategy, and profit optimization
Free with trial 3D render illustrating exchange rate fluctuations. A red arrow points downwards, representing a decrease in value, while a green arrow points upwards, indicating an increase. Currency symbols for the Euro, US Dollar, and British Pound are scattered around the arrows, emphasizing the concept of currency exchange rates. The image is set against a clean white background, making it suitable for financial news, economic reports, or educational materials. Chart financial growth decrease vectors Exchange Rate Fluctuations
Free with trial Stocks fall. Candle stick graph chart of stock market investment trading. Bullish point, down trend of graph. Futuristic red signal trend drop down arrow chart. Chart financial growth decrease vectors Stocks fall. Candle stick graph chart of stock market investment trading. Bullish point, down trend of graph. Futuristic red. Stocks fall. Candle stick graph chart of stock market investment trading. Bullish point, down trend of graph. Futuristic red signal trend drop down arrow chart
Free with trial Metallic key floating before digital stock chart with red blue bars. Chart financial growth decrease illustrations Golden Key on Stock Market Candlestick Chart Background, Trading Success Concept. Metallic key floating before digital stock chart with red blue bars
Free with trial Statistic Bar Chart Outline Sign Data Stats Business Performance Market Analysis Economic Trend Line Icon Presentation Display Board Symbol. Chart financial growth decrease vectors Statistic Bar Chart Outline Sign Data Stats Business Performance Market Analysis Economic Trend Line Icon Presentation Display
Free with trial Global economic slowdown, world GDP growth decline or sluggish, recession or growth slowing down concept, businessman pushing slow snail with the earth on GDP growing arrow metaphor of world economy. Chart financial growth decrease vectors Global economic slowdown, world GDP growth decline or sluggish, recession or growth slowing down concept, businessman pushing slow
Free with trial Minimalist outline drawing of a bar chart representing data analysis and statistical information. Great for presentations and data representations. Chart financial growth decrease vectors Simple Outline Bar Chart Sign Statistical Data Analysis Diagram Icon. Minimalist outline drawing of a bar chart representing data analysis and statistical information. Great for presentations and data representations.
Free with trial The graph displays two lines, one green and one red. The green line is ascending, indicating growth or progress, while the red line is descending, suggesting a decline or decrease. Chart financial growth decrease illustrations A graph with a green line and a red line. The graph displays two lines, one green and one red. The green line is ascending, indicating growth or progress, while the red line is descending, suggesting a decline or decrease
Free with trial Increasing piles of coins with going up graph. Concept for financial growth. illustration. Chart financial growth decrease vectors Increasing piles of coins with going up graph.
Free with trial Continuous one line drawing of up and down arrows. Minimalist vector illustration of business growth graph symbol. Single line art icon representing increase and decrease trends. Chart financial growth decrease vectors Continuous one line drawing of up and down arrows. Minimalist vector illustration of business growth graph symbol. Single line art
Free with trial The image showcases a smartphone displaying financial data visualizations, including line graphs and bar charts. Additional icons and graphics related to data analysis and finance surround the phone, emphasizing the digital and analytical nature of the content. This composition was generated by AI,. Chart financial growth decrease illustrations Mobile Financial Data. The image showcases a smartphone displaying financial data visualizations, including line graphs and bar charts. Additional icons and graphics related to data analysis and finance surround the phone, emphasizing the digital and analytical nature of the content. This composition was generated by AI,
Free with trial Green red up and down gold chart icon isolated flat style vector illustration on white background. Chart financial growth decrease vectors Green red up and down gold chart icon isolated flat style
Free with trial A hand holding magnifying glass, focused on a candlestick chart displayed on a mobile phone, with a blurred Recession text. Downtrend price movement to show the hyper inflation has started. Symbol, icon and presentation for economy, trading stock market and forex. Chart financial growth decrease illustrations Candlestick chart displayed on a mobile phone, with a blurred Recession text.
Free with trial A simple and clean line graph icon illustration, perfect for illustrating financial data, growth charts, and statistical analysis. Ideal for use in presentations, reports, and websites. Chart financial growth decrease vectors Minimalist Line Graph Icon Design for Financial Data Analysis Presentation. A simple and clean line graph icon illustration, perfect for illustrating financial data, growth charts, and statistical analysis. Ideal for use in presentations, reports, and websites.
Free with trial Arrows with dollar signs indicating financial trends and market directions. Chart financial growth decrease illustrations Arrows with dollar signs indicating financial trends and market directions
Free with trial Percent arrow down and up icon on circle line. Percentage decline and growth sign symbol vector. Chart financial growth decrease vectors Percent arrow down and up icon on circle line. Percentage decline and growth sign symbol
Free with trial Up and Down sign with green and red arrows vector illustration. Concept of sales bar chart symbol icon with arrow moving down and sales bar chart with arrow moving up. Chart financial growth decrease vectors Up and Down sign with green and red arrows vector illustration. Concept of sales bar chart symbol icon
Free with trial A hand holding magnifying glass, focused on a candlestick chart displayed on a mobile phone, with a blurred Hyperinflation text. Downtrend price movement to show the hyper inflation has started. Symbol, icon and presentation for economy, trading stock market and forex. Chart financial growth decrease illustrations Candlestick chart displayed on a mobile phone, with a blurred Hyperinflation text.
Free with trial Diagram Graph And Financial Charts icons set with white background. Thin Line Style stock vector. Chart financial growth decrease vectors Diagram Graph And Financial Charts icons set with white background.
Free with trial Battery lithium energy storage price goes down drop decrease cheap in global commodity market trade export transaction vector. Chart financial growth decrease vectors Battery lithium energy storage price goes down drop decrease cheap in global commodity market trade export transaction
Free with trial Decreasing graphs concept, financial strategy, low return on investment, the balance sheet of money and gold, long-term investment decline, reduced revenue, interest rate, credit money. Paper style vector. Chart financial growth decrease vectors Decreasing graphs concept, financial strategy. Paper cut style vector. Decreasing graphs concept, financial strategy, low return on investment, the balance sheet of money and gold, long-term investment decline, reduced revenue, interest rate, credit money. Paper style vector.
Free with trial Infographic template with 5 arrows pointing down. Can be used for diagram, graph, chart, report, web design. Vector illustration. Chart financial growth decrease vectors Infographic template with 5 arrows pointing down. Can be used for diagram, graph, chart, report, web design.
Free with trial A comprehensive collection of flat line design icons representing key concepts in business, finance, and data analytics. The set includes various charts (bar, line, pie), a speedometer, a magnifying glass with a graph, financial documents with checkmarks, a target with an arrow, a dollar sign, a percentage symbol, and directional arrows for growth and decline. These versatile vector elements are ideal for presentations, reports, websites, and applications focused on statistics, performance, strategy, and financial insights. Chart financial growth decrease illustrations Business and Data Analytics Flat Line Icons Set. A comprehensive collection of flat line design icons representing key concepts in business, finance, and data analytics. The set includes various charts (bar, line, pie), a speedometer, a magnifying glass with a graph, financial documents with checkmarks, a target with an arrow, a dollar sign, a percentage symbol, and directional arrows for growth and decline. These versatile vector elements are ideal for presentations, reports, websites, and applications focused on statistics, performance, strategy, and financial insights.
Free with trial A bright red arrow points diagonally downwards against a clean white background. The arrow is rendered with a slight 3D effect, casting a soft shadow beneath it, suggesting depth and movement. This universally recognized symbol represents decline, decrease, or a negative trend, making it ideal for financial, business, or data-related concepts. Chart financial growth decrease illustrations Red Downward Arrow Symbol. A bright red arrow points diagonally downwards against a clean white background. The arrow is rendered with a slight 3D effect, casting a soft shadow beneath it, suggesting depth and movement. This universally recognized symbol represents decline, decrease, or a negative trend, making it ideal for financial, business, or data-related concepts.
Free with trial Illustration of a growing mobile application usage with a simple phone screen displaying a rising graph, a stylized touch hand, and a stream of download arrows. Vector flat icon design on a white background for a user adoption illustration --chaos 30 --ar 16:9 --v 7 Job ID: 938d3d73-bd25-4740-98fd-21a43555bec1. Chart financial growth decrease illustrations Smartphone showing declining graph with arrows pointing down, concept of financial loss, data decrease. Illustration of a growing mobile application usage with a simple phone screen displaying a rising graph, a stylized touch hand, and a stream of download arrows. Vector flat icon design on a white background for a user adoption illustration --chaos 30 --ar 16:9 --v 7 Job ID: 938d3d73-bd25-4740-98fd-21a43555bec1
Free with trial Blue curved arrow pointing down and right vector illustration. Business growth, financial decline, process flow, navigation path, strategic movement, data visualization. Wavy directional pointer. Chart financial growth decrease vectors Blue curved arrow pointing down and right for business growth and process flow vector illustration. Blue curved arrow pointing down and right vector illustration. Blue curved arrow pointing down and right vector illustration. Business growth, financial decline, process flow, navigation path, strategic movement, data visualization. Wavy directional pointer
Free with trial A comprehensive vector icon set featuring essential symbols for business, finance, and data analysis. This collection includes various arrows for indicating growth and decline, wavy lines representing market trends, checkmarks for success or approval, X marks for errors or rejection, stopwatches for time management and efficiency, and stacks of coins with dollar signs for financial concepts. Ideal for presentations, infographics, web design, and reports to visually communicate progress, status, and economic indicators. Chart financial growth decrease vectors Business, Finance, and Data Analytics Vector Icon Set. A comprehensive vector icon set featuring essential symbols for business, finance, and data analysis. This collection includes various arrows for indicating growth and decline, wavy lines representing market trends, checkmarks for success or approval, X marks for errors or rejection, stopwatches for time management and efficiency, and stacks of coins with dollar signs for financial concepts. Ideal for presentations, infographics, web design, and reports to visually communicate progress, status, and economic indicators.
Free with trial Metal barrels of oil with green and red arrows. Showing rise and fall of gasoline prices. Fuel costs. Stock market investment. Economy growth or crisis recession. Diesel gallon trade. Vector concept. Chart financial growth decrease vectors Metal barrels of oil with green and red arrows. Showing rise and fall of gasoline prices. Stock market investment. Economy growth. Metal barrels of oil with green and red arrows. Showing rise and fall of gasoline prices. Fuel costs. Stock market investment. Economy growth or crisis recession. Diesel gallon trade. Vector concept
Free with trial Percentage arrow. rate increase and decrease concept. Chart financial growth decrease vectors Percentage arrow. rate increase and decrease concept.
Free with trial A vibrant digital explosion of glowing stock market data, featuring percentage gains and losses, trading volumes, and financial charts on a dark background. Chart financial growth decrease illustrations Digital Stock Market Data Explosion with Glowing Graphs Percentages and Financial Numbers. A vibrant digital explosion of glowing stock market data, featuring percentage gains and losses, trading volumes, and financial charts on a dark background