Free with trial A flat depicting two distinct financial charts against a white background. The left chart a bar graph with bars in shades of green and blue, topped by a jagged blue line graph ascending towards a green percentage symbol and an upward arrow. The right chart a bar graph with bars in yellow, orange, and red, with a red line graph descending from a yellow dollar sign. Data analysis decrease illustrations Upward and downward financial charts with percentage and dollar symbols. A flat depicting two distinct financial charts against a white background. The left chart a bar graph with bars in shades of green and blue, topped by a jagged blue line graph ascending towards a green percentage symbol and an upward arrow. The right chart a bar graph with bars in yellow, orange, and red, with a red line graph descending from a yellow dollar sign
Free with trial Smiling blue face beside a decreasing bar graph, signifying satisfaction, feedback, or performance trends. Ideal for analytics, feedback, emotions, surveys, performance data presentation simple. Data analysis decrease vectors Positive Feedback Represented by Happy Face and Declining Bar Graph. Smiling blue face beside a decreasing bar graph, signifying satisfaction, feedback, or performance trends. Ideal for analytics, feedback, emotions, surveys, performance data presentation simple
Free with trial Downward Business Graph with Arrows Financial Loss and Market Decline Concept. Data analysis decrease vectors Downward Business Graph with Arrows Financial Loss and Market Decline Concept
Free with trial Two distinct bar charts are depicted against a white background. The left chart a downward trend with bars in blue, yellow, and purple, accompanied by a yellow coin with a dollar sign and an arrow pointing down towards it from a small graph indicating a rising trend. The right chart an upward trend with bars in red, green, and blue, and a green coin with a dollar sign connected to a circle with a. Data analysis decrease illustrations Bar charts showing financial growth and decline with dollar symbols. Two distinct bar charts are depicted against a white background. The left chart a downward trend with bars in blue, yellow, and purple, accompanied by a yellow coin with a dollar sign and an arrow pointing down towards it from a small graph indicating a rising trend. The right chart an upward trend with bars in red, green, and blue, and a green coin with a dollar sign connected to a circle with a
Free with trial A dynamic, futuristic digital display showing a falling stock market chart. This detailed financial graph features glowing red candlestick patterns and line charts indicating a significant downward trend and high volatility. The image represents concepts like an economic crisis, bear market, financial recession, investment risk, and a stock market crash. It's an ideal visual for business reports, financial news, technology articles, and presentations on global economics, trading, or fintech, conveying a sense of urgency and downturn. Data analysis decrease illustrations Stock Market Crash and Financial Downturn Graph. A dynamic, futuristic digital display showing a falling stock market chart. This detailed financial graph features glowing red candlestick patterns and line charts indicating a significant downward trend and high volatility. The image represents concepts like an economic crisis, bear market, financial recession, investment risk, and a stock market crash. It's an ideal visual for business reports, financial news, technology articles, and presentations on global economics, trading, or fintech, conveying a sense of urgency and downturn.
Free with trial A 3D rendered candlestick stock market chart displays a downward trend. Green bars, indicating upward movement, are followed by red bars, signifying a decline. The chart is angled diagonally across a white background, with a subtle shadow cast beneath it, emphasizing the concept of financial loss or market downturn. Data analysis decrease illustrations Downward Trending Stock Market Candlestick Chart with Red and Green Bars on a White Background. A 3D rendered candlestick stock market chart displays a downward trend. Green bars, indicating upward movement, are followed by red bars, signifying a decline. The chart is angled diagonally across a white background, with a subtle shadow cast beneath it, emphasizing the concept of financial loss or market downturn
Free with trial A 3D rendered illustration of a stock market candlestick chart is shown against a light blue background. The chart displays a mix of red and green candlesticks, indicating price fluctuations. A prominent red arrow points downwards, signifying a market decline. A white zigzag line also charts a downward trend. To the right, a red exclamation mark and a red dot serve as a warning or alert symbol. Data analysis decrease illustrations 3D Rendered Stock Market Candlestick Chart with Falling Red Arrow and Exclamation Mark finance. A 3D rendered illustration of a stock market candlestick chart is shown against a light blue background. The chart displays a mix of red and green candlesticks, indicating price fluctuations. A prominent red arrow points downwards, signifying a market decline. A white zigzag line also charts a downward trend. To the right, a red exclamation mark and a red dot serve as a warning or alert symbol
Free with trial A businessman presents a tablet with glowing arrows symbolizing the interplay of quality improvement and cost reduction, showcasing concepts of business optimization and success. Qubit. Data analysis decrease illustrations Businessman Holding Tablet with Neon Arrows Indicating Quality Increase and Cost Decrease, Concept of Optimizing. A businessman presents a tablet with glowing arrows symbolizing the interplay of quality improvement and cost reduction, showcasing concepts of business optimization and success. Qubit
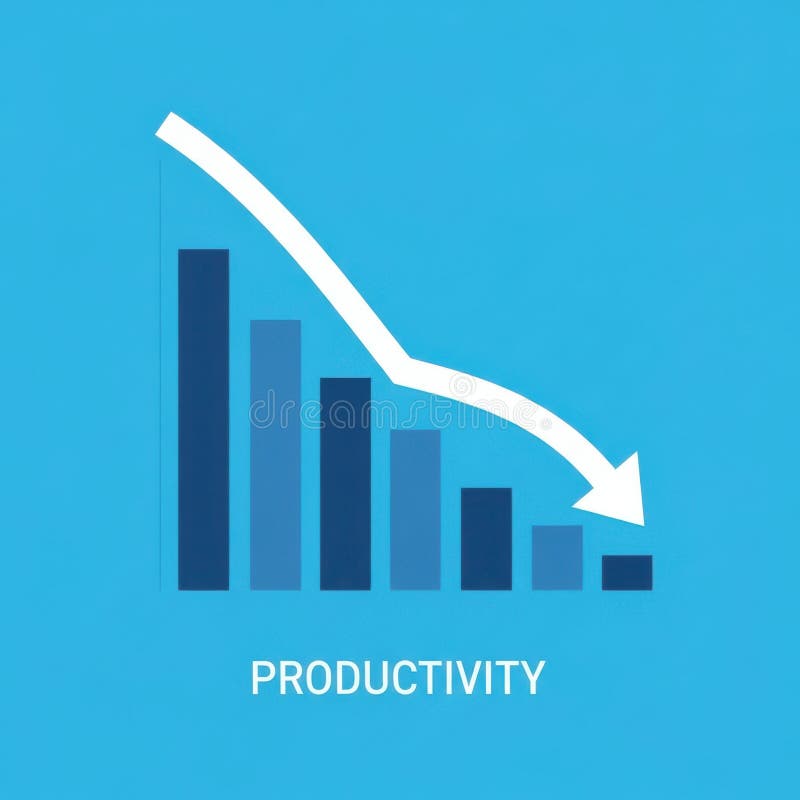
Free with trial A bar graph visually represents a downward trend in productivity over time, indicating a decline in efficiency or output. Data analysis decrease illustrations Decreasing Productivity Graph Showing Decline. A bar graph visually represents a downward trend in productivity over time, indicating a decline in efficiency or output
Free with trial A close-up shot of a smartphone displaying a stock market chart, showing fluctuating prices. The dark theme enhances the visual impact of the pink graph line, generated by AI for a modern and sleek aesthetic. This image is perfect for illustrating financial technology, mobile trading, and investmen. Data analysis decrease illustrations Mobile Stock Market Chart. A close-up shot of a smartphone displaying a stock market chart, showing fluctuating prices. The dark theme enhances the visual impact of the pink graph line, generated by AI for a modern and sleek aesthetic. This image is perfect for illustrating financial technology, mobile trading, and investmen
Free with trial Two bar graphs, one green showing growth and one red showing decline, with trend lines indicating opposite directions. Data analysis decrease illustrations Bar graphs showing upward and downward trends. Two bar graphs, one green showing growth and one red showing decline, with trend lines indicating opposite directions
Free with trial This image features three bold, three-dimensional arrows pointing sharply downward, each rendered in distinct vibrant colors�'blue, yellow, and red�'symbolizing a significant market downturn, financial loss, or economic decline, set against a clean, minimalist white background that enhances their striking visual impact and conveys urgency and negative momentum in business, trading, or investment. Data analysis decrease illustrations Colorful downward trending financial arrows in blue yellow and red illustrating market decline and economic downturn concepts. This image features three bold, three-dimensional arrows pointing sharply downward, each rendered in distinct vibrant colors�'blue, yellow, and red�'symbolizing a significant market downturn, financial loss, or economic decline, set against a clean, minimalist white background that enhances their striking visual impact and conveys urgency and negative momentum in business, trading, or investment
Free with trial This image features a minimalist and modern vector icon of a jagged downward trending line graph, sharply declining from left to right, symbolizing financial loss, economic downturn, or market decline, set against a clean and uncluttered white background suitable for use in presentations, reports, infographics, or digital media to visually communicate negative trends or decreasing performance. Data analysis decrease illustrations Sharp downward trending line graph icon isolated on white background representing financial loss or market decline vector. This image features a minimalist and modern vector icon of a jagged downward trending line graph, sharply declining from left to right, symbolizing financial loss, economic downturn, or market decline, set against a clean and uncluttered white background suitable for use in presentations, reports, infographics, or digital media to visually communicate negative trends or decreasing performance
Free with trial Futuristic Robot Hand Displaying Download Icon for Cost Reduction Strategy in Digital Business Environment Quark. Data analysis decrease illustrations Futuristic Robot Hand Displaying Download Icon for Cost Reduction Strategy in Digital Business Environment Quark
Free with trial A vibrant red arrow graph sharply declining against a dark, textured background, symbolizing a significant financial downturn or economic crisis. Data analysis decrease illustrations Red downward arrow graph on dark background showing financial crisis. A vibrant red arrow graph sharply declining against a dark, textured background, symbolizing a significant financial downturn or economic crisis
Free with trial A bold outline illustration of a computer screen displaying a downward trending line, representing financial loss or negative growth. Data analysis decrease vectors Bold Outline Computer Screen with Falling Trend Line Icon Illustration. A bold outline illustration of a computer screen displaying a downward trending line, representing financial loss or negative growth.
Free with trial 3d illustration of red decreasing graph on stand, financial presentation representing negative results or economic downturn. Data analysis decrease vectors 3d illustration of red decreasing graph on stand, financial presentation representing negative results
Free with trial A black upward arrow merges into a downward curving line graph on a white background. Data analysis decrease illustrations Black upward arrow and downward curve graph on white background chart. A black upward arrow merges into a downward curving line graph on a white background
Free with trial A clean and modern graphic featuring the number '5%' prominently displayed on a soft, golden gradient background. A bright, circular spotlight effect emanates from the right side, creating a sense of illumination and focus. This versatile image is ideal for representing discounts, sales, special offers, promotions, or any concept related to a five percent value. The minimalist design and ample negative space make it perfect for adding text overlays or integrating into various marketing materials. Data analysis decrease illustrations Five Percent Discount - Clean Gradient Background with Spotlight Effect. A clean and modern graphic featuring the number '5%' prominently displayed on a soft, golden gradient background. A bright, circular spotlight effect emanates from the right side, creating a sense of illumination and focus. This versatile image is ideal for representing discounts, sales, special offers, promotions, or any concept related to a five percent value. The minimalist design and ample negative space make it perfect for adding text overlays or integrating into various marketing materials.
Free with trial This 3D rendering showcases gold bars and coins against a backdrop of a dynamic stock market graph, generated by AI. The image evokes themes of wealth, investment, and market fluctuations. The high-quality rendering emphasizes the precious nature of gold. Data analysis decrease illustrations Gold Bullion & Market Graph. This 3D rendering showcases gold bars and coins against a backdrop of a dynamic stock market graph, generated by AI. The image evokes themes of wealth, investment, and market fluctuations. The high-quality rendering emphasizes the precious nature of gold.
Free with trial A striking 3D render illustrating a significant financial or business decline. The image features a minimalist bar chart with three decreasing blue-grey bars, symbolizing a negative trend or falling performance. A prominent, jagged red arrow sharply points downwards across the chart, emphatically conveying concepts of loss, recession, crisis, or market downturn. Set against a vibrant yellow background, this clean and modern graphic is ideal for presentations, reports, articles, or educational materials discussing economic challenges, poor statistics, or business risks. Data analysis decrease illustrations Financial Decline Bar Chart with Red Down Arrow. A striking 3D render illustrating a significant financial or business decline. The image features a minimalist bar chart with three decreasing blue-grey bars, symbolizing a negative trend or falling performance. A prominent, jagged red arrow sharply points downwards across the chart, emphatically conveying concepts of loss, recession, crisis, or market downturn. Set against a vibrant yellow background, this clean and modern graphic is ideal for presentations, reports, articles, or educational materials discussing economic challenges, poor statistics, or business risks.
Free with trial Modern Technology and Home Finance Concept with House Icon and Percentage Symbols on Laptop Keyboard in Soft Focus Background Sigmoid. Data analysis decrease illustrations A person interacts with a laptop, showcasing a digital house icon and percentage symbols, representing concepts in home. Modern Technology and Home Finance Concept with House Icon and Percentage Symbols on Laptop Keyboard in Soft Focus Background Sigmoid
Free with trial A stark red arrow dramatically descends across a series of blue bars, illustrating a significant downward trend. Data analysis decrease illustrations Red arrow shows sharp decline on blue bar graph. A stark red arrow dramatically descends across a series of blue bars, illustrating a significant downward trend
Free with trial Businessman in suit drawing a downward trending graph with the word RISK Clear details and vibrant colors enha. Data analysis decrease illustrations Businessman drawing a downward trending graph with the word RISK risk chart. Businessman in suit drawing a downward trending graph with the word RISK Clear details and vibrant colors enha
Free with trial Black and white line graph comparing nominal and real return over time with axes labeled. Data analysis decrease illustrations Black and white line graph showing nominal and real return over time chart nominal return. Black and white line graph comparing nominal and real return over time with axes labeled
Free with trial This abstract image features a vibrant candlestick chart, common in financial trading visualizations. The chart is overlaid on a blurred background of colorful circles, adding to its abstract aesthetic. Below the chart are vertical bars of varying heights and colors. This image was generated by AI. Data analysis decrease illustrations Candlestick Chart Abstract. This abstract image features a vibrant candlestick chart, common in financial trading visualizations. The chart is overlaid on a blurred background of colorful circles, adding to its abstract aesthetic. Below the chart are vertical bars of varying heights and colors. This image was generated by AI.
Free with trial A 3D rendered bar chart with bars in red, yellow, green, and blue, arranged in descending order of height. A thick black arrow curves downwards from the top left, crossing over the bars and pointing towards the bottom right, indicating a downward trend or decline. The image is set against a clean, white background. Data analysis decrease illustrations Colorful Bar Chart Showing Downward Trend with Black Arrow on White Background graph. A 3D rendered bar chart with bars in red, yellow, green, and blue, arranged in descending order of height. A thick black arrow curves downwards from the top left, crossing over the bars and pointing towards the bottom right, indicating a downward trend or decline. The image is set against a clean, white background
Free with trial Analyze the crash in the stock market crash. Learn from investment failure mistakes. Assess the damage from the business sector. Experts find the cause of the stock chart fall. Data analysis decrease vectors Analyze the crash in the stock market crash. Learn from investment failure mistakes. Assess the damage from the business
Free with trial A minimalist and clean line art illustration of a graph depicting a downward trend, symbolizing economic decline, failure, or a recession in business. Data analysis decrease vectors Simple Outline Falling Graph Line Chart Economic Recession Business Icon. A minimalist and clean line art illustration of a graph depicting a downward trend, symbolizing economic decline, failure, or a recession in business.
Free with trial A stark red arrow graphically depicts a significant downward trend on a white chart, symbolizing financial loss or market crash. Data analysis decrease illustrations Red arrow graph showing sharp financial decline. A stark red arrow graphically depicts a significant downward trend on a white chart, symbolizing financial loss or market crash
Free with trial Black bar graph with downward arrows indicating a decline or loss on a white background. Data analysis decrease illustrations Falling bar graph with downward arrows indicating decline or loss chart. Black bar graph with downward arrows indicating a decline or loss on a white background
Free with trial Business Team Analyzing Cost Management Strategies Using Digital Technology in a Modern Workspace Environment Quark. Data analysis decrease illustrations Business Team Analyzing Cost Management Strategies Using Digital Technology in a Modern Workspace Environment Quark
Free with trial A close-up view of black financial and business chart icons arranged in a grid on a light background. Data analysis decrease illustrations Close-up of financial and business chart icons on a grid finance charts. A close-up view of black financial and business chart icons arranged in a grid on a light background
Free with trial Displaying purple world map with rising red bars, red line graph on slide with green grid. Infographic, analytics, digital, technology, finance, strategic, modern. Data analysis decrease illustrations Displaying purple world map with rising red bars, red line graph on slide with green grid
Free with trial Black icon of a falling graph with a downward arrow on a white background. Clear details and vibrant colors en. Data analysis decrease illustrations Falling Graph with Downward Arrow Icon on White Background downward trend decline. Black icon of a falling graph with a downward arrow on a white background. Clear details and vibrant colors en
Free with trial This image showcases three gold bars resting on a screen displaying a dynamic stock market chart, generated by AI. The scene is visually striking, suggesting the relationship between gold as an investment and market trends. The high-resolution image is perfect for illustrating financial articles o. Data analysis decrease illustrations Gold Bars & Stock Market Chart. This image showcases three gold bars resting on a screen displaying a dynamic stock market chart, generated by AI. The scene is visually striking, suggesting the relationship between gold as an investment and market trends. The high-resolution image is perfect for illustrating financial articles o
Free with trial Business professional analyzing cost reduction strategies with digital interface, graphic icons, and keyboard input in modern office environment Quark. Data analysis decrease illustrations Business professional analyzing cost reduction strategies with digital interface, graphic icons, and keyboard input in
Free with trial Hands Collaborating to Represent Efficiency in Artificial Intelligence with Rising Quality and Falling Cost Graphs in a Modern Business Concept Gluon. Data analysis decrease illustrations Hands Collaborating to Represent Efficiency in Artificial Intelligence with Rising Quality and Falling Cost Graphs in a
Free with trial Downward arrow, swirling line with blue concentric circles, and percentage symbol suggest falling rates. Ideal for finance, economy, interest, discount, marketing statistics cost management. Flat. Data analysis decrease vectors Declining Percentage Rate Represented by Downward Arrow and Percentage Symbol. Downward arrow, swirling line with blue concentric circles, and percentage symbol suggest falling rates. Ideal for finance, economy, interest, discount, marketing statistics cost management. Flat
Free with trial Illustration of a business activities. Data analysis decrease vectors Illustration of a business activities
Free with trial A black curve graph depicts a revenue slowdown on a white background. Clear details and vibrant colors enhance. Data analysis decrease illustrations Black curve graph showing revenue slowdown on white background chart line. A black curve graph depicts a revenue slowdown on a white background. Clear details and vibrant colors enhance
Free with trial Three black bars with downward arrows indicating decline on white background Clear details and vibrant colors. Data analysis decrease illustrations Three black bars with downward arrows on white background bar chart graph. Three black bars with downward arrows indicating decline on white background Clear details and vibrant colors
Free with trial Downward arrow next to a small storefront under a cloud. Ideal for business decline, e-commerce, economic downturn, retail impact, cloud-based solutions, analytics, simple flat metaphor. Data analysis decrease vectors Downward Arrow Beside Small Storefront Under Cloud Highlighting Business or Economic Trends. Downward arrow next to a small storefront under a cloud. Ideal for business decline, e-commerce, economic downturn, retail impact, cloud-based solutions, analytics, simple flat metaphor
Free with trial Three wooden blocks arranged in a step-like formation on a wooden surface, with an upward-pointing arrow on the middle block and a downward-pointing arrow on the top block, representing concepts of growth, decline, and change in business or finance. Data analysis decrease illustrations Wooden blocks with up and down arrows symbolizing business growth and decline. Three wooden blocks arranged in a step-like formation on a wooden surface, with an upward-pointing arrow on the middle block and a downward-pointing arrow on the top block, representing concepts of growth, decline, and change in business or finance
Free with trial Three stacks of coins, each topped with a wooden block featuring a downward-pointing arrow, illustrating a concept of financial loss, economic downturn, or decreasing value against a blue background. Data analysis decrease illustrations Decreasing stacks of coins with down arrows symbolizing financial decline. Three stacks of coins, each topped with a wooden block featuring a downward-pointing arrow, illustrating a concept of financial loss, economic downturn, or decreasing value against a blue background
Free with trial Business Professional Highlighting Cost Management Strategies on a Digital Tablet with Visual Diagram and Infographic Elements Quark. Data analysis decrease illustrations Business Professional Highlighting Cost Management Strategies on a Digital Tablet with Visual Diagram and Infographic
Free with trial A businessperson in a blue suit holds a glowing orb with upward and downward arrows labeled and cost. Data analysis decrease illustrations Businessperson holding glowing orb with and cost arrows above laptop hand. A businessperson in a blue suit holds a glowing orb with upward and downward arrows labeled and cost.
Free with trial A close-up shot of a Bitcoin coin against a background of a falling graph on a dark, moody background. Illustrates market downturn and financial loss. Image is generated using AI. Data analysis decrease illustrations Bitcoin Coin With Falling Chart. A close-up shot of a Bitcoin coin against a background of a falling graph on a dark, moody background. Illustrates market downturn and financial loss. Image is generated using AI
Free with trial A conceptual image featuring a series of ascending wooden blocks, with a green upward arrow on a lower block and a red downward arrow on a higher block, symbolizing the fluctuating nature of business, market trends, and financial performance. The image conveys concepts of success, failure, progress, and setback in a clear and concise manner. Data analysis decrease illustrations Wooden Blocks with Up and Down Arrows Representing Business Growth and Decline. A conceptual image featuring a series of ascending wooden blocks, with a green upward arrow on a lower block and a red downward arrow on a higher block, symbolizing the fluctuating nature of business, market trends, and financial performance. The image conveys concepts of success, failure, progress, and setback in a clear and concise manner
Free with trial A visual representation of a business or financial metric showing a significant decline, depicted by a series of blue bars and a descending red arrow. Data analysis decrease illustrations Bar chart with red arrow indicating a downward trend. A visual representation of a business or financial metric showing a significant decline, depicted by a series of blue bars and a descending red arrow
Free with trial Two cardboard houses, one larger than the other, depict percentage increases in house prices, generated by AI. This visualization effectively communicates the impact of fluctuating real estate market values. Data analysis decrease illustrations House Price Percentage Increase. Two cardboard houses, one larger than the other, depict percentage increases in house prices, generated by AI. This visualization effectively communicates the impact of fluctuating real estate market values.
Free with trial Strategic Business Meeting on Artificial Intelligence Implementation with Quality and Cost Considerations for Enhanced Decision-Making in Modern Organizations Gluon. Data analysis decrease illustrations Strategic Business Meeting on Artificial Intelligence Implementation with Quality and Cost Considerations for Enhanced
Free with trial Set of six black business charts icons showing growth and decline trends with arrows and bars in vector style clear and simple design calm. Generative AI. Data analysis decrease vectors Business growth and decline charts arrows statistics bar graph icons vector illustration. Set of six black business charts icons showing growth and decline trends with arrows and bars in vector style clear and simple design calm. Generative AI
Free with trial A visual representation of declining trends, depicted by a graph with red and blue lines moving downwards, symbolizing a negative trajectory or market shift. Data analysis decrease illustrations Downward trending graph with word trends. A visual representation of declining trends, depicted by a graph with red and blue lines moving downwards, symbolizing a negative trajectory or market shift
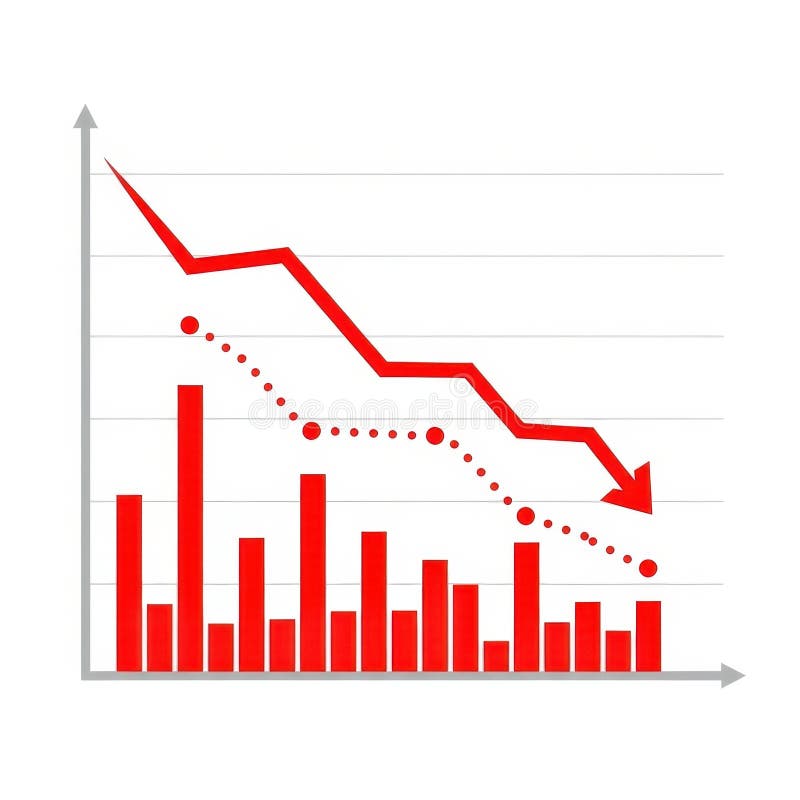
Free with trial A visual representation of negative financial performance. It features red bars and a red line graph showing a downward trend, accompanied by a dotted line indicating a similar pattern. Data analysis decrease illustrations Red downward trending graph with bars and dotted line. A visual representation of negative financial performance. It features red bars and a red line graph showing a downward trend, accompanied by a dotted line indicating a similar pattern
Free with trial Robotic Hand Interacting with Cost Reduction Concept on Digital Screen in a High-Tech Cityscape Background for Business Applications Quark. Data analysis decrease illustrations Robotic Hand Interacting with Cost Reduction Concept on Digital Screen in a High-Tech Cityscape Background for Business
Free with trial This striking image depicts a global oil market decline, featuring barrels and a red arrow, symbolizing economic downturn and financial crisis. Data analysis decrease illustrations Global oil market decline represented by black barrels and red downward arrow over a world map in dark background. This striking image depicts a global oil market decline, featuring barrels and a red arrow, symbolizing economic downturn and financial crisis
Free with trial This image showcases gleaming gold bars arranged on a digital screen displaying a dynamic stock market chart, generated by AI. The juxtaposition highlights the relationship between precious metals and financial markets, suggesting investment opportunities and market volatility. The image is visual. Data analysis decrease illustrations Gold Bullion & Stock Market Chart. This image showcases gleaming gold bars arranged on a digital screen displaying a dynamic stock market chart, generated by AI. The juxtaposition highlights the relationship between precious metals and financial markets, suggesting investment opportunities and market volatility. The image is visual
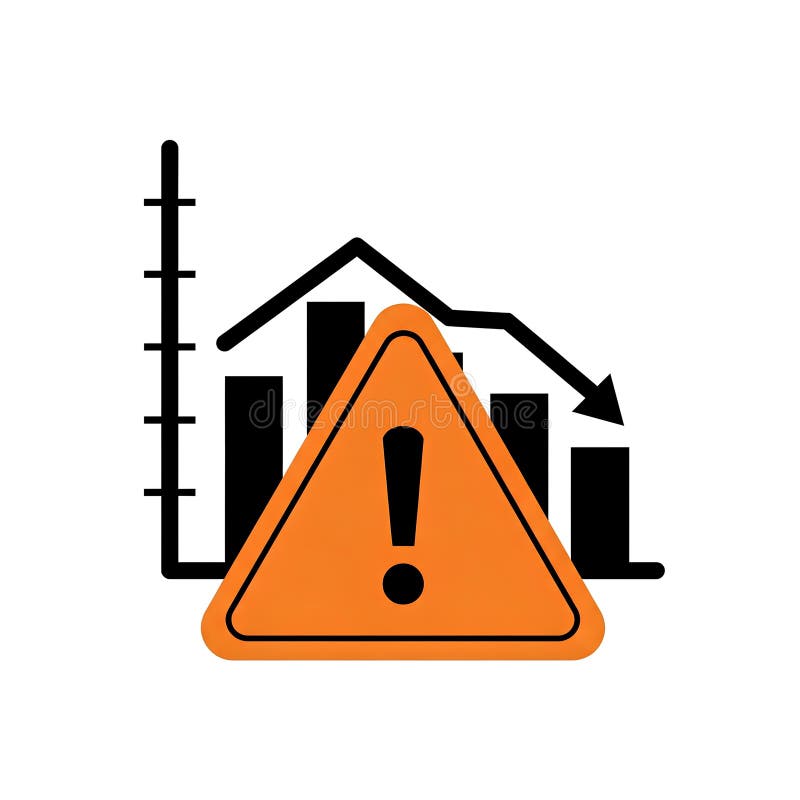
Free with trial Illustration of a downward trending graph with an orange warning sign in the foreground. The graph depicts a decline in performance or value. The warning sign highlights potential risks or negative outcomes. This image can be used to represent financial loss, economic downturn, business failure, or any situation where caution is advised. Data analysis decrease illustrations Warning Sign with Declining Graph. Illustration of a downward trending graph with an orange warning sign in the foreground. The graph depicts a decline in performance or value. The warning sign highlights potential risks or negative outcomes. This image can be used to represent financial loss, economic downturn, business failure, or any situation where caution is advised.
Free with trial 3D rendered graphic showing the word Finance in bold black letters with a green upward trending arrow above and a red downward trending arrow below, flanked by blue opposing arrows on a grid background. Data analysis decrease illustrations Finance growth upward trend with opposing arrows image. 3D rendered graphic showing the word Finance in bold black letters with a green upward trending arrow above and a red downward trending arrow below, flanked by blue opposing arrows on a grid background
Free with trial A blue bar chart shows a downward trend indicated by a sharp red arrow. Isolated on a transparent background. Data analysis decrease vectors Blue bar chart with red downward trending arrow isolated on a transparent background. A blue bar chart shows a downward trend indicated by a sharp red arrow. Isolated on a transparent background
Free with trial A digital illustration representing economic concepts of supply and demand. On the left, a blue arrow points upwards labeled "DEMAND" with a crowd of stylized figures. On the right, a red arrow points downwards labeled "SUPPLY" with another crowd and various business-related icons. The two sides are separated by a glowing energy effect on a dark, futuristic background. Data analysis decrease illustrations Conceptual illustration of supply and demand with contrasting arrows and crowds. A digital illustration representing economic concepts of supply and demand. On the left, a blue arrow points upwards labeled "DEMAND" with a crowd of stylized figures. On the right, a red arrow points downwards labeled "SUPPLY" with another crowd and various business-related icons. The two sides are separated by a glowing energy effect on a dark, futuristic background
Free with trial Orange arrow pointing downward indicating a financial decline in a factory setting. Concept of economic downturn or falling production in industry. Data analysis decrease illustrations Orange arrow pointing downward indicating a financial decline in a factory setting
Free with trial Paper cutouts Upward red arrow, zigzag green arrow & downward red arrow on pastel background. Data analysis decrease illustrations Red and green arrows up and. Paper cutouts Upward red arrow, zigzag green arrow & downward red arrow on pastel background
Free with trial A series of seven golden, metallic bars are arranged in a descending order, forming a bar chart that illustrates a significant decline. The bars are highly reflective, catching the light and emphasizing their three-dimensional form. The chart is presented in isolation against a pure white background, making the visual representation of a downward trend clear and impactful. Data analysis decrease illustrations Golden Bar Chart Showing a Steep Decline on White Background graph statistics. A series of seven golden, metallic bars are arranged in a descending order, forming a bar chart that illustrates a significant decline. The bars are highly reflective, catching the light and emphasizing their three-dimensional form. The chart is presented in isolation against a pure white background, making the visual representation of a downward trend clear and impactful
Free with trial A silver laptop sits on a light brown wooden surface. Its screen displays a dark background with a grid pattern and a prominent red line graph sharply declining from left to right. The red line is brightly lit, creating a strong visual contrast against the dark background. The overall mood is one of concern or warning, suggesting a negative trend or decline. The image is clean and simple, focusing, generated by AI. Data analysis decrease illustrations Laptop Screen Showing Red Downward Trend Graph computer. A silver laptop sits on a light brown wooden surface. Its screen displays a dark background with a grid pattern and a prominent red line graph sharply declining from left to right. The red line is brightly lit, creating a strong visual contrast against the dark background. The overall mood is one of concern or warning, suggesting a negative trend or decline. The image is clean and simple, focusing, generated by AI.
Free with trial Futuristic Robot Hand Representing Cost Reduction Strategies in Digital Business Environment with Graphs and Icons Quark. Data analysis decrease illustrations Futuristic Robot Hand Representing Cost Reduction Strategies in Digital Business Environment with Graphs and Icons Quark
Free with trial A blue bar and line graph showing upward financial trends against a backdrop of a world map, symbolizing global economic growth and market expansion. Data analysis decrease illustrations Global business growth chart with world map background. A blue bar and line graph showing upward financial trends against a backdrop of a world map, symbolizing global economic growth and market expansion
Free with trial 3D red bar graph with downward arrows indicating decline. Suitable for diverse creative needs. Data analysis decrease illustrations 3D red bar graph with downward arrows indicating decline.
Free with trial Downward trend line on a graph, sad face emoticon, verified user profile. Ideal for analytics, decline monitoring, user feedback, quality control, performance review, error tracking simple flat. Data analysis decrease vectors Declining Performance Chart with Sad Face and User Profile Checkmark. Downward trend line on a graph, sad face emoticon, verified user profile. Ideal for analytics, decline monitoring, user feedback, quality control, performance review, error tracking simple flat
Free with trial A black jagged line graph with an arrow pointing downwards on a white background. Clear details and vibrant co. Data analysis decrease illustrations Black descending jagged line graph with arrow indicating downward trend chart. A black jagged line graph with an arrow pointing downwards on a white background. Clear details and vibrant co
Free with trial A person in a suit uses a stylus on a tablet displaying a quality cost checklist with upward and downward arrows. Data analysis decrease illustrations Businessman using stylus on tablet with quality cost checklist and award image. A person in a suit uses a stylus on a tablet displaying a quality cost checklist with upward and downward arrows
Free with trial Economy downturn concept showing declining bar graph with red arrow, background,. Data analysis decrease illustrations Economy downturn concept showing declining bar graph with red arrow, background
Free with trial Sixteen simple yellow candlestick charts with black lines on a white background, arranged in a four by four grid. Data analysis decrease vectors Vector illustration of sixteen yellow candlestick charts. Sixteen simple yellow candlestick charts with black lines on a white background, arranged in a four by four grid
Free with trial Abstract blue up and down arrow icons illustration set minimalist molecular grid design isolated on white background for technology business growth data analysis and finance ui ux. Data analysis decrease vectors Abstract blue up and down arrow icons illustration set minimalist molecular grid design isolated on white background for. Technology business growth data. Abstract blue up and down arrow icons illustration set minimalist molecular grid design isolated on white background for technology business growth data analysis and finance ui ux
Free with trial Ai-Generated. Professional chart stock image featuring set of black and white minimalist chart and graph line icons. Data analysis decrease vectors Set of black and white minimalist chart and graph line icons
Free with trial A stark red arrow zigzags downwards, powerfully representing economic downturns, market crashes, and negative financial trends. This visual signifies a crisis or significant drop. Data analysis decrease illustrations Red downward arrow symbolizing financial decline and economic recession trends. A stark red arrow zigzags downwards, powerfully representing economic downturns, market crashes, and negative financial trends. This visual signifies a crisis or significant drop
Free with trial Worried man holding a red downward pointing arrow represents financial decline or business failure. Flat vector illustration isolated on white background. Data analysis decrease illustrations Worried man holding a red downward pointing arrow represents financial decline or business failure
Free with trial A graph with a curved line labeled "SOFT LANDING" shows a gradual decline on white. Data analysis decrease illustrations Graph showing a soft landing curve with text on white background chart decline. A graph with a curved line labeled "SOFT LANDING" shows a gradual decline on white
Free with trial Bar chart with six vertical blue bars of descending height, indicating a negative trend. A jagged red arrow slants downward from left to right across the bars, emphasizing the decrease. No specific location is provided. Data analysis decrease vectors Financial bar chart showing downward trend with red arrow. Bar chart with six vertical blue bars of descending height, indicating a negative trend. A jagged red arrow slants downward from left to right across the bars, emphasizing the decrease. No specific location is provided.