Free with trial Red sad face beside a line graph showing a downward trend and a bar graph. Ideal for business loss, economic decline, performance issues, challenges, setbacks, analytics, trends. Simple flat metaphor. Data analysis decrease vectors Declining Chart with Sad Face and Bar Graph Representing Negative Trend and Challenges. Red sad face beside a line graph showing a downward trend and a bar graph. Ideal for business loss, economic decline, performance issues, challenges, setbacks, analytics, trends. Simple flat metaphor
Free with trial A man holds a sign displaying a sharply declining graph, symbolizing economic hardship. The image, generated by AI, is a powerful visual representation of market instability and financial distress. It's perfect for illustrating articles or presentations related to recession, financial crisis, or ma. Data analysis decrease illustrations Declining Graph: Economic Downturn. A man holds a sign displaying a sharply declining graph, symbolizing economic hardship. The image, generated by AI, is a powerful visual representation of market instability and financial distress. It's perfect for illustrating articles or presentations related to recession, financial crisis, or ma
Free with trial Conceptual image representing financial growth and investment. The scene features a golden percentage coin, stacks of coins, and a money bag against a backdrop of financial charts and graphs. The composition suggests themes of investment opportunities, interest rates, and economic prosperity. Suitable for illustrating financial articles, investment strategies, and economic forecasts. Data analysis decrease illustrations Financial Growth and Investment Concept. Conceptual image representing financial growth and investment. The scene features a golden percentage coin, stacks of coins, and a money bag against a backdrop of financial charts and graphs. The composition suggests themes of investment opportunities, interest rates, and economic prosperity. Suitable for illustrating financial articles, investment strategies, and economic forecasts.
Free with trial A digital illustration of a declining line graph with a large downward arrow and a coin at the bottom, representing financial decline or market loss, suitable for economic and business contexts. Data analysis decrease illustrations Downward Trending Graph with Falling Line Chart and Coin Illustration. A digital illustration of a declining line graph with a large downward arrow and a coin at the bottom, representing financial decline or market loss, suitable for economic and business contexts
Free with trial This image showcases a bar graph depicting rising factory production, generated by AI, superimposed on a blurred background of a bustling industrial facility. The upward trend suggests growth and efficiency in the manufacturing process, highlighting the positive impact of modern technology. Data analysis decrease illustrations Factory Production Increase. This image showcases a bar graph depicting rising factory production, generated by AI, superimposed on a blurred background of a bustling industrial facility. The upward trend suggests growth and efficiency in the manufacturing process, highlighting the positive impact of modern technology.
Free with trial A graphic illustrating declining gas prices, featuring a fuel pump and a downward trending red line graph, isolated on a white background. Data analysis decrease illustrations Falling gas prices graph with fuel pump isolated on white background. A graphic illustrating declining gas prices, featuring a fuel pump and a downward trending red line graph, isolated on a white background
Free with trial Thermometer indicating 30 percent, symbolizing progress, achievement, temperature measurement, or goal completion within a specific range. Data analysis decrease vectors Thermometer indicating 30 percent, symbolizing progress, achievement, temperature measurement, or goal completion within
Free with trial Outline financial tax icons set featuring a book, magnifying glass, money, documents, and charts for financial accounting and business concept design. Data analysis decrease vectors Outline financial tax icons set featuring a book, magnifying glass, money, documents, and charts for financial
Free with trial This conceptual image depicts an industrial factory with a declining graph, symbolizing economic downturn, industrial decline, or environmental impact. The paper cutout style adds a unique visual appeal. The image can be used to represent concepts related to business, finance, economics, manufacturing, environmental concerns, and the impact of industrial activity. It is suitable for presentations, reports, articles, and educational materials. Data analysis decrease illustrations Industrial Decline and Economic Downturn Concept. This conceptual image depicts an industrial factory with a declining graph, symbolizing economic downturn, industrial decline, or environmental impact. The paper cutout style adds a unique visual appeal. The image can be used to represent concepts related to business, finance, economics, manufacturing, environmental concerns, and the impact of industrial activity. It is suitable for presentations, reports, articles, and educational materials.
Free with trial A simple black and white illustration of a bar chart and a line graph showing business growth trends, isolated on a white background. Data analysis decrease vectors Business growth bar chart and line graph isolated on white background. A simple black and white illustration of a bar chart and a line graph showing business growth trends, isolated on a white background
Free with trial Loss Arrow 3D Icon, Isolated on White Background. Data analysis decrease illustrations Loss Arrow 3D Icon
Free with trial Growth and decline arrow graph icon. Up and down arrows symbol illustration. Data analysis decrease vectors Growth and decline arrow graph icon. Up and down arrows symbol
Free with trial Week over week on white paper background. Data analysis decrease illustrations Week over week on white paper
Free with trial Year over year on white paper background. Data analysis decrease illustrations Year over year on white paper
Free with trial This image displays a man holding house icons with financial symbols above, illustrating real estate investment. Perfect for conveying property market, financial growth, and home ownership concepts. Ideal for finance and investment related projects. Data analysis decrease illustrations Real estate investment concept with houses and financial symbols on hand. This image displays a man holding house icons with financial symbols above, illustrating real estate investment. Perfect for conveying property market, financial growth, and home ownership concepts. Ideal for finance and investment related projects
Free with trial A visual representation of opposing forces, illustrating concepts such as growth versus decline, positive versus negative trends, or upward and downward movement in various contexts like finance or pe. Data analysis decrease illustrations Red down arrow and green up arrow isolated on white background. A visual representation of opposing forces, illustrating concepts such as growth versus decline, positive versus negative trends, or upward and downward movement in various contexts like finance or pe
Free with trial This image showcases a collection of finance and government icons, generated by AI, perfect for use in presentations, reports, or websites related to business, economics, or politics. The stylized monochrome design provides a professional and consistent aesthetic. Data analysis decrease illustrations Finance and Government Icons
Free with trial A visual representation of a declining financial trend, depicted by a bar chart with a red arrow indicating a downward movement, symbolizing loss or poor performance. Data analysis decrease illustrations Bar chart with downward trending red arrow isolated on white background. A visual representation of a declining financial trend, depicted by a bar chart with a red arrow indicating a downward movement, symbolizing loss or poor performance
Free with trial Illustration of a smartphone displaying financial charts and a stack of gold coins with dollar signs. Arrows circulate around the phone, suggesting a cycle of investment and growth. The image represents mobile banking, online trading, and the potential for financial success through digital platforms. Data analysis decrease illustrations Mobile Investment and Financial Growth. Illustration of a smartphone displaying financial charts and a stack of gold coins with dollar signs. Arrows circulate around the phone, suggesting a cycle of investment and growth. The image represents mobile banking, online trading, and the potential for financial success through digital platforms.
Free with trial A man is pointing at a stock chart with a sell indicator and a downward arrow, indicating a potential downward trend in the market. Data analysis decrease vectors Man pointing at sell chart with downward arrow indicator. a man is pointing at a stock chart with a sell indicator and a downward arrow, indicating a potential downward trend in the market.
Free with trial A financial graph depicting a downward trend with a red arrow, blue bar chart, and white line graph on a dark blue grid background. Ideal for illustrating market decline, revenue loss, or negative performance in business, finance, and economic presentations. Data analysis decrease illustrations Declining Financial Graph Red Arrow and Bar Chart on Dark Grid Background. A financial graph depicting a downward trend with a red arrow, blue bar chart, and white line graph on a dark blue grid background. Ideal for illustrating market decline, revenue loss, or negative performance in business, finance, and economic presentations.
Free with trial A colorful graph with the words Net Income written below it. The graph is made up of many different colored lines and dots. Data analysis decrease illustrations A colorful graph with the words Net Income written below it
Free with trial Bar graph displays a colorful representation of business growth and financial success with bars increasing in height and vibrant colors on a reflective surface indicating positive trends. Data analysis decrease illustrations Colorful bar graph showing growth and success in business and finance on a reflective surface. Bar graph displays a colorful representation of business growth and financial success with bars increasing in height and vibrant colors on a reflective surface indicating positive trends.
Free with trial A 3D render shows a vibrant, pastel-colored bar chart displaying a decreasing trend with blue, yellow, and lavender bars on a transparent background. Data analysis decrease vectors Downward trendy pastel bar chart illustration on transparent background. A 3D render shows a vibrant, pastel-colored bar chart displaying a decreasing trend with blue, yellow, and lavender bars on a transparent background.
Free with trial A bar graph illustrates a decreasing trend in financial performance, indicated by a red arrow and a dollar symbol. Data analysis decrease illustrations Bar chart showing financial decline with downward trend and dollar sign. A bar graph illustrates a decreasing trend in financial performance, indicated by a red arrow and a dollar symbol
Free with trial A golden house miniature sits on a smartphone screen displaying stock market charts, surrounded by stacks of gold coins. This image represents the concept of investing in real estate through mobile apps and online platforms, highlighting the potential for financial growth and digital investment strategies in the property market. Data analysis decrease illustrations Real Estate Investment on Mobile. A golden house miniature sits on a smartphone screen displaying stock market charts, surrounded by stacks of gold coins. This image represents the concept of investing in real estate through mobile apps and online platforms, highlighting the potential for financial growth and digital investment strategies in the property market.
Free with trial An illustration of a red downward trending arrow icon in a frame is set against a soft, pastel pink backdrop. Data analysis decrease illustrations Downward Trend Arrow Icon on Pink Background Representing Financial Loss. An illustration of a red downward trending arrow icon in a frame is set against a soft, pastel pink backdrop.
Free with trial White Bar Graph Decreasing on Light Blue Background. Data analysis decrease illustrations White Bar Graph Decreasing on Light Blue Background
Free with trial Percent word block on white background. Data analysis decrease illustrations Percent word block on white
Free with trial Annual growth rate on white paper background. Data analysis decrease illustrations Annual growth rate on white paper
Free with trial A black bar chart showing a downward trend with an arrow on a white background. Clear details and vibrant colo. Data analysis decrease illustrations Black downward trending bar chart with arrow on white background graph. A black bar chart showing a downward trend with an arrow on a white background. Clear details and vibrant colo
Free with trial This image features two prominent arrows pointing upwards one green and one red symbolizing contrasting financial performance or progress in different areas. Data analysis decrease illustrations Two upward arrows green and red showing growth progress and contrasting trends. This image features two prominent arrows pointing upwards one green and one red symbolizing contrasting financial performance or progress in different areas
Free with trial Business performance decline icon vector. Productivity drop and process efficiency loss symbol. Data analysis decrease vectors Business performance decline icon. Productivity drop and process efficiency loss symbol
Free with trial Wooden toy houses illustrate real estate market trends. Created with the help of Generative AI tools. Data analysis decrease illustrations Wooden toy houses illustrate real estate market trends.
Free with trial A stark red bar graph illustrates a sharp downward trend with a prominent arrow, visually representing financial decline, economic recession, or business failure. Data analysis decrease illustrations Red bar graph with downward arrow isolated on white background. A stark red bar graph illustrates a sharp downward trend with a prominent arrow, visually representing financial decline, economic recession, or business failure
Free with trial A bar chart showing a steady decline with a red downward arrow, symbolizing financial loss, economic downturn, business decline, or negative performance trends. Data analysis decrease illustrations Economic Downtrend Bar Chart for Business concept 3d Rendering. A bar chart showing a steady decline with a red downward arrow, symbolizing financial loss, economic downturn, business decline, or negative performance trends
Free with trial A bar chart showing a steady decline with a red downward arrow, symbolizing financial loss, economic downturn, business decline, or negative performance trends. Data analysis decrease illustrations Economic Downtrend Bar Chart for Business concept 3d Rendering. A bar chart showing a steady decline with a red downward arrow, symbolizing financial loss, economic downturn, business decline, or negative performance trends
Free with trial A bar chart showing a steady decline with a red downward arrow, symbolizing financial loss, economic downturn, business decline, or negative performance trends. Data analysis decrease illustrations Economic Downtrend Bar Chart for Business concept 3d Rendering. A bar chart showing a steady decline with a red downward arrow, symbolizing financial loss, economic downturn, business decline, or negative performance trends
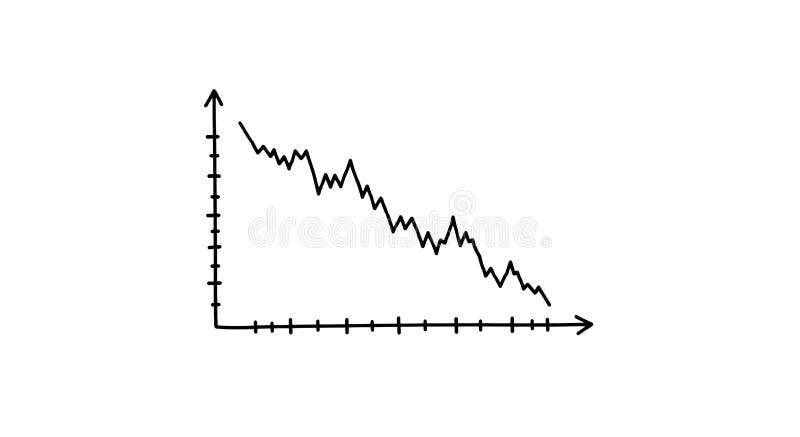
Free with trial A simple, hand-drawn line graph displayed on a plain white background illustrates a notable downward trend. The black line demonstrates decreasing values over time along the defined axes. Data analysis decrease vectors Descending line graph displays a downward trend, isolated on white background. A simple, hand-drawn line graph displayed on a plain white background illustrates a notable downward trend. The black line demonstrates decreasing values over time along the defined axes.
Free with trial A shiny red arrow curves downwards, indicating a downward trend or negative growth. This image visually represents concepts like financial decline market crash or falling stock prices. Data analysis decrease illustrations Red arrow points downward showing decline trend and negative growth concept. A shiny red arrow curves downwards, indicating a downward trend or negative growth. This image visually represents concepts like financial decline market crash or falling stock prices
Free with trial An icon representing financial downturn, featuring a stack of coins and a line graph with a downward arrow, indicating a decrease in value or performance. This visual signifies economic hardship or in. Data analysis decrease vectors Graph showing financial decline with coins isolated on transparent background. An icon representing financial downturn, featuring a stack of coins and a line graph with a downward arrow, indicating a decrease in value or performance. This visual signifies economic hardship or in
Free with trial This whiteboard displays hand-drawn charts illustrating a sharp market decline. The red lines, representing a dramatic downturn, are prominently featured, alongside other less defined financial graphs. This image was generated by AI for illustrative purposes. Data analysis decrease illustrations Red Ink Market Crash Whiteboard. This whiteboard displays hand-drawn charts illustrating a sharp market decline. The red lines, representing a dramatic downturn, are prominently featured, alongside other less defined financial graphs. This image was generated by AI for illustrative purposes.
Free with trial The image shows a hand holding holographic arrows pointing up and down, representing growth and decline, with percentages shown. It symbolizes business trends. Data analysis decrease illustrations A hand holding holographic arrows pointing up and down with percentages shown. The image shows a hand holding holographic arrows pointing up and down, representing growth and decline, with percentages shown. It symbolizes business trends
Free with trial A sharp, transparent glass arrow pointing downwards, surrounded by glistening water droplets, signifying a downward trend or decline in a conceptual manner. Data analysis decrease illustrations Transparent arrow pointing downwards, isolated on white background background copy space. A sharp, transparent glass arrow pointing downwards, surrounded by glistening water droplets, signifying a downward trend or decline in a conceptual manner.
Free with trial A red grid background displays a financial chart with alternating green and white candlesticks and a prominent white arrow pointing downwards. Data analysis decrease illustrations Red financial chart with green and white candlesticks showing downward trend. A red grid background displays a financial chart with alternating green and white candlesticks and a prominent white arrow pointing downwards
Free with trial A 3D bar chart with a red arrow indicating a significant downward trend, symbolizing financial loss or economic decline. Isolated on a white background. Data analysis decrease illustrations Bar chart showing a downward trend isolated on white background. A 3D bar chart with a red arrow indicating a significant downward trend, symbolizing financial loss or economic decline. Isolated on a white background
Free with trial Bar chart showing a steep downward trend with a large arrow indicating decline. Data analysis decrease vectors Bar chart showing a steep downward trend with a large arrow indicating decline
Free with trial This 3D rendering showcases stacks of Bitcoin-like coins alongside a rising bar graph, illustrating cryptocurrency market growth. The image is generated by AI and ideal for illustrating financial concepts related to digital currencies. Data analysis decrease illustrations Cryptocurrency Growth Chart. This 3D rendering showcases stacks of Bitcoin-like coins alongside a rising bar graph, illustrating cryptocurrency market growth. The image is generated by AI and ideal for illustrating financial concepts related to digital currencies.
Free with trial View of Graphs showing declining CO₂ emissions. Data analysis decrease illustrations Graphs showing declining CO₂ emissions
Free with trial A cartoon Bitcoin character is presenting a chart showing cryptocurrency market trends. The image is suitable for illustrating financial news, investment advice, or educational materials about Bitcoin and the crypto market. Data analysis decrease illustrations Bitcoin Cartoon Character Explaining Crypto Market Trends. A cartoon Bitcoin character is presenting a chart showing cryptocurrency market trends. The image is suitable for illustrating financial news, investment advice, or educational materials about Bitcoin and the crypto market.
Free with trial Doodle style bar chart with a downward trending arrow indicating financial loss. Data analysis decrease vectors Doodle style bar chart with a downward trending arrow indicating financial loss
Free with trial A striking red arrow curves downward, representing economic downturn, financial loss, or a negative trend. This visual metaphor is perfect for presentations on market changes or business performance. Data analysis decrease illustrations Red downward arrow symbolizing decline and negative trend in business and finance. A striking red arrow curves downward, representing economic downturn, financial loss, or a negative trend. This visual metaphor is perfect for presentations on market changes or business performance
Free with trial Business decline, Businessman examines decreasing bar graph and chart. Data analysis decrease vectors Business decline, Businessman examines decreasing bar graph and chart
Free with trial Sad face beside declining line graph and bar chart, symbolizing setbacks. Ideal for finance, business, economy, loss, analytics, crisis performance. Simple flat metaphor. Data analysis decrease vectors Negative Trend Line and Declining Bar Chart Representing Business Loss or Financial Downturn. Sad face beside declining line graph and bar chart, symbolizing setbacks. Ideal for finance, business, economy, loss, analytics, crisis performance. Simple flat metaphor
Free with trial Falling financial chart with a sharp decline. Space for text. Data analysis decrease illustrations Falling financial chart with a sharp decline. Space for text.
Free with trial Versus prior year on white paper background. Data analysis decrease illustrations Versus prior year on white paper
Free with trial An isometric view of a bar chart with five blue bars of decreasing height, representing a downward trend. A red arrow points downwards, indicating a negative trajectory. Data analysis decrease illustrations Bar chart showing a downward trend with a red arrow isolated on white background. An isometric view of a bar chart with five blue bars of decreasing height, representing a downward trend. A red arrow points downwards, indicating a negative trajectory
Free with trial Decreasing graph icon Business chart with downward arrow Financial loss symbol. Data analysis decrease vectors Decreasing graph icon Business chart with downward arrow Financial loss symbol
Free with trial This image depicts a house with a rising stock market graph overlay on a green lawn, symbolizing growth and prosperity in the real estate and financial markets. The graph shows a mix of green and red lines, indicating fluctuations in the market, but overall trending upwards. The image conveys a sense of optimism and hope for the future. Data analysis decrease illustrations A house with a rising stock market graph overlay on a green lawn. This image depicts a house with a rising stock market graph overlay on a green lawn. This image depicts a house with a rising stock market graph overlay on a green lawn, symbolizing growth and prosperity in the real estate and financial markets. The graph shows a mix of green and red lines, indicating fluctuations in the market, but overall trending upwards. The image conveys a sense of optimism and hope for the future.
Free with trial Pyramid chart line icon. Neumorphic, Flat shadow, 3d buttons. Analytics graph sign. Market analytics symbol. Line pyramid chart icon. Social media icons. Vector. Data analysis decrease vectors Pyramid chart line icon. Analytics graph sign. Neumorphic buttons. Vector. Pyramid chart line icon. Neumorphic, Flat shadow, 3d buttons. Analytics graph sign. Market analytics symbol. Line pyramid chart icon. Social media icons. Vector
Free with trial This image shows two bar graphs. One shows an upward trend with an arrow pointing up. The other shows a downward trend with an arrow pointing down. Black and white. Data analysis decrease illustrations Black and white illustration showing upward and downward trending bar graphs with arrows pointing up down. This image shows two bar graphs. One shows an upward trend with an arrow pointing up. The other shows a downward trend with an arrow pointing down. Black and white.
Free with trial A neon glowing graph with blue bars and pink zigzag arrow showing fluctuating growth on black background. Generative AI. Data analysis decrease illustrations Neon glowing graph with blue bars and pink zigzag arrow showing fluctuating growth on black background
Free with trial This chart depicts a significant downward trend in stock value over a period. The red line graphically represents the declining prices, indicating a bearish market or a stock facing substantial losses. Data analysis decrease illustrations Stock market downturn visualized red line chart showing price decline over time. This chart depicts a significant downward trend in stock value over a period. The red line graphically represents the declining prices, indicating a bearish market or a stock facing substantial losses
Free with trial Graphic element displays contrasting financial indicators featuring a jagged green arrow pointing up signifying growth alongside a similar red arrow pointing sharply down representing decline or market correction. Data analysis decrease vectors Graphic representation contrasting upward trending market growth with sharp downward trending financial decline. Graphic element displays contrasting financial indicators featuring a jagged green arrow pointing up signifying growth alongside a similar red arrow pointing sharply down representing decline or market correction
Free with trial Falling bar chart with up and right arrows illustrating declining business trends. Data analysis decrease vectors Falling bar chart with up and right arrows illustrating declining business trends
Free with trial Bar chart collapse icon with downward arrow. Decline and negative trend sign symbol vector. Data analysis decrease vectors Bar chart collapse icon with downward arrow. Decline and negative trend sign symbol
Free with trial This image shows a bar graph with a downward trend, indicated by a red arrow. It represents a decline in business, finance, or the economy, isolated on white. Data analysis decrease illustrations A bar graph showing a downward trend with a red arrow isolated on white background. This image shows a bar graph with a downward trend, indicated by a red arrow. It represents a decline in business, finance, or the economy, isolated on white
Free with trial Digital illustration depicting a financial decline with red downward-trending graphs, coin stacks, and scattered currency symbols. Set against a dark grid background with neon highlights, this image conveys themes of market loss, economic recession, and financial analysis�ideal for business, editorial, and presentation use. Data analysis decrease illustrations Economic Downturn Illustration Red Decline Graph with Coin Stacks on Digital Grid. Digital illustration depicting a financial decline with red downward-trending graphs, coin stacks, and scattered currency symbols. Set against a dark grid background with neon highlights, this image conveys themes of market loss, economic recession, and financial analysis�ideal for business, editorial, and presentation use.
Free with trial Blue bars on a graph display a downward trend highlighted by a yellow arrow showing decline Great for illustrating economic concepts and market trends. Data analysis decrease illustrations Decreasing Bar Graph with Arrow Downward Financial Decline. Blue bars on a graph display a downward trend highlighted by a yellow arrow showing decline Great for illustrating economic concepts and market trends
Free with trial A stock market chart with a downward trend and shattered glass evokes a sense of financial loss and failure, and is used to illustrate economic downturns or market crashes. Data analysis decrease illustrations Financial Downfall Stock Market Chart with Shattered Glass. A stock market chart with a downward trend and shattered glass evokes a sense of financial loss and failure, and is used to illustrate economic downturns or market crashes
Free with trial Downward trend graph with large sad face and woman in casual attire. Ideal for business performance, feedback, failure, regret, decisions, emotions, analytics. Clean simple flat metaphor. Data analysis decrease vectors Declining Trend Graph with Sad Face and Casual Woman Highlighting Failure or Negative Feedback. Downward trend graph with large sad face and woman in casual attire. Ideal for business performance, feedback, failure, regret, decisions, emotions, analytics. Clean simple flat metaphor
Free with trial A stark red arrow zigzags downwards, powerfully representing economic downturns, market crashes, and negative financial trends. This visual signifies a crisis or significant drop. Data analysis decrease illustrations Red downward arrow symbolizing financial decline and economic recession trends. A stark red arrow zigzags downwards, powerfully representing economic downturns, market crashes, and negative financial trends. This visual signifies a crisis or significant drop
Free with trial A vibrant image featuring a thick, textured green arrow pointing upwards, symbolizing growth, success, and progress. Contrasting this, a bold red arrow points downwards, representing decline, loss, and failure. Both arrows are rendered with a painterly style, suggesting a hand-drawn or artistic representation of financial or market trends. The clean white background isolates the arrows, emphasizing their symbolic meaning. This visual is ideal for illustrating concepts like stock market fluctuations, business performance, positive and negative trends, or decision-making. Data analysis decrease illustrations Up and Down Arrows: Growth vs. Decline. A vibrant image featuring a thick, textured green arrow pointing upwards, symbolizing growth, success, and progress. Contrasting this, a bold red arrow points downwards, representing decline, loss, and failure. Both arrows are rendered with a painterly style, suggesting a hand-drawn or artistic representation of financial or market trends. The clean white background isolates the arrows, emphasizing their symbolic meaning. This visual is ideal for illustrating concepts like stock market fluctuations, business performance, positive and negative trends, or decision-making.
Free with trial A visual representation of a declining stock market trend, depicted by a bold red arrow descending across a financial graph, symbolizing economic downturn and investment loss. Data analysis decrease illustrations A red arrow pointing downwards on a stock market graph, isolated on white background. A visual representation of a declining stock market trend, depicted by a bold red arrow descending across a financial graph, symbolizing economic downturn and investment loss
Free with trial This striking image depicts a downward arrow crashing through a globe, symbolizing market decline. The glowing red elements evoke urgency in financial analytics. Data analysis decrease illustrations Downward Arrow Crashing Through the Globe Concept. This striking image depicts a downward arrow crashing through a globe, symbolizing market decline. The glowing red elements evoke urgency in financial analytics
Free with trial A collection of black and white icons representing financial concepts such as growth charts, decline arrows, and money symbols, all presented clearly on a plain white background for easy integration i. Data analysis decrease vectors Financial growth and decline icons isolated on transparent background. A collection of black and white icons representing financial concepts such as growth charts, decline arrows, and money symbols, all presented clearly on a plain white background for easy integration i
Free with trial Stacks of gold and silver coins in front of a blurred background with a financial graph and percentages. Data analysis decrease illustrations Stacks of coins and financial graph with percentages in background finance money. Stacks of gold and silver coins in front of a blurred background with a financial graph and percentages
Free with trial A simple bar chart and line graph with a downward arrow illustrates a negative trend like recession or business failure ideal for financial reports about crisis or loss. Data analysis decrease illustrations Declining Blue Bar Chart and Line Graph Showing Financial Loss on Gray Background. A simple bar chart and line graph with a downward arrow illustrates a negative trend like recession or business failure ideal for financial reports about crisis or loss
Free with trial Close-up of stacks of gold coins resting on a financial chart, symbolizing wealth, investment, finance, and economic growth. The image evokes a sense of prosperity and success in business and trading. Data analysis decrease illustrations Stacks of Gold Coins on Financial Chart. Close-up of stacks of gold coins resting on a financial chart, symbolizing wealth, investment, finance, and economic growth. The image evokes a sense of prosperity and success in business and trading.
Free with trial Visualize cost reduction strategies with this image. A finger touches a glowing hexagon icon with "cost reduction" text, representing business finance and savings. Ideal for corporate presentations on management. Data analysis decrease illustrations Touching a glowing hexagon icon with the words cost reduction on a dark background. Visualize cost reduction strategies with this image. A finger touches a glowing hexagon icon with "cost reduction" text, representing business finance and savings. Ideal for corporate presentations on management