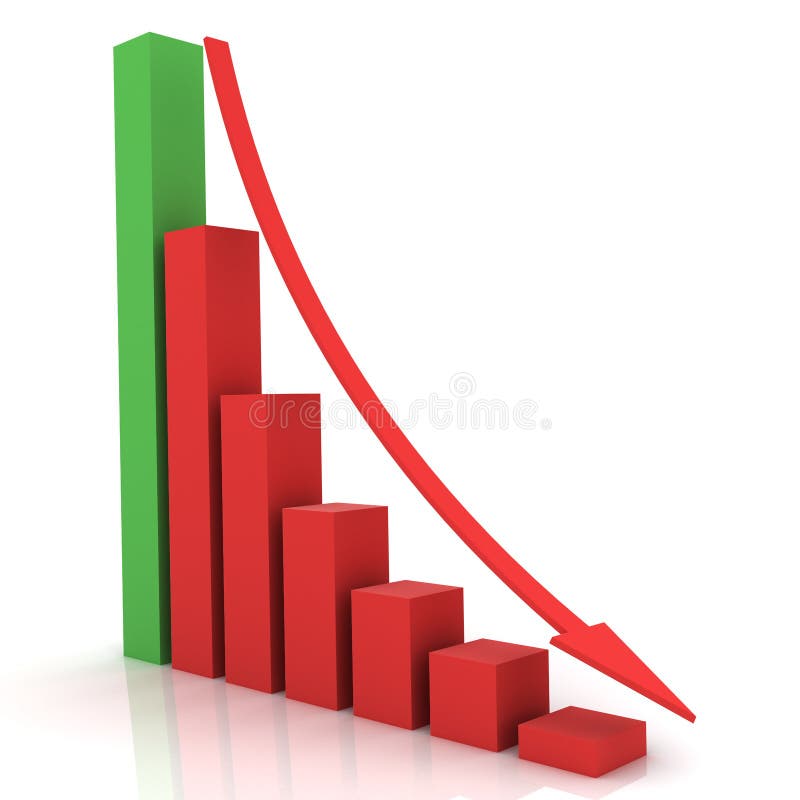
Free with trial 3D render of falling bar chart with red arrow showing the decline. Data analysis decrease illustrations Declining bar chart with arrow. 3D render of falling bar chart with red arrow showing the decline
Free with trial Stock crisis red market price arrow down chart fall / Stock exchange market analysis or forex charts graph - business and finance money forex crisis losing moving down economic inflation deflation. Data analysis decrease illustrations Stock crisis red market price arrow down chart fall / Stock exchange market analysis or forex charts graph
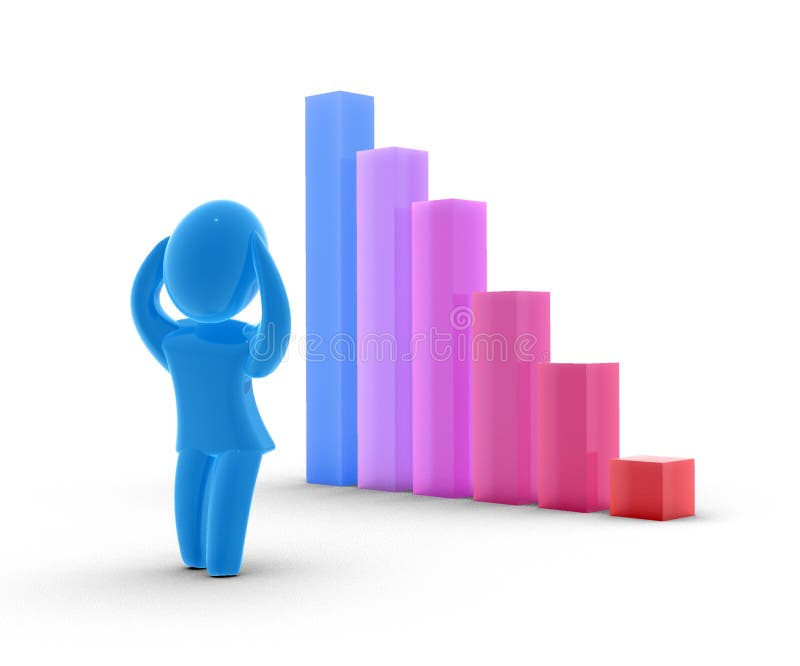
Free with trial Business bar chart with arrow pointing down. Data analysis decrease illustrations Business chart showing decrease. Business bar chart with arrow pointing down
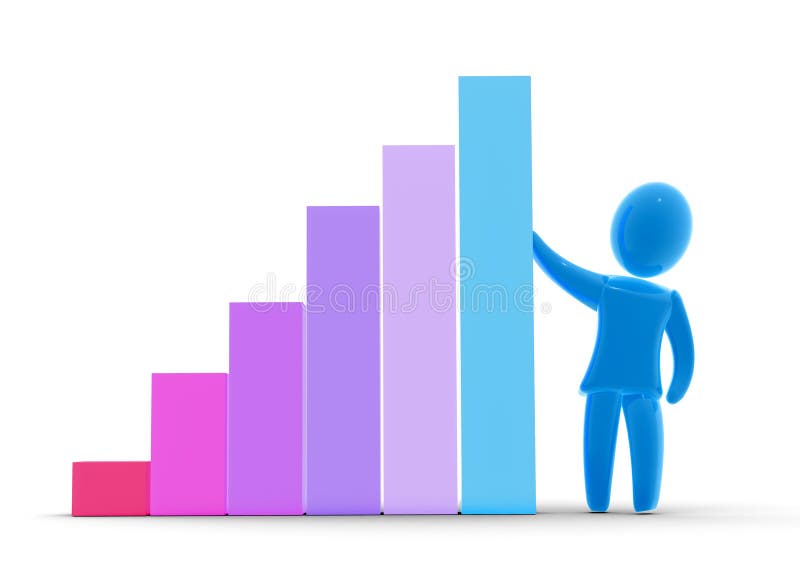
Free with trial Rising chart and satisfied stockholder or businessman. Data analysis decrease illustrations Shares rise. Rising chart and satisfied stockholder or businessman
Free with trial Declining chart - successful businessman turning into troubles. Data analysis decrease illustrations Declining chart
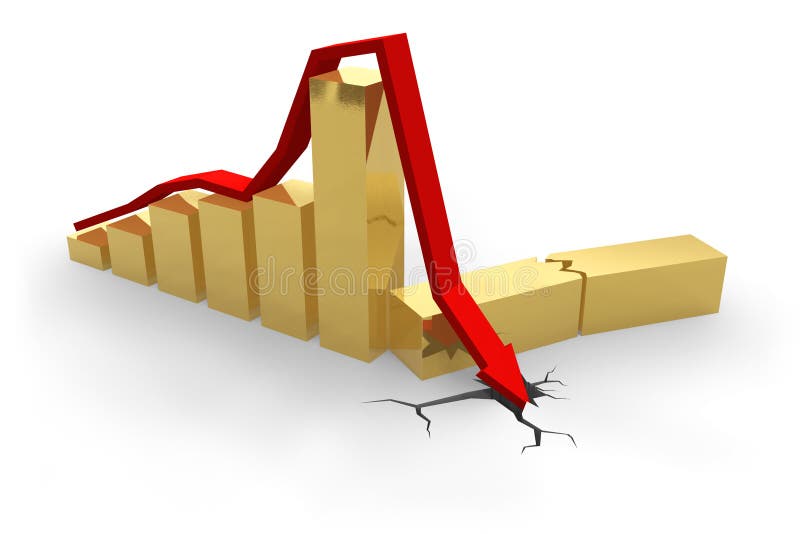
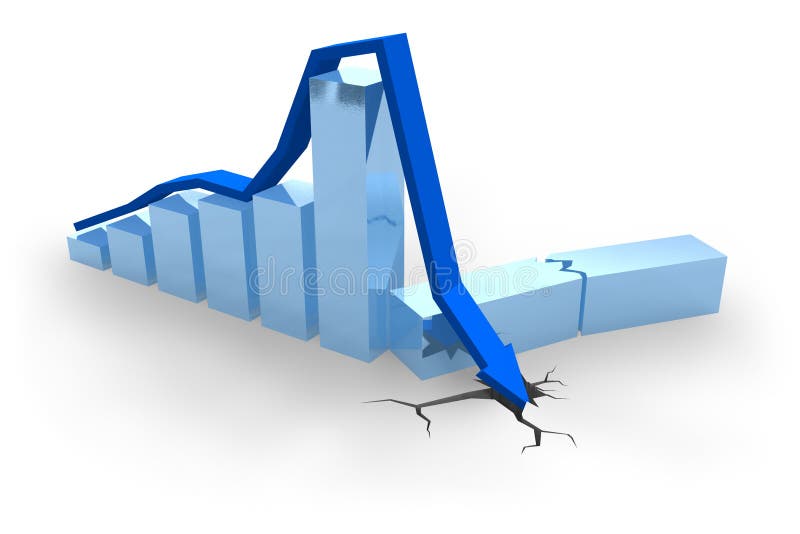
Free with trial Broken golden bar chart with red arrow dropped into the crack in white surface - crisis illustration. Data analysis decrease illustrations Crisis chart. Broken golden bar chart with red arrow dropped into the crack in white surface - crisis illustration
Free with trial Business financial crisis concept 3d illustration. Data analysis decrease illustrations Business financial crisis concept
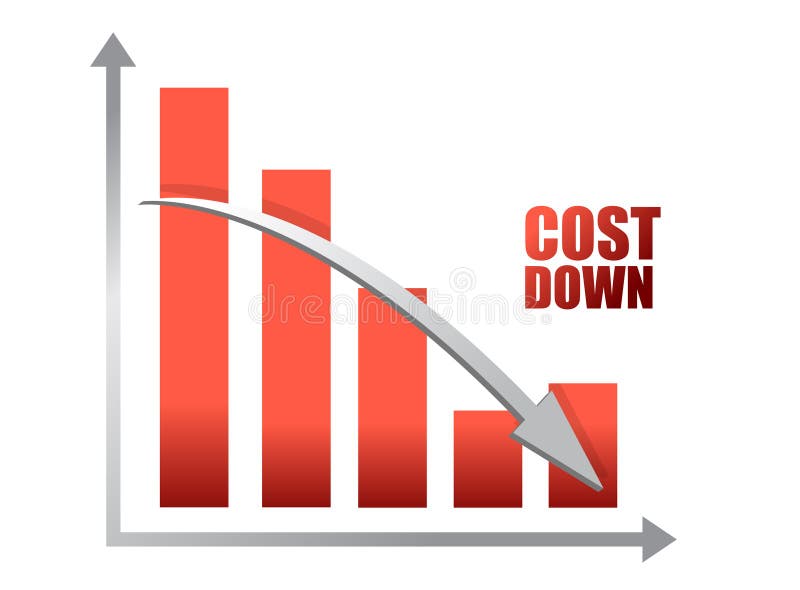
Free with trial Chalk drawing - Cost down chart illustration design. Data analysis decrease vectors Chalk drawing - Cost down chart illustration
Free with trial Arrow graph going down on green background illustration. Business chart freehand drawing. Data analysis decrease illustrations Arrow graph going down on green background illustration
Free with trial Set of icons with different types of charts and graphs. Data analysis decrease vectors Charts and graphs
Free with trial Business graph decline arrow down crisis concept 3d. Data analysis decrease illustrations Business graph decline arrow down crisis concept
Free with trial Abstract science analysis background frame illustration. Data analysis decrease illustrations Abstract science analysis background frame
Free with trial Set statistics icon. Graphic analysis and asset management. Information chart profits. Business efficiency and investment. finance data. Data analysis decrease vectors Set statistics icon.
Free with trial Abstract and conceptual stock market collage. Check the alternative version Exchange Profit. Data analysis decrease illustrations Exchange Loss. Abstract and conceptual stock market collage. Check the alternative version Exchange Profit.
Free with trial Steel crisis chart with golden arrow dropped into the crack in white surface. Data analysis decrease illustrations Steel crisis chart
Free with trial An image of a glass graphical pie chart, it could be useful for business concepts. Data analysis decrease illustrations Glass Pie Chart. An image of a glass graphical pie chart, it could be useful for business concepts.
Free with trial Declining chart and sick stockholder. Data analysis decrease illustrations Shares fell. Declining chart and sick stockholder
Free with trial 3d crisis word on red arrow. Data analysis decrease illustrations Crisis word on red arrow
Free with trial Abstract statistics frame border illustration. Data analysis decrease illustrations Abstract statistics frame border
Free with trial Blue crisis chart with arrow dropped into crack. Data analysis decrease illustrations Blue crisis chart
Free with trial An image of a graphical pie chart, it could be useful for business concepts. Data analysis decrease illustrations Pie Chart 133. An image of a graphical pie chart, it could be useful for business concepts.
Free with trial Abstract statistics blue background frame border illustration. Data analysis decrease illustrations Abstract statistics blue background frame border
Free with trial Different colors business circle graphs. vector file also available. Data analysis decrease vectors Business Circle graphs
Free with trial Stock Market icons set vector illustration. Contains such icon as Candle Graph, AI, IPO, Investment, Portfolio and more. Expanded Stroke. Data analysis decrease vectors Stock Market icons set vector illustration. Contains such icon as Candle Graph, AI, IPO, Investment and more. Expanded Stroke
Free with trial Quality and finance statistical control. Six sigma chart. Data analysis decrease illustrations Statistical control
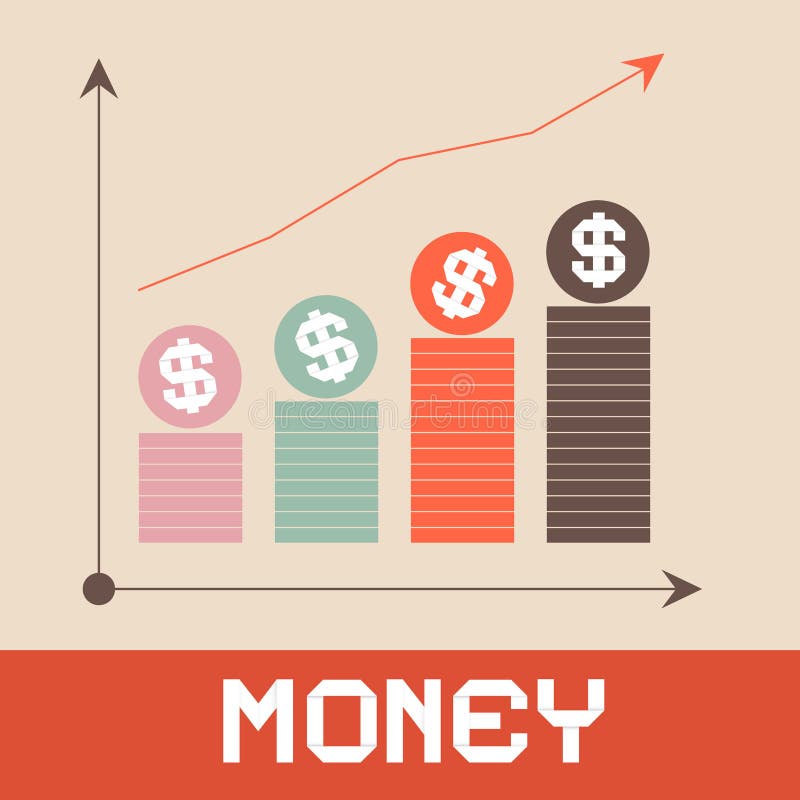
Free with trial Money Graph Paper Retro Vector Illustration. Data analysis decrease vectors Money Graph Vector Illustration. Money Graph Paper Retro Vector Illustration
Free with trial Up and down graph icons. Arrow charts, growth diagram and decline graph, business data analysis and financial trend. Market statistic information vector set. Increase and decrease graph symbols. Data analysis decrease vectors Up and down graph icons. Arrow charts, growth diagram and decline graph, business data analysis and financial trend. Market
Free with trial Graph line icons. Vector illustration include icon - data analysis, diagram, stat, histogram, economy outline pictogram for infographic statistic presentation. Green Color, Editable Stroke. Data analysis decrease illustrations Graph line icons. Vector illustration include icon - data analysis, diagram, stat, histogram, economy outline pictogram
Free with trial Assessment icons in line design. Assessment, data, analysis, compare, plan, analysis, testing, report, management isolated on white background vector Assessment editable stroke icons. Data analysis decrease vectors Assessment icons in line design. Assessment, data, analysis, compare, plan, analysis, testing, report, management
Free with trial Assessment icons in line design, blue. Assessment, data, analysis, compare, plan, analysis, testing, report, management isolated on white background vector Assessment editable stroke icons. Data analysis decrease vectors Assessment icons in line design, blue. Assessment, data, analysis, compare, plan, analysis, testing, report, management
Free with trial Online financial analysis line icon. linear style sign for mobile concept and web design. Laptop with decrease dollar rate outline vector icon. Symbol, logo illustration. Vector graphics. Data analysis decrease vectors Online financial analysis line icon
Free with trial Assessment web icons set in thin line design. Pack of process, report, feedback, auditor, solution, strategy, time management, decrease, result, data analysis, other. Vector outline stroke pictograms. Data analysis decrease illustrations Assessment web icons set in thin line design. Vector outline stroke pictograms. Assessment web icons set in thin line design. Pack of process, report, feedback, auditor, solution, strategy, time management, decrease, result, data analysis, other. Vector outline stroke pictograms
Free with trial Background business, abstract image of a computer screen of abstract stock market data. Data analysis decrease illustrations Stock Market Data Screen. Background business, abstract image of a computer screen of abstract stock market data
Free with trial Background business, abstract image of a computer screen of abstract stock market data. Data analysis decrease illustrations Global Market Data Screen. Background business, abstract image of a computer screen of abstract stock market data
Free with trial Statistic. Data analysis. Business and financial concept. Data analysis decrease vectors Statistic
Free with trial Notepad sketch business analysis background frame illustration. Data analysis decrease illustrations Notepad sketch business analysis background frame
Free with trial Doodle of business analysis graph. Data analysis decrease vectors Doodle of business analysis graph
Free with trial Business automated analytic system isometric icon, businessman hold a meeting, strategy formulation, chart analysis and trading, virtual graphics vector neon dark. Data analysis decrease vectors Business automated analytic system isometric icon, businessman hold a meeting, strategy formulation, chart analysis and
Free with trial Set statistics icon. Graphic analysis and asset management. Information chart profits. Business efficiency and investment. finance data. Line art, web and mobile app. Data analysis decrease vectors Set statistics icon
Free with trial Set statistics icon. Graphic analysis and asset management. Information chart profits. Business efficiency and investment. finance data. flat design. Data analysis decrease vectors Set statistics icon
Free with trial Red and green arrows Stock exchange market analysis / Stock crisis red price chart fall and green arrow up profits growth / Stock or forex business and finance money - economic inflation and deflation. Data analysis decrease illustrations Red and green arrows Stock exchange market analysis / Stock crisis red price
Free with trial Silver and Red 3D Profit Decrease Background. Data analysis decrease illustrations 3D Profit Decrease Background
Free with trial Inscription analysis and price chart. Dark background. Data analysis decrease vectors Analysis
Free with trial Chart glyph icon, finance and banking, decrease sign, vector graphics, a solid pattern on a white background, eps 10. Data analysis decrease vectors Chart glyph icon, finance and banking, decrease
Free with trial Data analytics ascending icon from user interface outline collection. Thin line data analytics ascending icon isolated on white background. Data analysis decrease vectors Data analytics ascending icon from user interface outline collection. Thin line data analytics ascending icon isolated on white
Free with trial Two lines are representing increasing and declining trends over a grid background, symbolizing market analysis, financial performance, or business progress. Data analysis decrease vectors Two lines are representing increasing and declining trends over a grid background, symbolizing market analysis
Free with trial Like, Update data and Graph chart icons simple set. Halftone dots button. Customisation sign. Social media likes, Sales chart, Growth report. Settings. Technology set. Classic flat like icon. Vector. Data analysis decrease vectors Like, Update data and Graph chart icons set. Customisation sign. Vector. Like, Update data and Graph chart icons simple set. Halftone dots button. Customisation sign. Social media likes, Sales chart, Growth report. Settings. Technology set. Classic flat like icon. Vector
Free with trial Data slice in the volume of the distribution function of point data. Three-dimensional flow of analytical information. The bulge of the mountain in the context of science. Data analysis decrease illustrations Data slice in the volume function of point data. Three-dimensional flow information. The bulge of the mountain science. Data slice in the volume of the distribution function of point data. Three-dimensional flow of analytical information. The bulge of the mountain in the context of science
Free with trial Analysis half glyph vector icon which can easily modify or edit. Data analysis decrease vectors Analysis half glyph vector icon which can easily modify or edit
Free with trial Missing data on analytics line graphic vector icon on white background. Flat vector missing data on analytics line graphic icon symbol sign from modern business collection for mobile concept and web. Data analysis decrease vectors Missing data on analytics line graphic vector icon on white background. Flat vector missing data on analytics line graphic icon
Free with trial Missing data on analytics line graphic icon in filled, thin line, outline and stroke style. Vector illustration of two colored and black missing data on analytics line graphic vector icons designs. Data analysis decrease vectors Missing data on analytics line graphic icon in filled, thin line, outline and stroke style. Vector illustration of two colored and
Free with trial Sine waves analysis icon on white background. Simple element illustration from Business and analytics concept. sine waves analysis sign icon symbol design. Data analysis decrease vectors Sine waves analysis icon on white background. Simple element illustration from Business and analytics concept
Free with trial Market trend icon in comic style. Decline arrow with magnifier cartoon vector illustration on white isolated background. Decrease splash effect business concept. Data analysis decrease vectors Market trend icon in comic style. Decline arrow with magnifier cartoon vector illustration on white isolated background. Decrease
Free with trial Market trend icon in comic style. Decline arrow with magnifier cartoon vector illustration on white isolated background. Decrease splash effect business concept. Data analysis decrease vectors Market trend icon in comic style. Decline arrow with magnifier cartoon vector illustration on white isolated background. Decrease
Free with trial Data slice in the volume of the distribution function of point data. Three-dimensional flow of analytical information. The bulge of the mountain in the context of science. Data analysis decrease illustrations Data slice in the volume function of point data. Three-dimensional flow information. The bulge of the mountain science. Data slice in the volume of the distribution function of point data. Three-dimensional flow of analytical information. The bulge of the mountain in the context of science
Free with trial Market trend icon in flat style. Decline arrow with magnifier vector illustration on white isolated background. Decrease business concept. Data analysis decrease vectors Market trend icon in flat style. Decline arrow with magnifier vector illustration on white isolated background. Decrease business
Free with trial Dollar rate decrease and increase, money arrow up and down. Vector icon template. Data analysis decrease vectors Dollar rate decrease and increase, money arrow up and down. Vector icon template
Free with trial Data analytics descending line graphic outline vector icon. Thin line black data analytics descending line graphic icon, flat vector simple element illustration from editable business concept isolated. Data analysis decrease vectors Data analytics descending line graphic outline vector icon. Thin line black data analytics descending line graphic icon, flat
Free with trial Stock market investment trading technical analysis candlestick, bar, line and area chart set on white background. Business candle stick graph exchange trends. Trader financial investment index. Vector. Data analysis decrease vectors Stock market investment trading technical analysis candlestick, bar, line and area chart set on white background
Free with trial Vector image charts and diagrams for presentation or financial report. Infographics concept. Increase and decrease of indicators in graphic diagram. Colorful vector illustration. Data analysis decrease vectors Vector image charts and diagrams for presentation or financial report. Infographics concept.Increase and decrease of
Free with trial Businessman uses digital tablet to analyze business performance data. Growth graph shows increased quality, decreased costs. Business strategy, project management key concepts. Modern. Data analysis decrease illustrations Businessman uses digital tablet to analyze business performance data. Growth graph shows increased quality, decreased costs.
Free with trial Background business, abstract image of a computer screen of abstract stock market data. Data analysis decrease illustrations Stock Market Screen. Background business, abstract image of a computer screen of abstract stock market data
Free with trial Graph icons, chart icons set and data form. Data analysis decrease illustrations Graph icons
Free with trial A 3D render shows a red thermometer with a white scale and a red bulb on the left, next to a blue square icon with two white downward-pointing arrows on the right. Both objects are isolated on a white background. The thermometer indicates a low temperature, and the down arrow suggests a decrease or decline. Data analysis decrease illustrations Red Thermometer Icon Next to Blue Down Arrow Symbol on White Background temperature heat. A 3D render shows a red thermometer with a white scale and a red bulb. A 3D render shows a red thermometer with a white scale and a red bulb on the left, next to a blue square icon with two white downward-pointing arrows on the right. Both objects are isolated on a white background. The thermometer indicates a low temperature, and the down arrow suggests a decrease or decline
Free with trial Crisis. Graphs and charts templates. Business infographics. Statistic and data, bankruptcy, financial crisis, money loss, down arrow, economy reduction. Financial chart. Vector illustration. Data analysis decrease vectors Crisis. Graphs and charts templates. Business infographics. Statistic and data, bankruptcy, financial crisis, money loss, down
Free with trial Decreasing Report Meaning Graphic Statistics And Trend. Data analysis decrease illustrations Decreasing Report Shows Graphic Analysis And Graphs. Decreasing Report Meaning Graphic Statistics And Trend
Free with trial Crisis. Graphs and charts templates. Business infographics. Statistic and data, bankruptcy, financial crisis, money loss, down arrow, economy reduction. Financial chart. Vector illustration. Data analysis decrease vectors Crisis. Graphs and charts templates. Business infographics. Statistic and data, bankruptcy, financial crisis, money loss, down
Free with trial A dramatic visual depicting a severe market crash or economic downturn. A vivid red line graph sharply descends, culminating in a downward-pointing arrow, set against a dark, stormy sky infused with abstract digital code elements. The reflective, gridded ground mirrors the ominous trend, amplifying the sense of crisis. This powerful image effectively conveys concepts of financial loss, business failure, data decline, and economic recession, making it suitable for news, financial reports, or presentations on negative market trends and risk. Data analysis decrease illustrations Market Crash and Economic Downturn: Red Graph in Digital Storm. A dramatic visual depicting a severe market crash or economic downturn. A vivid red line graph sharply descends, culminating in a downward-pointing arrow, set against a dark, stormy sky infused with abstract digital code elements. The reflective, gridded ground mirrors the ominous trend, amplifying the sense of crisis. This powerful image effectively conveys concepts of financial loss, business failure, data decline, and economic recession, making it suitable for news, financial reports, or presentations on negative market trends and risk.
Free with trial Composite image of global crisis economy - red toned grunge world map on a data graph and a decline curve with COVID-19 text. Data analysis decrease illustrations Global economy shock. Composite image of global crisis economy - red toned grunge world map on a data graph and a decline curve with COVID-19 text
Free with trial Business Crash Meaning Progress Report And Data. Data analysis decrease illustrations Business Crash Shows Financial Report And Biz. Business Crash Meaning Progress Report And Data
Free with trial Chart graph. Black Icon growth and downward with arrow isolated on background. Hologram positive, fall percentage. Design business concept direction growth, recession. Analysis. Vector illustration. Data analysis decrease vectors Chart graph. Black Icon growth and downward with arrow. Hologram positive, fall percentage. Design business. Vector illustration. Chart graph. Black Icon growth and downward with arrow isolated on background. Hologram positive, fall percentage. Design business concept direction growth, recession. Analysis. Vector illustration
Free with trial Stock crisis red price drop down chart fall / Stock market exchange analysis or forex graph business and finance crash money losing moving economic investment loss. Data analysis decrease illustrations Stock crisis red price drop down chart fall
Free with trial Business analytics doodle vectors pack, consisting all the geometrical data charts in editable style. Use it for your web and commercial projects. Data analysis decrease vectors Business Analytics Doodle Icons. Business analytics doodle vectors pack, consisting all the geometrical data charts in editable style. Use it for your web and commercial projects.
Free with trial Holographic globe with neon green and blue charts on dark blue and plaid backgrounds. Chaotic data in numbers. Indicators of growth and falls. 3d rendering. Data analysis decrease illustrations Neon green, blue chart waves with the holographic globe. Holographic globe with neon green and blue charts on dark blue and plaid backgrounds. Chaotic data in numbers. Indicators of growth and falls. 3d rendering
Free with trial Concept Of Mortgage rate decline visualized as house symbol decrease. Data analysis decrease illustrations Mortgage rate decline visualized as house symbol decrease
Free with trial Bitcoin graph billboard icon flat vector. Pay finance. Digital data price. Data analysis decrease illustrations Bitcoin graph billboard icon flat vector. Pay finance
Free with trial Bitcoin change icon flat vector. Online monetary system. Data price salary. Data analysis decrease vectors Bitcoin change icon flat vector. Online monetary system
Free with trial Bar chart or bar graph decreasing vector icon with drop down arrow. Statistical data of stock, financial in business to loss, negative, decline or crisis. Graphic for report, presentation. 48x48 px. n. Data analysis decrease vectors Bar chart or bar graph decreasing vector icon with drop down arrow. 48x48 pixel perfect and editable stroke. Bar chart or bar graph decreasing vector icon with drop down arrow. Statistical data of stock, financial in business to loss, negative, decline or crisis. Graphic for report, presentation. 48x48 px.n
Free with trial Bar chart or bar graph decreasing vector icon with drop down arrow. Statistical data of stock, financial in business to loss, negative, decline or crisis. Graphic for report, presentation. 48x48 px. n. Data analysis decrease illustrations Bar chart or bar graph decreasing vector icon with drop down arrow. 48x48 pixel perfect and editable stroke. Bar chart or bar graph decreasing vector icon with drop down arrow. Statistical data of stock, financial in business to loss, negative, decline or crisis. Graphic for report, presentation. 48x48 px.n
Free with trial Down market, decrease graph icon design vector. Data analysis decrease vectors Down market, decrease graph icon design