Free with trial Bar graph illustrates GDP growth and decline, marked by country flags for comparison. Generative Ai. Data analysis decrease illustrations Bar graph illustrates GDP growth and decline, marked by country flags for comparison
Free with trial Red arrow pointing downward on a financial spreadsheet, magnifying glass focusing on economic decline. Concept for recession, market crash, business loss, and negative financial trends. Data analysis decrease illustrations Red arrow pointing downward on a financial spreadsheet, magnifying glass focusing on economic decline.
Free with trial KYIV, UKRAINE - JANUARY 29, 2025 Nvidia corporation logotype showed on iPhone 15 smartphone display screen. Nvidia is a global leader in artificial intelligence hardware and software. Data analysis decrease illustrations KYIV, UKRAINE - JANUARY 29, 2025 Nvidia corporation logotype showed on iPhone 15 smartphone display screen. Nvidia is a
Free with trial Businessman pointing at a digital interface with interactive graphs showing quality and cost, where quality is increasing and cost is decreasing, representing trends in business performance, set in a professional and modern workspace. Data analysis decrease illustrations Businessman interacting with a digital interface showing quality and cost graphs with arrows pointing up and down. businessman pointing at a digital interface with interactive graphs showing quality and cost, where quality is increasing and cost is decreasing, representing trends in business performance, set in a professional and modern workspace
Free with trial Close-up graphic of financial market graph with dynamic lines. Represents investment volatility, uncertainty, stock price fluctuations. Concept of business success, growth failure in. Data analysis decrease illustrations Close-up graphic of financial market graph with dynamic lines. Represents investment volatility, uncertainty, stock price
Free with trial A businessman holds a coin, runs to stack of money bar chart with green graph up. Extend investment in Bull Economy, economic success, financial management, capital market performance, and profit. Data analysis decrease vectors A businessman holds a coin, runs to stack of money bar chart with green graph up. Extend investment in Bull Economy, economic
Free with trial A businessman holds banknotes, runs on stack of money in bar chart. Concepts of business development, pursuit of economic success, financial management, capital market performance, and profit growth. Data analysis decrease vectors A businessman holds banknotes, runs on stack of money in bar chart. Concepts of business development, pursuit of economic success
Free with trial Candlestick chart showing a downtrend, indicating a bear market and potential financial crisis Generated using AI, Bear Market Candlestick Chart Displaying Downtrend on Blue Screen Concept of Financial Crisis, Stock Market Crash, and Economic Recession. Data analysis decrease illustrations Bear Market Candlestick Chart Displaying Downtrend on Blue Screen Concept of Financial Crisis, Stock Market Crash, and Economic
Free with trial Photo shows melting glacier with economic graph superimposed. Visualizes environmental changes, climate impact. Global warming effect on finance industries apparent. Image crisis. Data analysis decrease illustrations Photo shows melting glacier with economic graph superimposed. Visualizes environmental changes, climate impact. Global warming
Free with trial Pink and green graph. Motion. Cartoon animation with graphs with a white dot moving to the left. High quality 4k footage. Data analysis decrease illustrations Pink and green graph. Motion.Cartoon animation with graphs with a white dot moving to the left.
Free with trial Pink and green graph. Motion. Cartoon animation with graphs with a white dot moving to the left. High quality 4k footage. Data analysis decrease illustrations Pink and green graph. Motion.Cartoon animation with graphs with a white dot moving to the left.
Free with trial Pink and green graph. Motion. Cartoon animation with graphs with a white dot moving to the left. High quality 4k footage. Data analysis decrease illustrations Pink and green graph. Motion.Cartoon animation with graphs with a white dot moving to the left.
Free with trial A businessman holds a coin, runs away from stack of money bar chart with red graph down. Withdraw capital in business recession, economic strategy, financial, market performance, and loss management. Data analysis decrease vectors A businessman holds a coin, runs away from stack of money bar chart with red graph down. Withdraw capital in business recession
Free with trial Economic financial downturn in 2025 chart down forecast crisis market crash prediction vector. Data analysis decrease vectors Economic financial downturn in 2025 chart down forecast crisis market crash prediction
Free with trial Economic downturn in 2025 chart down candle stick bearish stock crypto market prediction vector. Data analysis decrease vectors Economic downturn in 2025 chart down candle stick bearish stock crypto market prediction
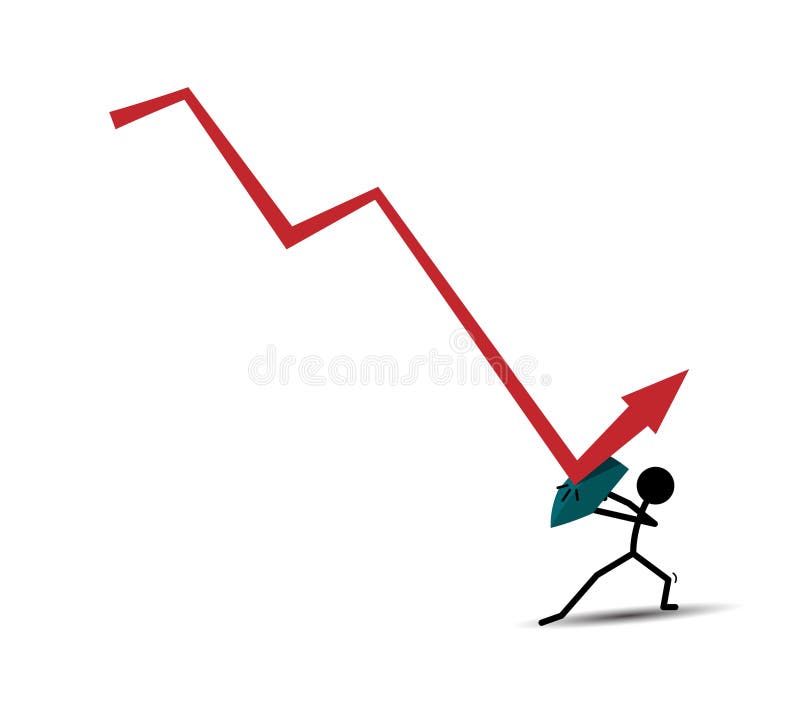
Free with trial Illustration of a graphic diagram going down and being reflected by a shield. . loss or decline. flat design style. Suitable for use in reports, illustrations, presentations, etc. vector design template. Data analysis decrease vectors Illustration of a graphic diagram going down and being reflected by a shield. . loss or decline. flat design style. Suitable for
Free with trial Declining bar graph illustration showing negative trend of business or economic recession or market crash with downward arrow. Data analysis decrease vectors Declining bar graph illustration showing negative trend of business or economic recession or market crash with downward arrow
Free with trial Close up view of red falling bar chart with laptop and potted plant in background. It represents financial crisis downturn risk and business failure in market. Investment analytics. Data analysis decrease illustrations Close up view of red falling bar chart with laptop and potted plant in background. It represents financial crisis downturn risk
Free with trial A businessman holds banknotes, runs to stack of money bar chart with green graph up. Extend investment in Bull Economy, economic success, financial management, capital market performance, and profit. Data analysis decrease vectors A businessman holds banknotes, runs to stack of money bar chart with green graph up. Extend investment in Bull Economy, economic
Free with trial Purple and gray light graph. Motion. A point moving along a graph line that goes up and down in animation. High quality 4k footage. Data analysis decrease illustrations Purple and gray light graph. Motion.A point moving along a graph line that goes up and down in animation.
Free with trial Purple and gray light graph. Motion. A point moving along a graph line that goes up and down in animation. High quality 4k footage. Data analysis decrease illustrations Purple and gray light graph. Motion.A point moving along a graph line that goes up and down in animation.
Free with trial Purple and gray light graph. Motion. A point moving along a graph line that goes up and down in animation. High quality 4k footage. Data analysis decrease illustrations Purple and gray light graph. Motion.A point moving along a graph line that goes up and down in animation.
Free with trial This image illustrates a financial chart showing a downward trend with a dollar sign, symbolizing economic decline, investment losses, and market instability. Data analysis decrease vectors Vector art of financial chart with downward trend and dollar sign, indicating economic decline and investment loss in the market. This image illustrates a financial chart showing a downward trend with a dollar sign, symbolizing economic decline, investment losses, and market instability
Free with trial Visualize the dynamic world of cryptocurrency trading with this compelling 3D illustration. A mobile phone screen dominates the composition, showcasing intricate candlestick charts alongside prominent buy and sell buttons, all set against a sophisticated dark blue background. This imagery captures the essence of online trading, finance, and investment strategies. Perfect for illustrating concepts. Data analysis decrease illustrations Cryptocurrency trading concept displaying a mobile phone screen with candlestick charts buy and sell buttons over a dark blue. Visualize the dynamic world of cryptocurrency trading with this compelling 3D illustration. A mobile phone screen dominates the composition, showcasing intricate candlestick charts alongside prominent buy and sell buttons, all set against a sophisticated dark blue background. This imagery captures the essence of online trading, finance, and investment strategies. Perfect for illustrating concepts
Free with trial A creative composition featuring global market decline visualization a bar graph and line chart showing a decreasing trend overlaid on a world map. Generative AI. Data analysis decrease illustrations Global market decline visualization a bar graph and line chart showing a decreasing trend overlaid on a world map. Generative AI
Free with trial Graphic diagram illustration taken down and cut using scissors. loss or decline. flat design style. Suitable for use in reports, illustrations, presentations, etc. vector design template. Data analysis decrease vectors Graphic diagram illustration taken down and cut using scissors. loss or decline. flat design style. Suitable for use in reports
Free with trial A sleek logo featuring the letter C integrated with chart bars, symbolizing financial growth and business analytics, suitable for finance or investment companies. Data analysis decrease vectors Vector art of modern logo design with letter c and chart bars, representing financial growth and business success in a minimalist. A sleek logo featuring the letter C integrated with chart bars, symbolizing financial growth and business analytics, suitable for finance or investment companies
Free with trial Tree illustration with bar graph displaying reduced carbon emissions from wood pellets, Generated by AI. Data analysis decrease illustrations Tree illustration with bar graph displaying reduced carbon emissions from wood pellets
Free with trial Closeup of a businessman s hands analyzing a decreasing stack of coins symbolizing the need for cost reduction and efficient business practices during an economic downturn generative ai. Data analysis decrease illustrations Businessman Analyzing Decreasing Coin Stack for Cost Reduction and Efficient Business Practices in Dramatic Chiaroscuro Lighting. Closeup of a businessman s hands analyzing a decreasing stack of coins symbolizing the need for cost reduction and efficient business practices during an economic downturn generative ai
Free with trial Red arrow going down stock icon on white background. Bankruptcy, financial market crash icon for your web site design, logo, app, UI. graph chart down trend symbol. chart going down sign. Data analysis decrease vectors Red arrow going down stock icon on white background. Bankruptcy, financial market crash icon for your web site design
Free with trial This image features the "3%" symbol, representing a small percentage. It can denote a discount, interest rate, or statistical value in finance and mathematics. Data analysis decrease vectors Vector art of three percent symbol representing a small percentage, discount, interest rate, or statistical value in finance and. This image features the "3%" symbol, representing a small percentage. It can denote a discount, interest rate, or statistical value in finance and mathematics
Free with trial Downward trending line graph displayed on digital screen. Financial decline visualized with red charts numbers representing loss. Business downturn economic recession or market. Data analysis decrease illustrations Downward trending line graph displayed on digital screen. Financial decline visualized with red charts numbers representing loss.
Free with trial This image features red and green arrows pointing downwards, symbolizing a decline or negative trend in markets, finance, or business. It represents loss and reduction. Data analysis decrease vectors Vector art of a visual representation of downward trends with red and green arrows indicating decline isolated on white background. This image features red and green arrows pointing downwards, symbolizing a decline or negative trend in markets, finance, or business. It represents loss and reduction
Free with trial A vibrant depiction of the American flag overlaid with financial graphs, conveying economic activity and market fluctuations. The colors are bold and dynamic, reflecting financial markets' volatile nature and patriotic symbolism. Data analysis decrease illustrations American flag merged with fluctuating financial graph, symbolizing economic trends and stock market dynamics. A vibrant depiction of the American flag overlaid with financial graphs, conveying economic activity and market fluctuations. The colors are bold and dynamic, reflecting financial markets' volatile nature and patriotic symbolism.
Free with trial Animated Stream Of Interfaces With Economic and stock information red and yellow color, speculation fall. Data analysis decrease illustrations Animated Stream Of Interfaces With Economic and stock information red and yellow color, speculation fall
Free with trial Animated Stream Of Interfaces With Economic and stock information red and yellow color, speculation fall. Data analysis decrease illustrations Animated Stream Of Interfaces With Economic and stock information red and yellow color, speculation fall
Free with trial Animated Stream Of Interfaces With Economic and stock information red and yellow color, speculation fall. Data analysis decrease illustrations Animated Stream Of Interfaces With Economic and stock information red and yellow color, speculation fall
Free with trial Animated Stream Of Interfaces With Economic and stock information red and yellow color, speculation fall. Data analysis decrease illustrations Animated Stream Of Interfaces With Economic and stock information red and yellow color, speculation fall
Free with trial Animated Stream Of Interfaces With Economic and stock information red and yellow color, speculation fall. Data analysis decrease illustrations Animated Stream Of Interfaces With Economic and stock information red and yellow color, speculation fall
Free with trial Black background. Motion. Blurry pixel graphics that sway slowly in different directions in abstraction. High quality 4k footage. Data analysis decrease illustrations Black background. Motion.Blurry pixel graphics that sway slowly in different directions in abstraction.
Free with trial A businessman holds a coin, runs on stack of money bar chart with green graph up. Extend investment in Bull Economy, economic success, financial management, capital market performance, and profit. Data analysis decrease vectors A businessman holds a coin, runs on stack of money bar chart with green graph up. Extend investment in Bull Economy, economic
Free with trial Animation with values of currency exchange rate chart. Motion. Moving stylish chart of bank currencies on stock exchange. Chart with currency values and changing line indicators. Data analysis decrease illustrations Animation with values of currency exchange rate chart. Motion. Moving stylish chart of bank currencies on stock exchange
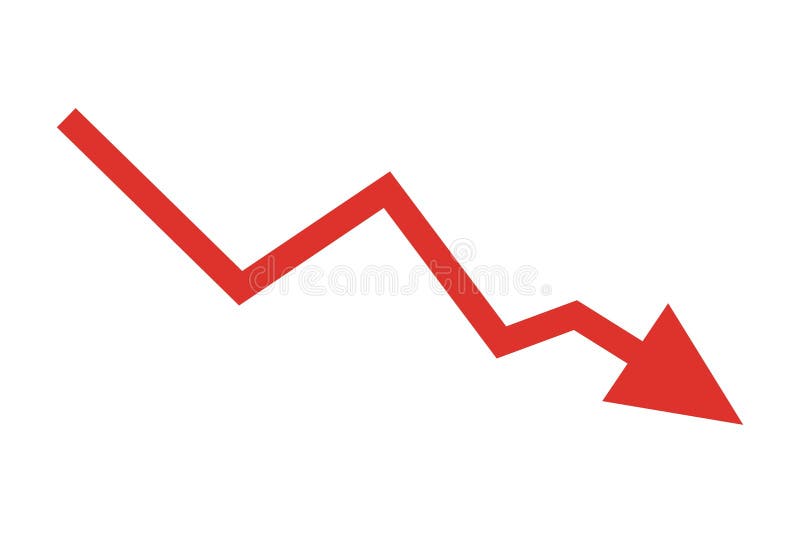
Free with trial Clean red line graph shows a steep decline against white, emphasizing negative space. Data analysis decrease illustrations Minimalist red line graph showing sharp decline on white background, clean lines, negative space. Clean red line graph shows a steep decline against white, emphasizing negative space.
Free with trial Clean red line graph shows a steep decline against white, emphasizing negative space. Data analysis decrease illustrations Minimalist red line graph showing sharp decline on white background, clean lines, negative space. Clean red line graph shows a steep decline against white, emphasizing negative space.
Free with trial Clean red line graph shows a steep decline against white, emphasizing negative space. Data analysis decrease illustrations Minimalist red line graph showing sharp decline on white background, clean lines, negative space. Clean red line graph shows a steep decline against white, emphasizing negative space.
Free with trial European Union Flag with Decreasing Stock Market Graph. Data analysis decrease illustrations European Union Flag with Decreasing Stock Market
Free with trial A businessman holds banknotes, runs on stack of money bar chart with green graph up. Extend investment in Bull Economy, economic success, financial management, capital market performance, and profit. Data analysis decrease vectors A businessman holds banknotes, runs on stack of money bar chart with green graph up. Extend investment in Bull Economy, economic
Free with trial Red arrow pointing downward on a financial spreadsheet, magnifying glass focusing on economic decline. Concept for recession, market crash, business loss, and negative financial trends. Data analysis decrease illustrations Red arrow pointing downward on a financial spreadsheet, magnifying glass focusing on economic decline.
Free with trial Red arrow pointing downward on a financial spreadsheet, magnifying glass focusing on economic decline. Concept for recession, market crash, business loss, and negative financial trends. Data analysis decrease illustrations Red arrow pointing downward on a financial spreadsheet, magnifying glass focusing on economic decline.
Free with trial Red arrow pointing downward on a financial spreadsheet, magnifying glass focusing on economic decline. Concept for recession, market crash, business loss, and negative financial trends. Data analysis decrease illustrations Red arrow pointing downward on a financial spreadsheet, magnifying glass focusing on economic decline.
Free with trial Red arrow pointing downward on a financial spreadsheet, magnifying glass focusing on economic decline. Concept for recession, market crash, business loss, and negative financial trends. Data analysis decrease illustrations Red arrow pointing downward on a financial spreadsheet, magnifying glass focusing on economic decline.
Free with trial Red arrow pointing downward on a financial spreadsheet, magnifying glass focusing on economic decline. Concept for recession, market crash, business loss, and negative financial trends. Data analysis decrease illustrations Red arrow pointing downward on a financial spreadsheet, magnifying glass focusing on economic decline.
Free with trial Red arrow pointing downward on a financial spreadsheet, magnifying glass focusing on economic decline. Concept for recession, market crash, business loss, and negative financial trends. Data analysis decrease illustrations Red arrow pointing downward on a financial spreadsheet, magnifying glass focusing on economic decline.
Free with trial Red arrow pointing downward on a financial spreadsheet, magnifying glass focusing on economic decline. Concept for recession, market crash, business loss, and negative financial trends. Data analysis decrease illustrations Red arrow pointing downward on a financial spreadsheet, magnifying glass focusing on economic decline.
Free with trial Red arrow pointing downward on a financial spreadsheet, magnifying glass focusing on economic decline. Concept for recession, market crash, business loss, and negative financial trends. Data analysis decrease illustrations Red arrow pointing downward on a financial spreadsheet, magnifying glass focusing on economic decline.
Free with trial Red arrow pointing downward on a financial spreadsheet, magnifying glass focusing on economic decline. Concept for recession, market crash, business loss, and negative financial trends. Data analysis decrease illustrations Red arrow pointing downward on a financial spreadsheet, magnifying glass focusing on economic decline.
Free with trial KYIV, UKRAINE - JANUARY 29, 2025 Nvidia corporation logotype showed on iPhone 15 smartphone display screen. Nvidia is a global leader in artificial intelligence hardware and software. Data analysis decrease illustrations KYIV, UKRAINE - JANUARY 29, 2025 Nvidia corporation logotype showed on iPhone 15 smartphone display screen. Nvidia is a
Free with trial KYIV, UKRAINE - JANUARY 29, 2025 Nvidia corporation logotype showed on iPhone 15 smartphone display screen. Nvidia is a global leader in artificial intelligence hardware and software. Data analysis decrease illustrations KYIV, UKRAINE - JANUARY 29, 2025 Nvidia corporation logotype showed on iPhone 15 smartphone display screen. Nvidia is a
Free with trial KYIV, UKRAINE - JANUARY 29, 2025 Nvidia corporation logotype showed on iPhone 15 smartphone display screen. Nvidia is a global leader in artificial intelligence hardware and software. Data analysis decrease illustrations KYIV, UKRAINE - JANUARY 29, 2025 Nvidia corporation logotype showed on iPhone 15 smartphone display screen. Nvidia is a
Free with trial Flat bar chart uses dramatically shorter red bars on black to emphasize a sharp fall. Data analysis decrease illustrations Flat design simple bar chart with dramatically decreasing red bars on black background, emphasizing fall. Flat bar chart uses dramatically shorter red bars on black to emphasize a sharp fall.
Free with trial Flat bar chart uses dramatically shorter red bars on black to emphasize a sharp fall. Data analysis decrease illustrations Flat design simple bar chart with dramatically decreasing red bars on black background, emphasizing fall. Flat bar chart uses dramatically shorter red bars on black to emphasize a sharp fall.
Free with trial Flat bar chart uses dramatically shorter red bars on black to emphasize a sharp fall. Data analysis decrease illustrations Flat design simple bar chart with dramatically decreasing red bars on black background, emphasizing fall. Flat bar chart uses dramatically shorter red bars on black to emphasize a sharp fall.
Free with trial Flat bar chart uses dramatically shorter red bars on black to emphasize a sharp fall. Data analysis decrease illustrations Flat design simple bar chart with dramatically decreasing red bars on black background, emphasizing fall. Flat bar chart uses dramatically shorter red bars on black to emphasize a sharp fall.
Free with trial A stylized image depicting the depreciation of the Japanese Yen. A glowing red downward trending graph with the word 'DEPRECIATION' and the yen symbol is overlaid on a blurred Japanese flag in the background. The image conveys a sense of economic downturn and financial crisis in Japan. Data analysis decrease illustrations Japanese Yen Depreciation Chart. A stylized image depicting the depreciation of the Japanese Yen. A glowing red downward trending graph with the word 'DEPRECIATION' and the yen symbol is overlaid on a blurred Japanese flag in the background. The image conveys a sense of economic downturn and financial crisis in Japan.
Free with trial Illustrates a stock market crash with declining graphs and red arrows. Represents economic downturn, financial crisis, and recession. Symbolizes loss, risk, and negative trends in business. Data analysis decrease illustrations Stock market crash financial crisis recession economic downturn red arrow graph chart diagram decline 2024. Illustrates a stock market crash with declining graphs and red arrows. Represents economic downturn, financial crisis, and recession. Symbolizes loss, risk, and negative trends in business.
Free with trial Generated with the use of AI. Business Analyst Touching a Glowing Cost Reduction Graph on a Virtual Interface Above Laptop Indicating Financial Strategy. Data analysis decrease illustrations Business Analyst Touching a Glowing Cost Reduction Graph on a Virtual Interface Above Laptop Indicating Financial Strategy
Free with trial Generated with the use of AI. Business Analyst Touching a Glowing Cost Reduction Graph on a Virtual Interface Above Laptop Indicating Financial Strategy. Data analysis decrease illustrations Business Analyst Touching a Glowing Cost Reduction Graph on a Virtual Interface Above Laptop Indicating Financial Strategy
Free with trial A businessman is shown with a downward trending graph, indicating financial loss. The image conveys a sense of economic downturn, recession, or market failure. It highlights business challenges and financial risks. Data analysis decrease illustrations Business man showing financial graph with downward trend and arrow indicating loss in market 2024. A businessman is shown with a downward trending graph, indicating financial loss. The image conveys a sense of economic downturn, recession, or market failure. It highlights business challenges and financial risks.
Free with trial The image shows a declining stock market graph overlaid with the Chinese flag suggesting economic downturn in China. Data analysis decrease illustrations Chinese Flag Overlays A Negative Stock Market Graph. The image shows a declining stock market graph overlaid with the Chinese flag suggesting economic downturn in China
Free with trial A businessman analyzes a digital tablet displaying a carbon emission reduction chart, symbolizing environmental sustainability and climate change mitigation. The graph illustrates a downward trend in CO2 emissions, highlighting the importance of environmental protection and sustainable development. This visual representation conveys concepts of clean energy, green technology, and eco-friendly. Data analysis decrease illustrations Businessman analyzing carbon emission reduction chart on a digital tablet illustrating environmental sustainability and climate. A businessman analyzes a digital tablet displaying a carbon emission reduction chart, symbolizing environmental sustainability and climate change mitigation. The graph illustrates a downward trend in CO2 emissions, highlighting the importance of environmental protection and sustainable development. This visual representation conveys concepts of clean energy, green technology, and eco-friendly
Free with trial A dramatic illustration of a stock market crash, featuring a sharp, red line graph plummeting downwards. This image symbolizes financial downfall, economic recession, and investment risk in business. Data analysis decrease illustrations Stock market crash red line graph financial downfall economic recession business loss investment risk chart 2024. A dramatic illustration of a stock market crash, featuring a sharp, red line graph plummeting downwards. This image symbolizes financial downfall, economic recession, and investment risk in business.
Free with trial Economic graph showing tariffs impact on import and export costs from 2020 to 2025 with rising and falling trend lines, ideal for finance, trade, and global economy topics. 3d rendering. Data analysis decrease illustrations Economic graph showing tariffs impact on import and export costs from 2020 to 2025 with rising and falling trend lines, ideal for
Free with trial China flag, growing business graph, economy. Flat design illustration. Generative AI. Data analysis decrease illustrations China flag, growing business graph, economy. Flat design illustration
Free with trial Pakistan GDP decreasing shown with arrows going down, business and finance concept backdrop. Data analysis decrease illustrations Pakistan GDP decreasing shown with arrows going down, business and finance concept backdrop
Free with trial Decline prices in 2024. Falling chart. Graph drop. Reduction money. Lower finance. Vector illustration flat design. Isolated on white background. Data analysis decrease vectors Decline prices in 2024. Falling chart. Graph drop. Reduction money.
Free with trial A bear market, such as stocks or cryptocurrencies, that is in a downtrend , which creates a huge disaster for investors. It is suitable to use the image in articles analyzing various price trends. Data analysis decrease illustrations A bear market, such as stocks or cryptocurrencies, that is in a downtrend , which creates a huge disaster for investors. It is
Free with trial A bear market, such as stocks or cryptocurrencies, that is in a downtrend , which creates a huge disaster for investors. It is suitable to use the image in articles analyzing various price trends. Data analysis decrease illustrations A bear market, such as stocks or cryptocurrencies, that is in a downtrend , which creates a huge disaster for investors. It is
Free with trial A bear market, such as stocks or cryptocurrencies, that is in a downtrend , which creates a huge disaster for investors. It is suitable to use the image in articles analyzing various price trends. Data analysis decrease illustrations A bear market, such as stocks or cryptocurrencies, that is in a downtrend , which creates a huge disaster for investors. It is
Free with trial A bear market, such as stocks or cryptocurrencies, that is in a downtrend , which creates a huge disaster for investors. It is suitable to use the image in articles analyzing various price trends. Data analysis decrease illustrations A bear market, such as stocks or cryptocurrencies, that is in a downtrend , which creates a huge disaster for investors. It is