Free with trial Wallet with a decline arrows. Economic recession crisis. No money. Data analysis decrease illustrations Wallet with a decline arrows. Economic recession crisis. No money
Free with trial Red arrow points down on a financial chart signaling market decline representing losses, and recession Use for illustrating economic downturns and financial instability. Data analysis decrease illustrations Downward Stock Market Trend Red Arrow and Chart Decline Indicator. Red arrow points down on a financial chart signaling market decline representing losses, and recession Use for illustrating economic downturns and financial instability
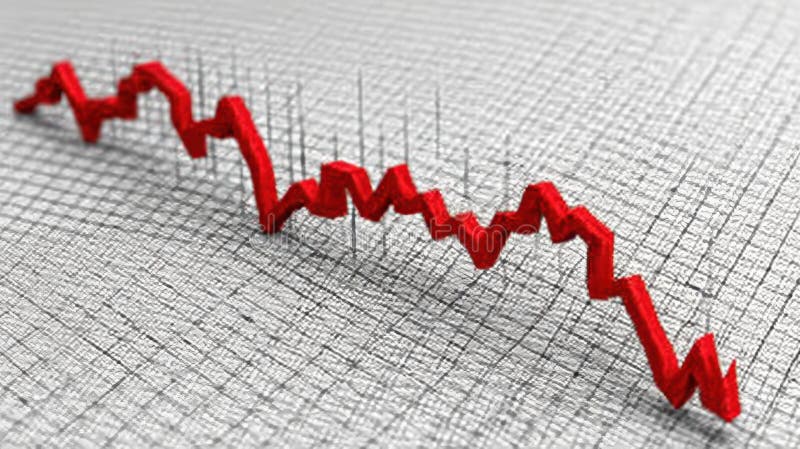
Free with trial This 3D graph, generated by AI, depicts a sharp market downturn. The red line dramatically falls, illustrating significant financial losses and economic instability. The textured background enhances the visual impact, conveying a sense of crisis. Data analysis decrease illustrations AI-Generated Market Crash Visualization. This 3D graph, generated by AI, depicts a sharp market downturn. The red line dramatically falls, illustrating significant financial losses and economic instability. The textured background enhances the visual impact, conveying a sense of crisis.
Free with trial Wallet with a decline arrows. Economic recession crisis. No moneyn. Data analysis decrease illustrations Wallet with a decline arrows. Economic recession crisis. No money
Free with trial Two lines illustrate a contrasting trend, one declining and the other rising, blending harmoniously in shades of orange, evoking a sense of change. Data analysis decrease illustrations Dynamic Trends Showcased Through Contrasting Lines in Warm Hues of Orange. Two lines illustrate a contrasting trend, one declining and the other rising, blending harmoniously in shades of orange, evoking a sense of change
Free with trial Analyze Gold Coins and Economic Growth with Magnifying Glass on Stock Chart , stunning visual effect. Data analysis decrease illustrations Analyze Gold Coins and Economic Growth with Magnifying Glass on Stock Chart
Free with trial A businessman in a suit points down at a red graph indicating a financial decline. The image symbolizes economic downturn, market crash, or business losses. The lighting is soft, and the composition focuses on the hand and graph. Data analysis decrease illustrations Businessman\'s Hand Pointing Downward on Red Financial Decline Graph, Economic Crisis. A businessman in a suit points down at a red graph indicating a financial decline. The image symbolizes economic downturn, market crash, or business losses. The lighting is soft, and the composition focuses on the hand and graph
Free with trial Illustration of declining financial graph as background for concepts and presentations, Generated by AI. Data analysis decrease illustrations Illustration of declining financial graph as background for concepts and presentations
Free with trial Breaking red arrow pointing downwards dramatically pierces a financial chart with gold coins, conveying a feeling of economic loss and volatility, ideal for finance and investment related marketing. Data analysis decrease illustrations Red Downward Arrow Breaking on Colorful Financial Chart with Gold Coins. Breaking red arrow pointing downwards dramatically pierces a financial chart with gold coins, conveying a feeling of economic loss and volatility, ideal for finance and investment related marketing
Free with trial A hand is drawing a decreasing graph with a red pen over a sketch of a city skyline, symbolizing a decline in economic or business performance. Data analysis decrease illustrations Hand drawing decreasing graph with red pen over a sketch of a city skyline. A hand is drawing a decreasing graph with a red pen over a sketch of a city skyline, symbolizing a decline in economic or business performance
Free with trial A bold blue percentage symbol, 3D-rendered, ideal for financial, statistical, and business presentations. Clean design. Data analysis decrease illustrations Blue percentage symbol isolated on white background for finance concepts. A bold blue percentage symbol, 3D-rendered, ideal for financial, statistical, and business presentations. Clean design
Free with trial This image shows a downward trending stock market graph generated by AI, illustrating a period of significant decline. The detailed chart provides a visual representation of financial instability and potential losses. This AI-generated visualization is useful for understanding market trends and vol. Data analysis decrease illustrations AI-Generated Stock Market Decline. This image shows a downward trending stock market graph generated by AI, illustrating a period of significant decline. The detailed chart provides a visual representation of financial instability and potential losses. This AI-generated visualization is useful for understanding market trends and vol
Free with trial Line graph up and down icon in black circle. Outline bar chart with arrow symbol vector. Analytics concept. Data analysis decrease vectors Line graph up and down icon in black circle. Outline bar chart with arrow symbol. Analytics concept
Free with trial A whiteboard displays a hand-drawn graph showing a significant downward trend in stock prices. This visual representation of a market downturn was generated by AI and emphasizes the volatility and potential risks associated with stock market investments. The image is a clear, concise illustration o. Data analysis decrease illustrations AI-Generated Stock Market Decline. A whiteboard displays a hand-drawn graph showing a significant downward trend in stock prices. This visual representation of a market downturn was generated by AI and emphasizes the volatility and potential risks associated with stock market investments. The image is a clear, concise illustration o
Free with trial Hand Drawn Graphic Showing Decline Bar Chart with Arrow Pointing Downward. Data analysis decrease vectors Hand Drawn Graphic Showing Decline Bar Chart with Arrow Pointing Downward
Free with trial Human showing wallet with a decline arrows. Economic recession crisis. No money. Data analysis decrease illustrations Human showing wallet with a decline arrows. Economic recession crisis. No money
Free with trial Human showing wallet with a decline arrows. Economic recession crisis. No money. Data analysis decrease illustrations Human showing wallet with a decline arrows. Economic recession crisis. No money
Free with trial Image shows wooden blocks forming a chart. It graphically represents a market decline or economic downturn, suitable for illustrating business graphs and financial crisis concepts. Data analysis decrease illustrations Wooden Blocks Graph Depicting Market Decline Good Resolution Stock Photo. Image shows wooden blocks forming a chart. It graphically represents a market decline or economic downturn, suitable for illustrating business graphs and financial crisis concepts.
Free with trial Simple bar chart graphic with rising and falling columns of varying heights. Data analysis decrease vectors Simple bar chart graphic with rising and falling columns of varying heights
Free with trial Red arrow pointing down graph shows market crash chart finance investment AI-generated for unique and creative designs. Data analysis decrease illustrations Red arrow pointing down, graph shows market crash , chart, finance, investment. Red arrow pointing down graph shows market crash chart finance investment AI-generated for unique and creative designs
Free with trial Orange bar chart with downward arrow showing decline in industrial production. Manufacturing business downturn with economic crisis concept. Data analysis decrease illustrations Orange bar chart with downward arrow showing decline in industrial production
Free with trial Hand interacts with glowing line graphs and percentage symbols. Data analysis decrease illustrations Hand interacts with glowing line graphs and percentage symbols
Free with trial Hand interacts with glowing line graphs and percentage symbols. Data analysis decrease illustrations Hand interacts with glowing line graphs and percentage symbols
Free with trial Tablet displaying a downward trending bar chart and arrow icon. Data analysis decrease vectors Tablet displaying a downward trending bar chart and arrow icon
Free with trial Falling bar chart with downward arrow signifying decline and negative trend. Data analysis decrease vectors Falling bar chart with downward arrow signifying decline and negative trend
Free with trial Growth and decline. Business chart icon. Profit loss symbol. Vector illustration. EPS 10. Data analysis decrease vectors Growth and decline. Business chart icon. Profit loss symbol. Vector illustration.
Free with trial A striking graph displays two distinct lines, one rising and the other falling, representing contrasting trends. The vivid gradient colors create a dynamic visual effect. Data analysis decrease illustrations Lines of Change in Vibrant Gradients Illustrate Contrasting Trends Over Time. A striking graph displays two distinct lines, one rising and the other falling, representing contrasting trends. The vivid gradient colors create a dynamic visual effect
Free with trial A simple line drawing of a decreasing chart with an arrow pointing downwards, depicting negative growth or decline. Useful for presentations, infographics, and reports. Data analysis decrease vectors Minimalist Line Style Decreasing Chart Arrow Down Financial Graphic Element. A simple line drawing of a decreasing chart with an arrow pointing downwards, depicting negative growth or decline. Useful for presentations, infographics, and reports.
Free with trial A striking red arrow diagonally points downwards, visually representing a significant drop or negative trend. This impactful graphic is perfect for conveying concepts of loss profit or falling stock. Data analysis decrease illustrations Bold red arrow points downward illustrating decline and negative trends in business white background. A striking red arrow diagonally points downwards, visually representing a significant drop or negative trend. This impactful graphic is perfect for conveying concepts of loss profit or falling stock
Free with trial Hand drawn bar graph shows decreasing trend with downward arrow illustration. Data analysis decrease vectors Hand drawn bar graph shows decreasing trend with downward arrow illustration
Free with trial Simple magnifying glass icon design, perfect for website or app interface. This vector graphic is ideal for representing search, discovery, and investigation concepts. Data analysis decrease vectors Magnifying Glass Icon: Detailed Vector Illustration for Search and Discovery. Simple magnifying glass icon design, perfect for website or app interface. This vector graphic is ideal for representing search, discovery, and investigation concepts.
Free with trial A hand-drawn chart illustrates a market decline, demonstrating decreasing financial figures. The graph shows a clear downward trend, indicating potential losses or an economic downturn. Data analysis decrease illustrations Hand drawn chart displaying market decline and decreasing financial figures. A hand-drawn chart illustrates a market decline, demonstrating decreasing financial figures. The graph shows a clear downward trend, indicating potential losses or an economic downturn
Free with trial A digital image featuring a bearish stock market trend with red and yellow colors on a dark background, concept of financial crisis. Data analysis decrease illustrations A digital image featuring a bearish stock market trend with red and yellow colors on a dark background, concept of financial
Free with trial Conceptual illustration combining a baby stroller with declining graphs to represent lowering birth rates and family planning changes. Highlights trends in societal demographics and population changes. Data analysis decrease illustrations Illustration of declining birth rates represented with a baby stroller and graphs. Conceptual illustration combining a baby stroller with declining graphs to represent lowering birth rates and family planning changes. Highlights trends in societal demographics and population changes
Free with trial Tablet displays a declining graph, reflecting downturns. A dark world map serves as the backdrop, emphasizing global impact. This visualization symbolizes economic changes. The image is. Data analysis decrease illustrations Global Decline Displayed on Tablet with World Map Background in Dim Lighting. Tablet displays a declining graph, reflecting downturns. A dark world map serves as the backdrop, emphasizing global impact. This visualization symbolizes economic changes. The image is
Free with trial Candlestick chart with buy and sell signals over digital world map and city skyline on dark background, symbolizing global market and forex trading. Data analysis decrease illustrations Global financial chart with buy and sell indicators over world map and cityscape background, illustrating stock market and forex. Candlestick chart with buy and sell signals over digital world map and city skyline on dark background, symbolizing global market and forex trading
Free with trial This image depicts a financial loss with red arrows and bars on a stock market chart showing a downward trend. The concept conveys the theme of financial decline and loss in the stock market. The arrows and bars symbolize a negative trend in the financial market, indicating a decrease in value of stocks and shares. The image captures the significance of financial loss and the impact it can have on investors and the economy. The meaning behind it highlights the importance of understanding the risks associated with investing in the stock market and the need for informed decisions. This image is ideal for use in financial reports, presentations, and articles related to the stock market and investments. Data analysis decrease illustrations Financial Loss: Red Arrows and Bars on Stock Market Chart Showing Downward Trend. This image depicts a financial loss with red arrows and bars on a stock market chart showing a downward trend. The concept conveys the theme of financial decline and loss in the stock market. The arrows and bars symbolize a negative trend in the financial market, indicating a decrease in value of stocks and shares. The image captures the significance of financial loss and the impact it can have on investors and the economy. The meaning behind it highlights the importance of understanding the risks associated with investing in the stock market and the need for informed decisions. This image is ideal for use in financial reports, presentations, and articles related to the stock market and investments.
Free with trial This 3D render shows a calculator with a colorful bar chart made of cubes illustrating growth and success in business and finance. Perfect for presentations and infographics. Data analysis decrease illustrations Colorful 3D Calculator with Growing Bar Chart Cubes for Business and Finance. This 3D render shows a calculator with a colorful bar chart made of cubes illustrating growth and success in business and finance. Perfect for presentations and infographics.
Free with trial A male businessman character holding his temples in the middle of the frame has a stern and worried expression on his face. There is a red graph showing the downtrend of the stock market in the background. Refers to losses from investing in the stock market. Studio shots, clean pastel backgrounds, Pixar style, CGI renders. Data analysis decrease illustrations Male businessman character with a serious and worried expression. A male businessman character holding his temples in the middle of the frame has a stern and worried expression on his face. There is a red graph showing the downtrend of the stock market in the background. Refers to losses from investing in the stock market. Studio shots, clean pastel backgrounds, Pixar style, CGI renders.
Free with trial A male businessman character holding his temples in the middle of the frame has a stern and worried expression on his face. There is a red graph showing the downtrend of the stock market in the background. Refers to losses from investing in the stock market. Studio shots, clean pastel backgrounds, Pixar style, CGI renders. Data analysis decrease illustrations Male businessman character with a serious and worried expression. A male businessman character holding his temples in the middle of the frame has a stern and worried expression on his face. There is a red graph showing the downtrend of the stock market in the background. Refers to losses from investing in the stock market. Studio shots, clean pastel backgrounds, Pixar style, CGI renders.
Free with trial A close-up shot depicts a businessman's hands interacting with a holographic projection of a declining bar graph displayed on his laptop screen. The graph illustrates a significant downward trend, suggesting a negative financial performance or market downturn. The scene is set in a modern office environment, highlighted by a blurred potted plant in the background, adding a touch of natural. Data analysis decrease illustrations Businessman Analyzing Decreasing Stock Market Trend on Laptop, Financial Loss. A close-up shot depicts a businessman's hands interacting with a holographic projection of a declining bar graph displayed on his laptop screen. The graph illustrates a significant downward trend, suggesting a negative financial performance or market downturn. The scene is set in a modern office environment, highlighted by a blurred potted plant in the background, adding a touch of natural
Free with trial A vibrant red line depicts a sharp downward trend across a dynamic, motion-blurred abstract background. Data analysis decrease illustrations Red downward trending graph line on abstract motion blurred background chart. A vibrant red line depicts a sharp downward trend across a dynamic, motion-blurred abstract background
Free with trial Steeply falling graph arrow pointing down dark background sharp decline ruin Ideal for websites and social media. Data analysis decrease illustrations Steeply falling graph, arrow pointing down, dark background, sharp decline, ruin. Steeply falling graph arrow pointing down dark background sharp decline ruin Ideal for websites and social media
Free with trial Circular buttons labeled "BUY" and "SELL" sit on a surface with a glowing stock market chart in the background. The chart features fluctuating orange lines on a dark grid, illustrating price movements and market volatility. The buttons are shiny and metallic, with embossed text, suggesting a dynamic financial environment. The composition emphasizes themes of trading and investment in the stock market. Data analysis decrease illustrations Buy and sell buttons with stock market chart in background, financial concept. Circular buttons labeled "BUY" and "SELL" sit on a surface with a glowing stock market chart in the background. The chart features fluctuating orange lines on a dark grid, illustrating price movements and market volatility. The buttons are shiny and metallic, with embossed text, suggesting a dynamic financial environment. The composition emphasizes themes of trading and investment in the stock market.
Free with trial A neon pink stock market chart with a downward trend and candlestick indicators against a dark blue background, symbolizing financial loss and economic downturn. Data analysis decrease illustrations Neon Pink Stock Market Crash Chart with Candlesticks on Dark Blue Background. A neon pink stock market chart with a downward trend and candlestick indicators against a dark blue background, symbolizing financial loss and economic downturn
Free with trial Business performance decline icon in black circle. Productivity drop and process efficiency loss symbol vector. Data analysis decrease vectors Business performance decline icon in black circle. Productivity drop and process efficiency loss symbol
Free with trial A graph vividly illustrates two contrasting trends, one declining and the other rising, captured with sharp focus and rich orange tones creating a dynamic visual. Data analysis decrease illustrations Dynamic Trends Represented Through Contrasting Lines in a Vibrant Orange Graph. A graph vividly illustrates two contrasting trends, one declining and the other rising, captured with sharp focus and rich orange tones creating a dynamic visual
Free with trial Power lines and electricity pylons reflected on wet ground at sunset with a superimposed stock market graph showing decreasing energy prices. Data analysis decrease illustrations Electricity market graph showing decreasing energy prices at sunset. Power lines and electricity pylons reflected on wet ground at sunset with a superimposed stock market graph showing decreasing energy prices
Free with trial Analyzing Dynamic Stock Market Trends with Red Graph Lines on Black Background. Generative AI. Data analysis decrease illustrations Analyzing Dynamic Stock Market Trends with Red Graph Lines on Black Background
Free with trial Power lines and electricity pylons reflected on wet ground at sunset with a superimposed stock market graph showing decreasing energy prices. Data analysis decrease illustrations Electricity market graph showing decreasing energy prices at sunset. Power lines and electricity pylons reflected on wet ground at sunset with a superimposed stock market graph showing decreasing energy prices
Free with trial Hand drawn bar graph showing a downward trend with an arrow indicating decline. Data analysis decrease vectors Hand drawn bar graph showing a downward trend with an arrow indicating decline
Free with trial Pointing to Graph Showing the Trend of Fluctuations in Financial Stock Values , vibrant highlights. Data analysis decrease illustrations Pointing to Graph Showing the Trend of Fluctuations in Financial Stock Values
Free with trial A person is holding a cell phone that is displaying a graph. The graph shows a downward trend, which could indicate a decrease in value or a negative outcome. Data analysis decrease illustrations A person is holding a cell phone that is displaying a graph
Free with trial Red arrow points down on a financial chart signaling market decline representing losses, and recession Use for illustrating economic downturns and financial instability. Data analysis decrease illustrations Downward Stock Market Trend Red Arrow and Chart Decline Indicator. Red arrow points down on a financial chart signaling market decline representing losses, and recession Use for illustrating economic downturns and financial instability
Free with trial A clean, black, vector icon of a magnifying glass. The magnifying glass has a thick outline and a simple handle. Inside the lens area, there is a horizontal black line representing a minus symbol, indicating a zoom-out function. The icon is presented on a white background. Data analysis decrease illustrations Simple Black Magnifying Glass Icon with Minus Symbol for Zoom Out search find. A clean, black, vector icon of a magnifying glass. The magnifying glass has a thick outline and a simple handle. Inside the lens area, there is a horizontal black line representing a minus symbol, indicating a zoom-out function. The icon is presented on a white background
Free with trial This 3D rendering shows a dramatic market downturn, with collapsing bars representing a significant economic decline. The falling graph, generated by AI, visually emphasizes the severity of the drop. The scattered cubes further illustrate instability and potential loss. Data analysis decrease illustrations AI-Generated Market Crash Visualization. This 3D rendering shows a dramatic market downturn, with collapsing bars representing a significant economic decline. The falling graph, generated by AI, visually emphasizes the severity of the drop. The scattered cubes further illustrate instability and potential loss.
Free with trial A minimalist workspace features a large monitor displaying a dramatic red stock market crash graph, generated by AI. The image emphasizes the visual impact of a market downturn, showcasing the graph against a clean, modern backdrop. The scene is serene yet carries a powerful message about economic. Data analysis decrease illustrations AI-Generated Market Crash Visualization. A minimalist workspace features a large monitor displaying a dramatic red stock market crash graph, generated by AI. The image emphasizes the visual impact of a market downturn, showcasing the graph against a clean, modern backdrop. The scene is serene yet carries a powerful message about economic
Free with trial Falling red forex candlestick chart on black background. Global economic recession, stock market crash, inflation concept. 3D Rendering. Data analysis decrease illustrations Falling red forex candlestick chart on black background. Global economic recession, stock market crash, inflation concept. 3D
Free with trial A computer screen displays a sharply declining red graph, indicative of a market crash. This 3D-rendered image, generated by AI, illustrates the dramatic visual representation of financial downturn. The image serves as a powerful symbol of economic instability and risk. Data analysis decrease illustrations AI-Generated Market Crash Visualization. A computer screen displays a sharply declining red graph, indicative of a market crash. This 3D-rendered image, generated by AI, illustrates the dramatic visual representation of financial downturn. The image serves as a powerful symbol of economic instability and risk.
Free with trial A cracked wall reveals a falling stock market graph, generated by AI. This striking image symbolizes market instability and the fragility of financial systems. The red color emphasizes the severity of the downturn, while the broken wall portrays the devastating consequences. Data analysis decrease illustrations Market Crash: AI-Generated Visualization. A cracked wall reveals a falling stock market graph, generated by AI. This striking image symbolizes market instability and the fragility of financial systems. The red color emphasizes the severity of the downturn, while the broken wall portrays the devastating consequences.
Free with trial Decreasing Bar Chart with Falling Arrow Illustrates Economic Downturn, Recession. Data analysis decrease vectors Decreasing Bar Chart with Falling Arrow Illustrates Economic Downturn, Recession
Free with trial Illustrated magnifying glass with a minus symbol representing zoom out function. Data analysis decrease vectors Illustrated magnifying glass with a minus symbol representing zoom out function
Free with trial Percentage symbol icon in circle shape abstract concept for discount or finance. Data analysis decrease vectors Percentage symbol icon in circle shape abstract concept for discount or finance
Free with trial Steeply falling graph arrow pointing down dark background collapse devastation Perfect for blogs, articles, and online content. Data analysis decrease illustrations Steeply falling graph, arrow pointing down, dark background, collapse, devastation. Steeply falling graph arrow pointing down dark background collapse devastation Perfect for blogs, articles, and online content
Free with trial Bear market stock chart illustration. It features strong, financial decline. It serves to visualize the concept of financial downturn. Data analysis decrease illustrations Bear market and stock chart illustration symbolizes financial risk and investment trend. Bear market stock chart illustration. It features strong, financial decline. It serves to visualize the concept of financial downturn
Free with trial Close up of laptop keyboard with bank card and downward red crisis chart grid on blurry concrete wall background. Recession and economic fall concept. Double exposure. Data analysis decrease illustrations Close up of laptop keyboard with bank card and downward red crisis chart grid on blurry concrete wall background. Recession and
Free with trial Bar graph with downward trend, arrows indicating loss, and coins falling. Ideal for finance, economics, business, investment, budgeting revenue loss and decline concepts. Simple flat metaphor. Data analysis decrease illustrations Revenue Decline Illustration with Bar Graph, Arrows, and Falling Coins Symbolizing Financial Loss. Bar graph with downward trend, arrows indicating loss, and. Bar graph with downward trend, arrows indicating loss, and coins falling. Ideal for finance, economics, business, investment, budgeting revenue loss and decline concepts. Simple flat metaphor
Free with trial Graph going Up and Down with red arrows vector. Blue chart bar vector illustration concept of sales bar chart symbol icon with arrow moving down and sales bar chart with arrow moving up. Data analysis decrease vectors Graph going Up and Down with red arrows vector. Blue chart bar vector illustration concept of sales bar chart symbol icon
Free with trial Illustration of descending financial chart background for business presentations, Generated by AI. Data analysis decrease illustrations Illustration of descending financial chart background for business presentations
Free with trial A hand in a suit holds a glowing red bar graph with a downward arrow indicating a decline. The image is lit with red and blue light. Data analysis decrease illustrations Hand holding glowing red downward trending bar graph with arrow chart business. A hand in a suit holds a glowing red bar graph with a downward arrow indicating a decline. The image is lit with red and blue light
Free with trial Illustration of a baby stroller interwoven with statistical graphs representing demographic trends, particularly highlighting declining birth rates and societal focus on family-related economics. Data analysis decrease illustrations Baby stroller illustration with declining demographic trends and graphical analytics. Illustration of a baby stroller interwoven with statistical graphs representing demographic trends, particularly highlighting declining birth rates and societal focus on family-related economics
Free with trial Bar chart showing a steep downward trend and a descending arrow indicating decline. Data analysis decrease vectors Bar chart showing a steep downward trend and a descending arrow indicating decline
Free with trial A simple vector illustration of a graph showing a sharp downward trend, representing a financial crisis or market decline. Perfect for illustrating economic downturn concepts. Data analysis decrease vectors Trending Downward Graph Financial Crisis Icon Stock Market Decline Illustration. A simple vector illustration of a graph showing a sharp downward trend, representing a financial crisis or market decline. Perfect for illustrating economic downturn concepts.
Free with trial Close up of hands using laptop with downward red crisis chart grid on blurry background. Recession and economic fall concept. Double exposure. Data analysis decrease illustrations Close up of hands using laptop with downward red crisis chart grid on blurry background. Recession and economic fall concept.
Free with trial Digital globe with rising and falling stock market trends, represented by red and blue lines, symbolizing global financial fluctuations and economic uncertainty in a high-tech, futuristic style. Data analysis decrease illustrations Global Market Fluctuations: A Digital Earth with Rising and Falling Stock Trends. Digital globe with rising and falling stock market trends, represented by red and blue lines, symbolizing global financial fluctuations and economic uncertainty in a high-tech, futuristic style
Free with trial Graph going Up and Down with green and red arrows vector. Blue chart bar vector illustration concept of sales bar chart symbol icon with arrow moving down and sales bar chart with arrow moving up. Data analysis decrease vectors Graph going Up and Down with green and red arrows vector. Blue chart bar vector illustration concept of sales bar chart symbol. Graph going Up and Down with green and red arrows vector. Blue chart bar vector illustration concept of sales bar chart symbol icon with arrow moving down and sales bar chart with arrow moving up.
Free with trial Red market decline graph on desk, glasses, tablet showing losses, office background, detailed background Generative AI. Data analysis decrease illustrations Red market decline graph on desk, glasses, tablet showing losses, office background
Free with trial Chart decline icon. Market loss symbol. Vector trend design. Black background shape. EPS 10. Data analysis decrease vectors Chart decline icon. Market loss symbol. Vector trend design. Black background shape.
Free with trial Downward arrow with decreasing bar graph alongside neutral, happy, and sad emotion faces. Ideal for emotional feedback, metrics, performance, business evaluation, impact loss failure. A simple flat. Data analysis decrease vectors Decline in Performance Represented by Downward Arrow, Graph Bars, and Varying Emotional Expressions. Downward arrow with decreasing bar graph alongside neutral, happy, and sad emotion faces. Ideal for emotional feedback, metrics, performance, business evaluation, impact loss failure. A simple flat
Free with trial A minimalist 3D bar chart rendered in white against a bright white background. The chart displays four bars of decreasing height, visually representing a sharp downward trend. A prominent white arrow, also pointing downwards, overlays the bars, emphasizing the decline. The composition is clean and abstract, suitable for representing financial or economic downturns. Data analysis decrease illustrations White 3D Bar Chart Showing a Sharp Downward Trend with Arrow on White Background graph. A minimalist 3D bar chart rendered in white against a bright white background. The chart displays four bars of decreasing height, visually representing a sharp downward trend. A prominent white arrow, also pointing downwards, overlays the bars, emphasizing the decline. The composition is clean and abstract, suitable for representing financial or economic downturns