Free with trial Domino effect concept icon showing a declining bar chart representing financial crisis and recession. Data analysis decrease vectors Domino effect concept icon showing a declining bar chart representing financial crisis and recession
Free with trial Generative ai, The image is of a red arrow pointing down, superimposed on a blue and red bar graph, symbolizing a downward trend, potentially indicating a financial or economic decline. Data analysis decrease illustrations A large red arrow points downwards over a gridded financial chart showing a sharp decline in value, with the bars of the chart. generative ai, The image is of a red arrow pointing down, superimposed on a blue and red bar graph, symbolizing a downward trend, potentially indicating a financial or economic decline
Free with trial Row of gray houses with garages. Real estate market with moderate housing prices. Perfect suburban neighborhood with landscaped front yards green trees under cloudy sky. Homes. Data analysis decrease illustrations Row of gray houses with garages. Real estate market with moderate housing prices. Perfect suburban neighborhood with landscaped
Free with trial Dramatic Financial Illustration Showcasing Stock Market Fluctuations and Crisis Indicators on Screen, Generated by AI. Data analysis decrease illustrations Dramatic Financial Illustration Showcasing Stock Market Fluctuations and Crisis Indicators on Screen
Free with trial This graph illustrates a compelling visual narrative, showcasing a sharp rise alongside a notable decline, created with vibrant gradient colors. Data analysis decrease illustrations Graphical Representation of Contrasting Trends in Vibrant Gradient Hues Revealing Significant Changes. This graph illustrates a compelling visual narrative, showcasing a sharp rise alongside a notable decline, created with vibrant gradient colors
Free with trial Businessman holds smartphone displaying an image of a global economic recession, with a red downward pointing arrow and a declining employment graph, signifying an economic crisis, financial losses. Data analysis decrease illustrations Businessman holds smartphone displaying an image of a global economic recession, with a red downward pointing arrow and a. Declining employment graph. Businessman holds smartphone displaying an image of a global economic recession, with a red downward pointing arrow and a declining employment graph, signifying an economic crisis, financial losses
Free with trial Concept of falling interest rates, showing a descending graph and coins dropping, illustrating economic impact and financial trends. Data analysis decrease illustrations Falling Interest Rates with Graph and Coins Symbolizing Impact. Concept of falling interest rates, showing a descending graph and coins dropping, illustrating economic impact and financial trends
Free with trial Concept of falling interest rates, showing a descending graph and coins dropping, illustrating economic impact and financial trends. Data analysis decrease illustrations Falling Interest Rates with Graph and Coins Symbolizing Impact. Concept of falling interest rates, showing a descending graph and coins dropping, illustrating economic impact and financial trends
Free with trial Concept of falling interest rates, showing a descending graph and coins dropping, illustrating economic impact and financial trends. Data analysis decrease illustrations Falling Interest Rates with Graph and Coins Symbolizing Impact. Concept of falling interest rates, showing a descending graph and coins dropping, illustrating economic impact and financial trends
Free with trial Concept of falling interest rates, showing a descending graph and coins dropping, illustrating economic impact and financial trends. Data analysis decrease illustrations Falling Interest Rates with Graph and Coins Symbolizing Impact. Concept of falling interest rates, showing a descending graph and coins dropping, illustrating economic impact and financial trends
Free with trial A bold red arrow sharply declines in a zigzag pattern, symbolizing a steep drop in performance or value. This visual powerfully conveys financial loss, economic downturn, or negative trends. Data analysis decrease illustrations Red arrow descending sharp decline downward trend graph represents financial loss economic downturn. A bold red arrow sharply declines in a zigzag pattern, symbolizing a steep drop in performance or value. This visual powerfully conveys financial loss, economic downturn, or negative trends
Free with trial Close up magnifying glass on red spreadsheet cells economic slump downward trend statistics downturn Ideal for websites and social media. Data analysis decrease illustrations Close up magnifying glass on red spreadsheet cells, economic slump, downward trend, statistics, downturn. Close up magnifying glass on red spreadsheet cells economic slump downward trend statistics downturn Ideal for websites and social media
Free with trial A 3D rendering depicting a downward trending bar graph topped with houses symbolizing a decrease in property values and a potential housing market slump or economic decline. Data analysis decrease illustrations Real estate market downturn graph visualizing declining housing values and economic recession trends. A 3D rendering depicting a downward trending bar graph topped with houses symbolizing a decrease in property values and a potential housing market slump or economic decline
Free with trial Business person analyzes financial charts, market trends and investment strategies for economic growth ,Generative ai. Data analysis decrease illustrations Business person analyzes financial charts, market trends and investment strategies for economic growth
Free with trial This dynamic 3D visualization showcases a dramatic downward trend, depicted by numerous red arrows pointing downwards. The graphic effectively illustrates a decline in various economic indicators, such as stock market performance, negative growth, and business loss. The intense red color strongly emphasizes the negative impact, suggesting a potential stock market crash, a significant economic. Data analysis decrease illustrations 3D Rendered Red Arrow Graph Visualizing a Downward Trend in Financial Markets and Business Performance. This dynamic 3D visualization showcases a dramatic downward trend, depicted by numerous red arrows pointing downwards. The graphic effectively illustrates a decline in various economic indicators, such as stock market performance, negative growth, and business loss. The intense red color strongly emphasizes the negative impact, suggesting a potential stock market crash, a significant economic
Free with trial A visual representation of india's economic downturn, showing a declining graph and financial crisis. it highlights the business decline and recession impacting the nation's economy and market trends. Data analysis decrease illustrations Understanding india economic recession and financial crisis with falling graph and business decline chart. a visual representation of india's economic downturn, showing a declining graph and financial crisis. it highlights the business decline and recession impacting the nation's economy and market trends.
Free with trial Hand drawing a downward trend graph with a yellow marker on a dark blackboard representing financial decline and economic downturn concepts. Bar chart visualization. Data analysis decrease illustrations Hand Drawing Downward Trend Graph With Yellow Marker On Dark Blackboard Representing Financial Decline. Hand drawing a downward trend graph with a yellow marker on a dark blackboard representing financial decline and economic downturn concepts. Bar chart visualization
Free with trial A red stock market chart showing a sharp decline with a bar graph against a dark background, illustrating a financial crisis or economic downturn. Data analysis decrease illustrations Red Stock Market Chart Plunging - Financial Downturn and Crisis Visualization Depicts Declining Bar Graph. A red stock market chart showing a sharp decline with a bar graph against a dark background, illustrating a financial crisis or economic downturn
Free with trial Businessman analyzes the stock exchange market, which is declining because the prices of goods are increasing. Desperate to lose money due to crisis, recession, inflation. Inflation concept. trend modern vector flat illustration. Data analysis decrease vectors Businessman analyzes the stock exchange market, which is declining because the prices of goods are increasing.
Free with trial A red bar chart against a dark background showing a significant stock market decline. The image suggests financial crisis, risk, and economic downturn, suitable for business and financial related content. Data analysis decrease illustrations Red Stock Market Chart Plunging During Financial Crisis with dark background illustrating sharp decline. A red bar chart against a dark background showing a significant stock market decline. The image suggests financial crisis, risk, and economic downturn, suitable for business and financial related content
Free with trial Red arrow pointing downwards signifies a negative trend in business finance and the economy indicating potential losses market decline or economic recession represented visually with a graph chart. Data analysis decrease illustrations Red arrow trending downward represents financial loss and economic recession in a business graph chart. Red arrow pointing downwards signifies a negative trend in business finance and the economy indicating potential losses market decline or economic recession represented visually with a graph chart
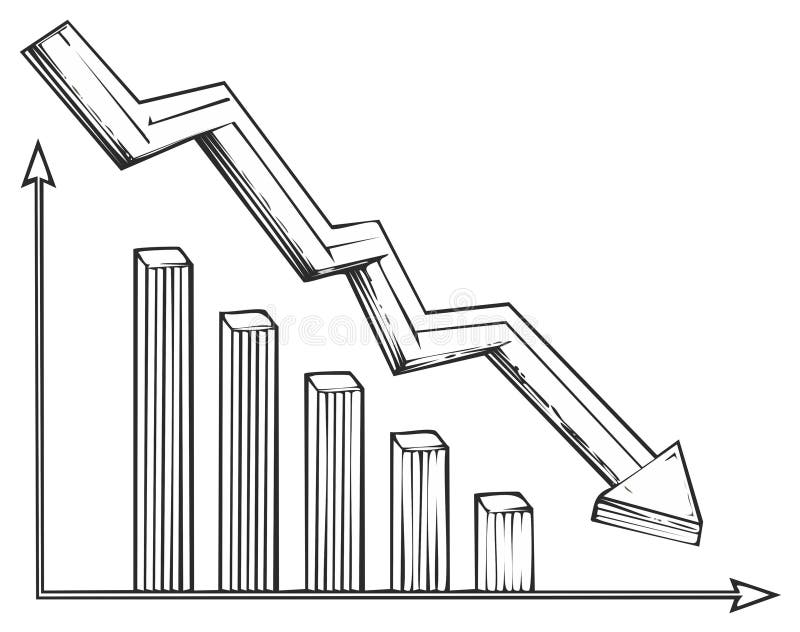
Free with trial Hand drawn falling graph line over declining bar chart representing economic recession and business loss. Data analysis decrease vectors Hand drawn falling graph line over declining bar chart representing economic recession and business loss
Free with trial Generative ai, The image shows a blue grid with a red arrow pointing downward, indicating a decline, against a blue background, highlighting the concept of a downward trend. Data analysis decrease illustrations The image is a stock market chart showing a red arrow pointing down on a blue grid background with blue bar graphs. The arrow is. generative ai, The image shows a blue grid with a red arrow pointing downward, indicating a decline, against a blue background, highlighting the concept of a downward trend
Free with trial Vector illustration of a graph with a downward arrow, representing decline or negative growth. Data analysis decrease vectors Professional Graph with Arrow Down Outline Icon Vector Illustration. Vector illustration of a graph with a downward arrow, representing decline or negative growth.
Free with trial Vector illustration of a graph with a downward arrow, representing decline or negative growth. Data analysis decrease vectors Professional Graph with Arrow Down Outline Icon Vector Illustration. Vector illustration of a graph with a downward arrow, representing decline or negative growth.
Free with trial Vector illustration of a graph with a downward arrow, representing decline or negative growth. Data analysis decrease vectors Professional Graph with Arrow Down Outline Icon Vector Illustration. Vector illustration of a graph with a downward arrow, representing decline or negative growth.
Free with trial Hand drawn bar chart with a downward red arrow and sale tag illustrating a business recession or price drop. Data analysis decrease vectors Hand drawn bar chart with a downward red arrow and sale tag illustrating a business recession or price drop
Free with trial Three light-blue cylindrical shapes, vertically arranged, forming a bar graph, against a pale teal background. Data analysis decrease illustrations Three light-blue cylindrical shapes, vertically arranged, forming a bar graph, against a pale teal background
Free with trial A red themed illustration showing a stock market crash with a downtrend graph and arrows pointing downwards. it represents financial crisis, recession, and business failure. investment loss is shown. Data analysis decrease illustrations Red stock market crash graph downtrend financial crisis recession loss investment chart business failure. a red themed illustration showing a stock market crash with a downtrend graph and arrows pointing downwards. it represents financial crisis, recession, and business failure. investment loss is shown
Free with trial A dark gray triangle with a horizontal double-headed arrow above it, symbolizing growth, reduction, or opposing forces. Data analysis decrease illustrations Geometric diagram illustrating expansion or contraction with a central triangle and bidirectional arrows. A dark gray triangle with a horizontal double-headed arrow above it, symbolizing growth, reduction, or opposing forces
Free with trial Colorful 3D bar graph illustrating contrasting trends: growth and decline. Symbolizes business fluctuations, market volatility, economic change, opposing forces, and progress. Ideal for promoting your services or creating eye-catching visuals. Open area for featuring your products, copy space, banner, advertisement. . Generative AI. Data analysis decrease illustrations Rising and Falling Bar Graph Colorful 3D bar graph illustrating contrasting trends growth and decline Symbolizes business. Colorful 3D bar graph illustrating contrasting trends: growth and decline. Symbolizes business fluctuations, market volatility, economic change, opposing forces, and progress. Ideal for promoting your services or creating eye-catching visuals. Open area for featuring your products, copy space, banner, advertisement. . Generative AI
Free with trial Visualizing cost reduction strategies in business, a hand places an arrow indicating decreasing costs on a graph, highlighting financial management and efficiency. 200 chars. Data analysis decrease illustrations Reduce costs strategy business finance management budget planning investment savings efficiency 100 chars. visualizing cost reduction strategies in business, a hand places an arrow indicating decreasing costs on a graph, highlighting financial management and efficiency. 200 chars
Free with trial Declining Bar Chart: Representing Loss, Reduction, and Negative Trends with a Downward-Pointing Arrow Graphic. Data analysis decrease vectors Declining Bar Chart: Representing Loss, Reduction, and Negative Trends with a Downward-Pointing Arrow Graphic
Free with trial Young businessman analyzing a descending financial candlestick chart on a computer screen. Financial Instability concept. trend modern vector flat illustration. Data analysis decrease vectors Young businessman analyzing a descending financial candlestick chart on a computer screen. Financial Instability concept.
Free with trial A visual representation of financial decline, this graphic features a bar chart with decreasing heights, topped by a sharp red arrow pointing downwards, symbolizing economic downturn. Data analysis decrease illustrations Business bar chart graph shows downward trend with red arrow indicating loss isolated on white background. A visual representation of financial decline, this graphic features a bar chart with decreasing heights, topped by a sharp red arrow pointing downwards, symbolizing economic downturn
Free with trial Purple-toned financial visualization depicting stock market volatility, candlestick graph overlaying New York City skyline with currency indicators. Data analysis decrease illustrations Candlestick chart showing stock market volatility with New York City skyline and dollar signs, in purple monochrome. Purple-toned financial visualization depicting stock market volatility, candlestick graph overlaying New York City skyline with currency indicators
Free with trial Vector illustration of a decreasing bar chart with a downward trend arrow showing financial loss or recession. Data analysis decrease vectors Vector illustration of a decreasing bar chart with a downward trend arrow showing financial loss or recession
Free with trial Computer display showing a downward trending graph depicting loss or decline in business or finance hand drawn. Data analysis decrease vectors Computer display showing a downward trending graph depicting loss or decline in business or finance hand drawn
Free with trial Glowing orange graph showing a downward market trend breaks through a dark surface, symbolizing decline and loss. Generated with an AI. Data analysis decrease illustrations Glowing orange graph showing a downward market trend breaks through a dark surface, symbolizing decline and loss
Free with trial Digital tablet displaying a downward trending bar chart and arrow icon symbolizing financial loss or decline. Data analysis decrease vectors Digital tablet displaying a downward trending bar chart and arrow icon symbolizing financial loss or decline
Free with trial Glowing red 2025 number and falling stock market chart. Finance concept background, business vision stock market prediction and investment opportunity for next year. Data analysis decrease illustrations Glowing red 2025 number and falling stock market chart. Finance concept background, business vision, stock market prediction and. Glowing red 2025 number and falling stock market chart. Finance concept background, business vision stock market prediction and investment opportunity for next year.
Free with trial Generative ai, The image shows a red bar graph and a red arrow pointing down on a red grid background, illustrating a significant downward trend. Data analysis decrease illustrations The image shows a red and white arrow pointing down in front of a red grid background with a series of 3D red bars depicting. generative ai, The image shows a red bar graph and a red arrow pointing down on a red grid background, illustrating a significant downward trend
Free with trial A monitor displays a downward trending bar graph, symbolizing financial loss or economic decline. The visual representation emphasizes negative trends and potential risks. Data analysis decrease vectors Vector art of monitor displaying a downward trending bar graph, indicating financial loss or economic decline. A monitor displays a downward trending bar graph, symbolizing financial loss or economic decline. The visual representation emphasizes negative trends and potential risks
Free with trial Animated Stream Of Interfaces With Economic and stock information in blue color. Data analysis decrease illustrations Animated Stream Of Interfaces With Economic and stock information in blue color
Free with trial Animated Stream Of Interfaces With Economic and stock information in blue color. Data analysis decrease illustrations Animated Stream Of Interfaces With Economic and stock information in blue color
Free with trial Animated Stream Of Interfaces With Economic and stock information in blue color. Data analysis decrease illustrations Animated Stream Of Interfaces With Economic and stock information in blue color
Free with trial Animated Stream Of Interfaces With Economic and stock information in blue color. Data analysis decrease illustrations Animated Stream Of Interfaces With Economic and stock information in blue color
Free with trial Animated Stream Of Interfaces With Economic and stock information in blue color. Data analysis decrease illustrations Animated Stream Of Interfaces With Economic and stock information in blue color
Free with trial A compilation of minimalist line art icons visually representing various financial concepts, including upward and downward market trends, investment growth, and economic indicators. Data analysis decrease vectors Collection of line art icons representing financial growth and market trends, isolated on transparent background. A compilation of minimalist line art icons visually representing various financial concepts, including upward and downward market trends, investment growth, and economic indicators
Free with trial A visual representation of a financial downturn. The red graph and arrows symbolize market decline, economic recession, and potential business failure, highlighting investment risks and negative trends. Data analysis decrease illustrations Red graph chart falling down financial crisis stock market crash economic recession business failure concept. A visual representation of a financial downturn. The red graph and arrows symbolize market decline, economic recession, and potential business failure, highlighting investment risks and negative trends.
Free with trial This dynamic image showcases the impact of tariffs on global trade, featuring various products and national flags. The visualization, generated by AI, demonstrates the complex interplay of international commerce and economic policy, illustrating potential price increases and decreases resulting fro. Data analysis decrease illustrations Global Trade & Tariff Visualization. This dynamic image showcases the impact of tariffs on global trade, featuring various products and national flags. The visualization, generated by AI, demonstrates the complex interplay of international commerce and economic policy, illustrating potential price increases and decreases resulting fro
Free with trial A red bar chart showing a significant decline in the stock market. The graph is set against a dark background, emphasizing the concept of financial crisis. The sharp decline and red color convey a sense of loss and market instability. Data analysis decrease illustrations Red Stock Market Decline with Bar Chart on Dark Background Financial Crisis Concept. A red bar chart showing a significant decline in the stock market. The graph is set against a dark background, emphasizing the concept of financial crisis. The sharp decline and red color convey a sense of loss and market instability
Free with trial Generative ai, The image shows a bar chart with a red arrow pointing down, indicating a downward trend in a financial market. The glowing blue bars represent rising values, while the red arrow signifies a drop in value,. Data analysis decrease illustrations The image shows a blue and red graph with a red arrow pointing downwards, illustrating a decline in a company stock price. generative ai, The image shows a bar chart with a red arrow pointing down, indicating a downward trend in a financial market. The glowing blue bars represent rising values, while the red arrow signifies a drop in value,
Free with trial Generative ai, The image shows a red tiled wall with a white arrow pointing down and a red bar graph that is decreasing in height. The background is a red tiled wall with white lines, and the floor is a red shiny surface with the reflection of the g. Data analysis decrease illustrations The image shows a red bar graph with a white arrow pointing downwards, representing a declining trend. The graph is set against a. generative ai, The image shows a red tiled wall with a white arrow pointing down and a red bar graph that is decreasing in height. The background is a red tiled wall with white lines, and the floor is a red shiny surface with the reflection of the g
Free with trial Business icons collection is a vector illustration with editable stroke. Data analysis decrease vectors Business icons collection is a vector illustration with editable stroke.
Free with trial Businessmen hold coins, run on stack of money in bar chart. Complete of business competiition, pursuit of economic success, financial management, capital market performance, and profit growth. Data analysis decrease vectors Businessmen hold coins, run on stack of money in bar chart. Complete of business competiition, pursuit of economic success
Free with trial A bar chart with a downward-pointing red arrow and decreasing black bars symbolizing loss and failure. Finance, business, and economics concept. Data analysis decrease illustrations A bar chart with a downward-pointing red arrow and decreasing black bars symbolizing loss and failure. Finance, business, and
Free with trial Illustration of economic crisis, financial background. Stacks gold coins, US dollars with falling financial graph chart, global economic recession. Stock market crash, investment risk. Data analysis decrease illustrations Illustration of economic crisis, financial background. Stacks gold coins, US dollars with falling financial graph chart, global
Free with trial Witness the dynamic energy of the modern financial world in this captivating image. A digital display showcases a thriving stock market, complete with upward trends in financial charts and a stack of coins symbolizing wealth accumulation. The computer screen, the central focus, displays a complex array of financial graphs, highlighting market fluctuations and growth indicators. This visual. Data analysis decrease illustrations Stock Market Growth A Thriving Investment Landscape Visualized on a Computer Screen with Stacked Coins Charts and. Witness the dynamic energy of the modern financial world in this captivating image. A digital display showcases a thriving stock market, complete with upward trends in financial charts and a stack of coins symbolizing wealth accumulation. The computer screen, the central focus, displays a complex array of financial graphs, highlighting market fluctuations and growth indicators. This visual
Free with trial Bitcoin resting on top of a graph representing fluctuations in value, Trading bitcoins trending, Simple and minimalist flat Vector Illustration. Data analysis decrease vectors Bitcoin resting on top of a graph representing fluctuations in value, Trading bitcoins trending, Simple and minimalist flat Vector
Free with trial A businessman holds a coin, runs on stack of money in bar chart. Concepts of business development, pursuit of economic success, financial management, capital market performance, and profit growth. Data analysis decrease vectors A businessman holds a coin, runs on stack of money in bar chart. Concepts of business development, pursuit of economic success
Free with trial Businessman analyzes office management. The performance concept improves quality, speed, and efficiency and reduces costs. Cost Reduction concept. trend modern vector flat illustration. Data analysis decrease vectors Businessman analyzes office management. The performance concept improves quality, speed, and efficiency and reduces costs.
Free with trial Upward and downward arrows with a percentage symbol. An illustration of arrows pointing up and down, often used to represent changes, fluctuations, or progress, along with a percentage symbol. Data analysis decrease vectors Upward and Downward Arrows with Percentage, Financial Growth and Decline Concept. Upward and downward arrows with a percentage symbol. An illustration of arrows pointing up and down, often used to represent changes, fluctuations, or progress, along with a percentage symbol.
Free with trial Crumbling bar graph made of earth-colored material, symbolizing decline or instability, stands among broken debris on a plain background. Data analysis decrease illustrations A collapsed bar graph made of earth-colored material, symbolizing decline or instability, is set amid broken debris. crumbling bar graph made of earth-colored material, symbolizing decline or instability, stands among broken debris on a plain background.
Free with trial Set of linear graphs with red and blue lines showing different trends and dynamics vector illustration. Change in time of election results or income. For business analytics, financial reports. Data analysis decrease vectors Set of linear graphs with red and blue lines showing different trends and dynamics vector illustration. Change in time of election
Free with trial Visualizes the economic downturn in india with a declining chart and arrow. Illustrates financial crisis, market crash, and investment losses. Represents a business downfall and trade decline. Data analysis decrease illustrations India economy recession chart financial crisis stock market crash business downfall investment loss trade decline. visualizes the economic downturn in india with a declining chart and arrow. Illustrates financial crisis, market crash, and investment losses. Represents a business downfall and trade decline.
Free with trial This compelling stock image showcases a stark red arrow pointing downwards, a powerful visual representation of decline. The minimalist design focuses solely on the downward trend, making the message of negative movement immediately apparent. Perfect for conveying a range of concepts, from a downturn in business performance to a falling market share or a project that's fallen behind schedule. Data analysis decrease illustrations Visualizing Declining Trends A Minimalist Stock Photo of a Dramatic Red Arrow Down Illustrating Business Performance. This compelling stock image showcases a stark red arrow pointing downwards, a powerful visual representation of decline. The minimalist design focuses solely on the downward trend, making the message of negative movement immediately apparent. Perfect for conveying a range of concepts, from a downturn in business performance to a falling market share or a project that's fallen behind schedule.
Free with trial Two hands cradle glowing symbols. On the left, a percentage sign emanates warmth and light, while the right hand holds an upward-trending graph, symbolizing growth. Tiny, shimmering particles float between them, suggesting the exchange of financial concepts. Created ai. Data analysis decrease illustrations Boost your business success with strategic financial growth and rising interest rates now with this dynamic composition. Two hands cradle glowing symbols. On the left, a percentage sign emanates warmth and light, while the right hand holds an upward-trending graph, symbolizing growth. Tiny, shimmering particles float between them, suggesting the exchange of financial concepts. Created ai
Free with trial Businessmen hold banknotes, run on stack of money in bar chart. Complete of business competiition, pursuit of economic success, financial management, capital market performance, and profit growth. Data analysis decrease vectors Businessmen hold banknotes, run on stack of money in bar chart. Complete of business competiition, pursuit of economic success
Free with trial An interest rate percentage sign with a downward trend arrow in the sky. illustrating the effects on the economy, Generated AI. Data analysis decrease illustrations An interest rate percentage sign with a downward trend arrow in the sky, illustrating the effects on the economy, Generated AI
Free with trial Wooden blocks show opposing directional arrows, contrasting trends choices. One block features red up arrow, black down arrow, representing progress decline. Symbols convey concepts of. Data analysis decrease illustrations Wooden blocks show opposing directional arrows, contrasting trends choices. One block features red up arrow, black down arrow
Free with trial Businessman pointing at a digital interface with interactive graphs representing quality and cost, with arrows indicating trends�quality is increasing while cost is decreasing, illustrating a business performance improvement. Data analysis decrease illustrations Businessman interacting with digital interface showing quality and cost graphs with arrows pointing up and down. businessman pointing at a digital interface with interactive graphs representing quality and cost, with arrows indicating trends�quality is increasing while cost is decreasing, illustrating a business performance improvement
Free with trial Inflation graph shows rising costs. Recession question mark graph indicates economic decline. Concepts of market fluctuation, financial crisis and budget challenges. Data analysis decrease illustrations Inflation graph shows rising costs. Recession question mark graph indicates economic decline. Concepts of market fluctuation
Free with trial Abstract red background, black graph line, decline, instability, financial crisis. Symbolizes risk, uncertainty, downward trend. Can be used for display or montage your products. Generative AI. Data analysis decrease illustrations Red Market Trend Abstract red background black graph line decline instability financial crisis Symbolizes risk uncertainty. Abstract red background, black graph line, decline, instability, financial crisis. Symbolizes risk, uncertainty, downward trend. Can be used for display or montage your products. Generative AI
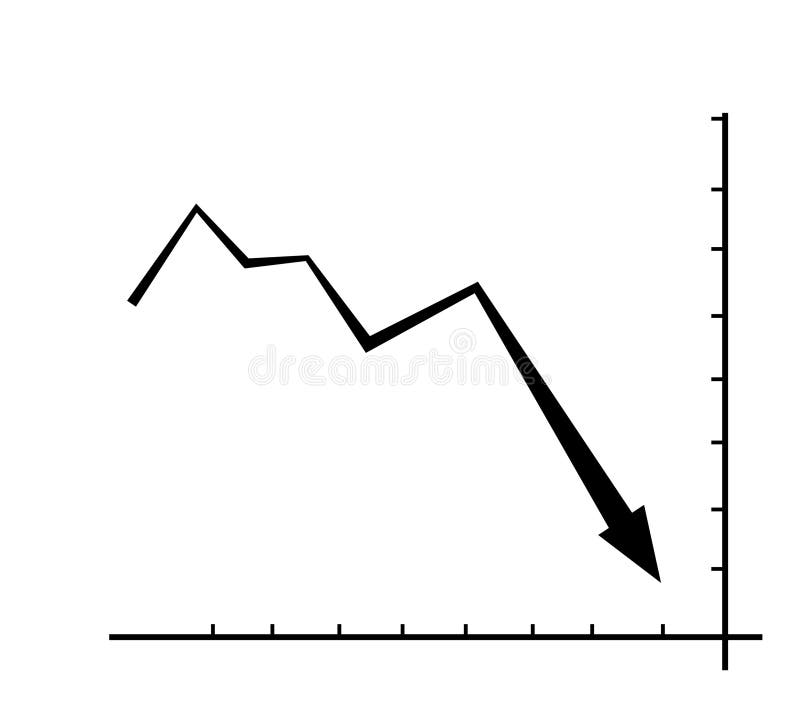
Free with trial Black and white descending graph diagram. loss or decline. flat design style. Suitable for use in reports, illustrations, presentations, etc. vector design template. Data analysis decrease vectors Black and white descending graph diagram. loss or decline. flat design style. Suitable for use in reports, illustrations
Free with trial Bar graph showing GDP growth and decline, with flag icons representing countries. Generative Ai. Data analysis decrease illustrations Bar graph showing GDP growth and decline, with flag icons representing countries
Free with trial Vibrant red line indicates financial market decline on digital display. Chart shows stock market loss, economy decay, investment risk. Red graph pattern represents trading volatility. Data analysis decrease illustrations Vibrant red line indicates financial market decline on digital display. Chart shows stock market loss, economy decay, investment
Free with trial Red stock chart with values sharply declining, highlighting financial crisis economic recession. Dramatic fall in market values is emphasized against dark background. Business and. Data analysis decrease illustrations Red stock chart with values sharply declining, highlighting financial crisis, economic recession. Dramatic fall in market values. Red stock chart with values sharply declining, highlighting financial crisis economic recession. Dramatic fall in market values is emphasized against dark background. Business and.
Free with trial A set of linear icons depicting financial growth, including upward arrows, charts, and currency symbols, representing economic progress and investment trends on white. Data analysis decrease vectors Vector art of financial growth icons a collection of symbols representing economic progress, investment, and market trends. A set of linear icons depicting financial growth, including upward arrows, charts, and currency symbols, representing economic progress and investment trends on white
Free with trial White sugar cubes pile up on dark surface. Blurry financial stock market chart with red green candlestick lines appears in background. Image commodity prices market trends, global. Data analysis decrease illustrations White sugar cubes pile up on dark surface. Blurry financial stock market chart with red green candlestick lines appears in