Free with trial Declining graph icon in line design. decline, graph, chart, analytics, business, decrease, statistics on white background vector. Declining graph editable stroke icon. Data decrease vectors Declining graph icon in line design. decline, graph, chart, analytics, business, decrease, statistics on white background vector
Free with trial A logo for a data visualization service, a simple chart bar forming a sharp, singular peak, vector graphic design on a white background, simple minimalistic style, flat color, sunflower yellow color palette, vector graphics, vector illustration, logo, professional logo, logo design, high-quality graphic designer work, logo icon --chaos 30 --ar 16:9 --v 7 Job ID: a54fbe77-4416-47fc-b767-. Data decrease illustrations Yellow Waveform Graph on White Background, Representing Data, Analytics, or Sound. a logo for a data visualization service, a simple chart bar forming a sharp, singular peak, vector graphic design on a white background, simple minimalistic style, flat color, sunflower yellow color palette, vector graphics, vector illustration, logo, professional logo, logo design, high-quality graphic designer work, logo icon --chaos 30 --ar 16:9 --v 7 Job ID: a54fbe77-4416-47fc-b767-
Free with trial Euro Currency Decrease Icon Set: Financial Decline Symbol vol 34475. Data decrease vectors Euro Currency Decrease Icon Set: Financial Decline Symbol
Free with trial A minimalist black and white icon representing documents with an upward and downward arrow. This graphic symbolizes concepts like report generation, data analysis, growth, decline, upload, download, information flow, and business metrics. It's ideal for presentations, websites, and applications related to finance, business, technology, and data management. Data decrease vectors Document Growth and Data Flow Icon. A minimalist black and white icon representing documents with an upward and downward arrow. This graphic symbolizes concepts like report generation, data analysis, growth, decline, upload, download, information flow, and business metrics. It's ideal for presentations, websites, and applications related to finance, business, technology, and data management.
Free with trial A clean, minimalist icon representing an analytics graph. It features a series of vertical bars of varying heights, symbolizing data or trends. A line graph with circular data points connects the tops of some of the bars, illustrating growth, progress, or fluctuations over time. This graphic is ideal for representing business intelligence, financial data, research, or any concept related to data analysis and performance. Data decrease vectors Analytics Graph Icon with Data Points. A clean, minimalist icon representing an analytics graph. It features a series of vertical bars of varying heights, symbolizing data or trends. A line graph with circular data points connects the tops of some of the bars, illustrating growth, progress, or fluctuations over time. This graphic is ideal for representing business intelligence, financial data, research, or any concept related to data analysis and performance.
Free with trial Decrease : Decrease represents a reduction in value, profit, or financial performance over a specific period. Data decrease vectors Illustration of Decrease. Decrease : Decrease represents a reduction in value, profit, or financial performance over a specific period.
Free with trial The image displays an abstract logo combining a stylized green leaf with four horizontal bars that decrease in length and shade from dark to light green. This design effectively symbolizes concepts of sustainability progress and ecological data visualization. Rendered by Ai, the clean vector graphic is ideal for environmental consulting growth tracking or organic brand identity. It conveys both. Data decrease illustrations Abstract green leaf data progress bar symbol. The image displays an abstract logo combining a stylized green leaf with four horizontal bars that decrease in length and shade from dark to light green. This design effectively symbolizes concepts of sustainability progress and ecological data visualization. Rendered by Ai, the clean vector graphic is ideal for environmental consulting growth tracking or organic brand identity. It conveys both
Free with trial A cartoon woman with brown hair in a ponytail, wearing a blue shirt and red pants, stands confidently between two bar graphs. The green graph on the left shows an increase, while the purple graph on the right shows a decrease. The image is a simple, illustrative representation of data analysis or business concepts. Data decrease vectors Woman Standing Between Two Bar Graphs. A cartoon woman with brown hair in a ponytail, wearing a blue shirt and red pants, stands confidently between two bar graphs. The green graph on the left shows an increase, while the purple graph on the right shows a decrease. The image is a simple, illustrative representation of data analysis or business concepts.
Free with trial Down arrow icon set. Decline decrease symbol. Downward trend sign vector. Data decrease vectors Down arrow icon set. Decline decrease symbol. Downward trend sign
Free with trial A clean and modern vector illustration featuring two prominent white arrows, one pointing upwards and the other downwards, enclosed within a blue square with rounded corners. The arrows have a distinct black outline, creating a clear and versatile icon. This graphic effectively represents concepts such as upload and download, increase and decrease, directional movement, data transfer, or sorting. Ideal for web design, mobile applications, user interfaces, infographics, and any project requiring clear transactional or navigational indicators with a flat design aesthetic. Data decrease vectors Up and Down Arrows Icon for Upload Download Direction. A clean and modern vector illustration featuring two prominent white arrows, one pointing upwards and the other downwards, enclosed within a blue square with rounded corners. The arrows have a distinct black outline, creating a clear and versatile icon. This graphic effectively represents concepts such as upload and download, increase and decrease, directional movement, data transfer, or sorting. Ideal for web design, mobile applications, user interfaces, infographics, and any project requiring clear transactional or navigational indicators with a flat design aesthetic.
Free with trial Decrease: Decrease represents a reduction in value, amount, or performance over time. Data decrease illustrations Illustration of Decrease. Decrease: Decrease represents a reduction in value, amount, or performance over time.
Free with trial Trade war impact on usa vs china stock market crisis with data visualization for economic analysis. Generative AI. Data decrease illustrations Trade war impact on usa vs china stock market crisis with data visualization for economic analysis
Free with trial Comparing Bar Chart Data Analysis Icons vol 30444. Data decrease vectors Comparing Bar Chart Data Analysis Icons
Free with trial Analysis audit sales growth report icon vector modern comparing with loss failure statistics business data performance set sign symbol, progress assessment strategy vs recession decrease graph clipart. Data decrease vectors Analysis audit sales growth report icon vector modern comparing with loss failure statistics business data performance set sign
Free with trial Downward graph trend with red points, sad face, and a file folder suggests failure, loss, or poor performance. Ideal for business, data, analysis, decline management error simple flat metaphor. Data decrease vectors Declining Graph with Sad Face Emphasizing Negative Analytics and Data Loss. Downward graph trend with red points, sad face, and a file folder suggests failure, loss, or poor performance. Ideal for business, data, analysis, decline management error simple flat metaphor
Free with trial Vibrant vector illustration featuring business data charts and graphs, including bar graphs, line graphs, pie charts, and a roller coaster metaphor for market trends. This eye-catching design is perfect for presentations, infographics, and financial reports. Data decrease illustrations Business Data Charts Graphs Vector Illustration, Statistics. Vibrant vector illustration featuring business data charts and graphs, including bar graphs, line graphs, pie charts, and a roller coaster metaphor for market trends. This eye-catching design is perfect for presentations, infographics, and financial reports.
Free with trial A playful, looping arrow pointing downwards, representing a decrease, download, or decline. This hand drawn vector illustration with a grunge texture works well for UI and data visualization. Data decrease vectors Looping Downward Arrow For Decrease Hand Drawn In A Vector Illustration Style. A playful, looping arrow pointing downwards, representing a decrease, download, or decline. This hand drawn vector illustration with a grunge texture works well for UI and data visualization
Free with trial Chart with rising and falling trends on a grid board alongside a smaller cloud-connected line graph. Ideal for analytics, data analysis, statistics, forecasting, technology, research. Data decrease illustrations Data Analytics Visualization with Graphs and Cloud Integration Concept. Chart with rising and falling trends on a grid board alongside a smaller cloud-connected line graph. Ideal for analytics, data analysis, statistics, forecasting, technology, research
Free with trial A black bar chart graph with a falling arrow on a white background, indicating decline and decrease in data or business performance. Scalable format print and digital media. and projects. Data decrease vectors Black bar chart graph with falling arrow decline. A black bar chart graph with a falling arrow on a white background, indicating decline and decrease in data or business performance. Scalable format print and digital media. and projects
Free with trial Bar chart icon showing three declining bars within a circular interface, symbolizing decreasing data, analytical trends, and financial performance concepts. Data decrease vectors Decreasing bar chart data analysis statistics icon. Bar chart icon showing three declining bars within a circular interface, symbolizing decreasing data, analytical trends, and financial performance concepts
Free with trial Downward arrow icon set. Decrease direction symbol. Reduction indicator sign vector. Data decrease vectors Downward arrow icon set. Decrease direction symbol. Reduction indicator sign
Free with trial Graph with curve, labeled axes, data table, hand with coin, and dollar symbols. Ideal for finance, business, economy, investment data visualization analytics simple landing page. Data decrease illustrations Financial graph with data table, hand receiving coins, and analysis concept design. Graph with curve, labeled axes, data table, hand with coin, and dollar symbols. Ideal for finance, business, economy, investment data visualization analytics simple landing page
Free with trial Abstract financial data display showing fluctuating market trends. Data decrease illustrations Glowing Financial Stock Market Data Analysis Chart. Abstract financial data display showing fluctuating market trends
Free with trial Downward Trend Line Graph Icons for Financial Data vol 34820. Data decrease vectors Downward Trend Line Graph Icons for Financial Data
Free with trial A modern flat design graphic set featuring two icons: opposing arrows indicating increase decrease and a bar chart showing financial growth or decline, perfect for business concepts. Data decrease vectors Increase and decrease arrows with bar chart icon. A modern flat design graphic set featuring two icons: opposing arrows indicating increase decrease and a bar chart showing financial growth or decline, perfect for business concepts
Free with trial Circular percentage icon indicating a decrease or reduction, useful for financial concepts like interest rate changes, sales, discounts, and data analysis in business and economics. Data decrease vectors Decreasing percentage rate circular icon illustration. Circular percentage icon indicating a decrease or reduction, useful for financial concepts like interest rate changes, sales, discounts, and data analysis in business and economics
Free with trial Bar chart with descending bars and dashed arrow illustrating decline in value or trend analysis. Ideal for business, finance, economy, performance, forecasting, data, and growth planning. Simple flat. Data decrease illustrations Declining Bar Chart with Dashed Arrow Representing Decrease and Trend Analysis. Bar chart with descending bars and dashed arrow illustrating decline in value or trend analysis. Ideal for business, finance, economy, performance, forecasting, data, and growth planning. Simple flat
Free with trial A versatile set of black and white vector icons depicting financial growth, decline, and market trends. Perfect for business, analytics, and finance presentations. Data decrease vectors Set of increase and decrease financial data icons. A versatile set of black and white vector icons depicting financial growth, decline, and market trends. Perfect for business, analytics, and finance presentations
Free with trial Line graph illustrating data analysis and business statistics, charting financial growth, market changes, and performance metrics for visual information and infographic content. Data decrease illustrations Analyzing data with line graph showing business trends. Line graph illustrating data analysis and business statistics, charting financial growth, market changes, and performance metrics for visual information and infographic content
Free with trial Bar chart showing stock market increase and decrease. Data decrease vectors Bar chart showing stock market increase and decrease.
Free with trial Decrease bar chart icon on circle line. Statistic sign symbol illustration. Data decrease vectors Decrease bar chart icon on circle line. Statistic sign symbol
Free with trial A simple flat design graphic features a red arrow pointing down and a green arrow pointing up, symbolizing increase and decrease. Ideal for business and finance concepts. Data decrease vectors Directional arrows indicating increase and decrease. A simple flat design graphic features a red arrow pointing down and a green arrow pointing up, symbolizing increase and decrease. Ideal for business and finance concepts
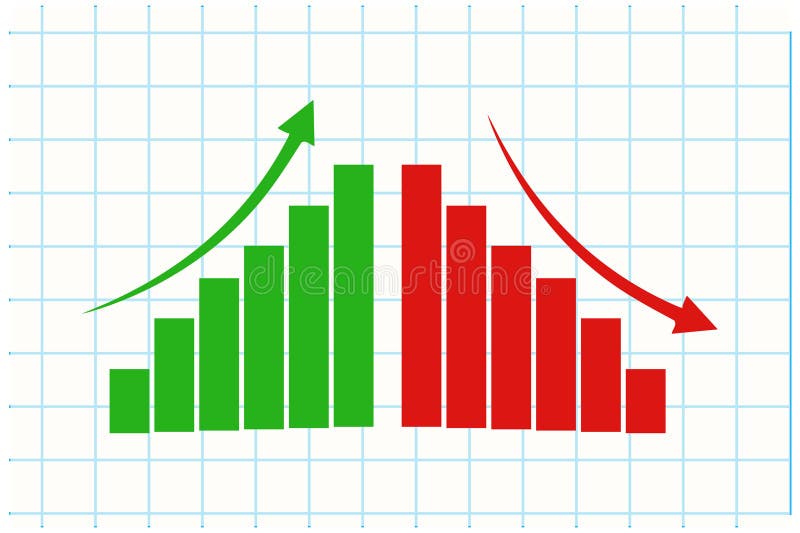
Free with trial A flat design vector illustration showing a graph with rising and falling bars, marked by green and red arrows indicating increase and decrease. Ideal for financial concepts. Data decrease vectors Bar chart showing positive and negative data trends. A flat design vector illustration showing a graph with rising and falling bars, marked by green and red arrows indicating increase and decrease. Ideal for financial concepts
Free with trial Person seated on bar chart with laptop, upward and downward arrows, cloud element. Ideal for data trends, analytics, cloud computing, statistics, progress tracking, career growth simple flat. Data decrease vectors Woman Analyzing Data on Laptop, Representing Cloud-Based Growth and Decline Trends. Person seated on bar chart with laptop, upward and downward arrows, cloud element. Ideal for data trends, analytics, cloud computing, statistics, progress tracking, career growth simple flat
Free with trial This graphic displays two circular icons, one depicting a downward-pointing arrow with a dollar sign, symbolizing a decrease in value, and the other an upward arrow with a dollar sign, representing an increase. Data decrease vectors Cost decrease or increase icon. Downward vs upward dollar signs. This graphic displays two circular icons, one depicting a downward-pointing arrow with a dollar sign, symbolizing a decrease in value, and the other an upward arrow with a dollar sign, representing an increase.
Free with trial Abstract financial data visualization graphic. Data decrease illustrations Blue Digital Data Visualization Abstract Background with Bars and Lines. Abstract financial data visualization graphic
Free with trial Candlestick chart icons on a digital trading screen showing market movements, price trends and investment data for finance, stock analysis, trading strategy and economic growth. Data decrease illustrations Candlestick chart displaying financial market data analysis. Candlestick chart icons on a digital trading screen showing market movements, price trends and investment data for finance, stock analysis, trading strategy and economic growth
Free with trial Cardboard box with label beside a fluctuating line graph, denoting analytics, efficiency, shipment tracking, or delivery trends. Ideal for logistics, e-commerce, data trends, analysis operations. Data decrease vectors Box with Shipping Label and Data Graph Representing Logistics and Performance Trends. Cardboard box with label beside a fluctuating line graph, denoting analytics, efficiency, shipment tracking, or delivery trends. Ideal for logistics, e-commerce, data trends, analysis operations
Free with trial Data analysis. Visualizing analytics through a chart and declining arrow downward trends. Data analysis for business reporting, statistics, forecasting, and presentations. Data decrease vectors Data Analysis and Declining Metrics by Graphs and Arrows for Business Reporting. Data analysis. Visualizing analytics through a chart and declining arrow downward trends. Data analysis for business reporting, statistics, forecasting, and presentations
Free with trial Up and down graph chart icon. Growth increase and decrease sign. Graph or diagram with arrow going up and down. Vector illustration. Data decrease illustrations Up and down graph chart icon. Growth increase and decrease sign. Graph or diagram with arrow going up and down. Vector
Free with trial Euro Currency Decrease Icons with Downward Arrow vol 30127. Data decrease vectors Euro Currency Decrease Icons with Downward Arrow
Free with trial Up and down graph chart icon. Growth increase and decrease sign. Graph or diagram with arrow going up and down. Vector illustration. Data decrease vectors Up and down graph chart icon. Growth increase and decrease sign. Graph or diagram with arrow going up and down. Vector
Free with trial Business decline chart or bar graph icon. Decrease, loss, and financial crisis sign symbol vector. Data decrease vectors Business decline chart or bar graph icon. Decrease, loss, and financial crisis sign symbol
Free with trial Icon style image shows magnifying glass over finance data. Clean aesthetic with a black background and light colors. Data decrease vectors Financial analysis magnifying glass looking at data bar graph. Icon style image shows magnifying glass over finance data. Clean aesthetic with a black background and light colors.
Free with trial Flat style illustration showcasing business financial data analysis via a magnifying glass and graph chart visualization, isolated on black. Data decrease vectors Analyzing Financial Data with Magnifying Glass and Graph Chart. Flat style illustration showcasing business financial data analysis via a magnifying glass and graph chart visualization, isolated on black.
Free with trial An abstract visual representation of data, featuring a vibrant red bar chart resembling a cityscape or sound wave, overlaid with a line graph and connecting dots. This dynamic graphic is ideal for concepts related to financial analysis, business intelligence, or data visualization. Data decrease illustrations Red Abstract Bar Chart Waveform with Connecting Dots and Lines - Data Analysis. An abstract visual representation of data, featuring a vibrant red bar chart resembling a cityscape or sound wave, overlaid with a line graph and connecting dots. This dynamic graphic is ideal for concepts related to financial analysis, business intelligence, or data visualization.
Free with trial Data trends. Data with arrows indicating increase and decrease, growth chart, and audio waveform. Data trends highlight growth, performance tracking, and communication analysis. Suitable. Data decrease illustrations Data Trends and Analysis with Arrows, Graph, and Audio Waveform Communication Metrics. Data trends. Data with arrows indicating increase and decrease, growth chart, and audio waveform. Data trends highlight growth, performance tracking, and communication analysis. Suitable
Free with trial Modern data decline visualization icons with colorful gradient. Set of icons representing data decline and financial loss business charts graphs arrows isolated. Data decrease vectors Modern data decline visualization icons with colorful gradient. Set of icons representing data decline and financial loss business charts graphs arrows isolated
Free with trial Sales analysis. Sales with charts highlighting performance and revenue decline. Sales data optimization for retail strategies, e-commerce insights, and business reports. Data decrease vectors Data Analytics and Sales Decline Concept with Graphs and Marketing Visuals on Screen. Sales analysis. Sales with charts highlighting performance and revenue decline. Sales data optimization for retail strategies, e-commerce insights, and business reports
Free with trial Decrease and increase chart icon with arrow. Negative and positive trend symbol illustration. Data decrease vectors Decrease and increase chart icon with arrow. Negative and positive trend symbol
Free with trial Up and down arrows, bar graph, and fingerprint emphasize data analysis, growth, security, identity, biometrics, trends and technology. Ideal for business analytics privacy security technology. Data decrease illustrations Arrows Indicating Trends With Bar Graph and Digital Fingerprint for Data and Security Concepts. Up and down arrows, bar graph, and fingerprint emphasize data analysis, growth, security, identity, biometrics, trends and technology. Ideal for business analytics privacy security technology
Free with trial Illustration of a growing business intelligence with a dashboard displaying high metrics, a stack of data chips, and a simple magnifying glass. Vector flat icon design on a white background for a data analysis illustration --chaos 30 --ar 16:9 --v 7 Job ID: cfbe4cc3-3bae-455f-ac79-f340192ae4d4. Data decrease illustrations Data Analysis and Reporting Concept Computer Screen with Charts and Magnifying Glass. Illustration of a growing business intelligence with a dashboard displaying high metrics, a stack of data chips, and a simple magnifying glass. Vector flat icon design on a white background for a data analysis illustration --chaos 30 --ar 16:9 --v 7 Job ID: cfbe4cc3-3bae-455f-ac79-f340192ae4d4
Free with trial A clear, minimalist illustration featuring two distinct arrows on a clean white background. On the left, a blue arrow points downwards, symbolizing concepts like decrease, decline, or negative trends. On the right, a vibrant green arrow points upwards, representing increase, growth, improvement, or positive movement. Rendered in a modern flat design style, this versatile graphic is ideal for conveying directional changes, comparisons, data trends, or navigation in user interfaces, presentations, infographics, and educational content. Data decrease illustrations Green Up and Blue Down Arrows. A clear, minimalist illustration featuring two distinct arrows on a clean white background. On the left, a blue arrow points downwards, symbolizing concepts like decrease, decline, or negative trends. On the right, a vibrant green arrow points upwards, representing increase, growth, improvement, or positive movement. Rendered in a modern flat design style, this versatile graphic is ideal for conveying directional changes, comparisons, data trends, or navigation in user interfaces, presentations, infographics, and educational content.
Free with trial Minimalist outline drawing of a bar chart representing data analysis and statistical information. Great for presentations and data representations. Data decrease vectors Simple Outline Bar Chart Sign Statistical Data Analysis Diagram Icon. Minimalist outline drawing of a bar chart representing data analysis and statistical information. Great for presentations and data representations.
Free with trial Four colorful bar charts are displayed on a graph, representing trends, statistics, and timeline data, with a potential focus on business infographics elements. Data decrease vectors Four colorful bar charts are displayed on a graph, representing trends, statistics, and timeline data, with a potential
Free with trial Colorful bar charts are presenting statistical trends and business performance data across different time periods. Possibly days of the week. Using a vibrant color scheme of blue. Purple. And orange. Data decrease vectors Colorful bar charts are presenting statistical trends and business performance data across different time periods
Free with trial Set line Mind map infographic, Financial growth decrease and icon. Vector. Data decrease illustrations Set line Mind map infographic, Financial growth decrease and icon. Vector
Free with trial Twelve small line graphs showcase diverse data trends, illustrating increases, decreases, peaks, and valleys. Visual representation of business analytics. Data decrease illustrations Various Line Graph Charts Data Visualization Business Analytics. Twelve small line graphs showcase diverse data trends, illustrating increases, decreases, peaks, and valleys. Visual representation of business analytics
Free with trial Six simple line graphs showcase various data trends, including upward, downward, and fluctuating patterns. Each graph features key data points marked with letters. Data decrease illustrations Six Line Graph Charts Data Visualization, Trends, Growth, Analysis. Six simple line graphs showcase various data trends, including upward, downward, and fluctuating patterns. Each graph features key data points marked with letters
Free with trial Sad face emoticon beside password entry field and decreasing bar chart. Ideal for cybersecurity, data loss, decline, failure, frustration, protection issues, simple flat metaphor. Data decrease vectors Sad face with password entry and declining bar chart conveying data security or performance issues. Sad face emoticon beside password entry field and decreasing bar chart. Ideal for cybersecurity, data loss, decline, failure, frustration, protection issues, simple flat metaphor
Free with trial The image showcases a smartphone displaying financial data visualizations, including line graphs and bar charts. Additional icons and graphics related to data analysis and finance surround the phone, emphasizing the digital and analytical nature of the content. This composition was generated by AI,. Data decrease illustrations Mobile Financial Data. The image showcases a smartphone displaying financial data visualizations, including line graphs and bar charts. Additional icons and graphics related to data analysis and finance surround the phone, emphasizing the digital and analytical nature of the content. This composition was generated by AI,
Free with trial Percentage Decrease Bar Chart Icons for Financial Reports and Analytics vol 34492. Data decrease vectors Percentage Decrease Bar Chart Icons for Financial Reports and Analytics
Free with trial A vibrant pink 3D bar chart illustrates financial data with a prominent downward-trending arrow superimposed. The bars decrease in height from left to right, signifying a decline. An upward-pointing arrow is positioned at the top left, indicating a contrasting upward trend. The graphic is isolated on a white background, making it suitable for presentations on financial performance, market trends,. Data decrease illustrations 3D Pink Bar Chart with Downward Trend Arrow and Upward Trend Arrow graph statistics. A vibrant pink 3D bar chart illustrates financial data with a prominent downward-trending arrow superimposed. The bars decrease in height from left to right, signifying a decline. An upward-pointing arrow is positioned at the top left, indicating a contrasting upward trend. The graphic is isolated on a white background, making it suitable for presentations on financial performance, market trends,
Free with trial A simple and clean line graph icon illustration, perfect for illustrating financial data, growth charts, and statistical analysis. Ideal for use in presentations, reports, and websites. Data decrease vectors Minimalist Line Graph Icon Design for Financial Data Analysis Presentation. A simple and clean line graph icon illustration, perfect for illustrating financial data, growth charts, and statistical analysis. Ideal for use in presentations, reports, and websites.
Free with trial Data performance, emotional analysis, trends, efficiency, technology, decision-making. Graph with declining curve, sad and happy faces gear mechanism. Data performance and emotional analysis concept. Data decrease vectors Data Analysis Chart with Declining Trend, Emotional Reactions, and Gear Mechanism Efficiency. Data performance, emotional analysis, trends, efficiency, technology, decision-making. Graph with declining curve, sad and happy faces gear mechanism. Data performance and emotional analysis concept