Free with trial Set line Data analysis, Financial growth, Calculator, Folder and lock, decrease and icon. Vector. Data decrease illustrations Set line Data analysis, Financial growth, Calculator, Folder and lock, decrease and icon. Vector
Free with trial Isometric banner template showing inflation concept. Vector illustration of financial crisis, rising prices, and money value decrease. Data analysis report with charts and upward arrow for web design. Data decrease vectors Inflation And Economic Crisis Data Analysis Isometric Banner Template Vector Illustration. Isometric banner template showing inflation concept. Vector illustration of financial crisis, rising prices, and money value decrease. Data analysis report with charts and upward arrow for web design
Free with trial Candlestick chart displaying financial data trends with red and green bars on a white background. Each candlestick represents price movement over a specific time period, reflecting opening, closing, high, and low prices. Green candles indicate a price increase, while red ones signify a decrease. Vertical lines, or wicks, extend above and below the body of the candle, showing price extremes. This visualization is commonly used in financial markets to analyze stock prices and trends. Data decrease illustrations Candlestick chart displaying financial data trends with red and green bars on a
Free with trial Set Isometric Financial growth decrease Data analysis and Pie chart infographic icon. Vector. Data decrease vectors Set Isometric Financial growth decrease, Data analysis and Pie chart infographic icon. Vector
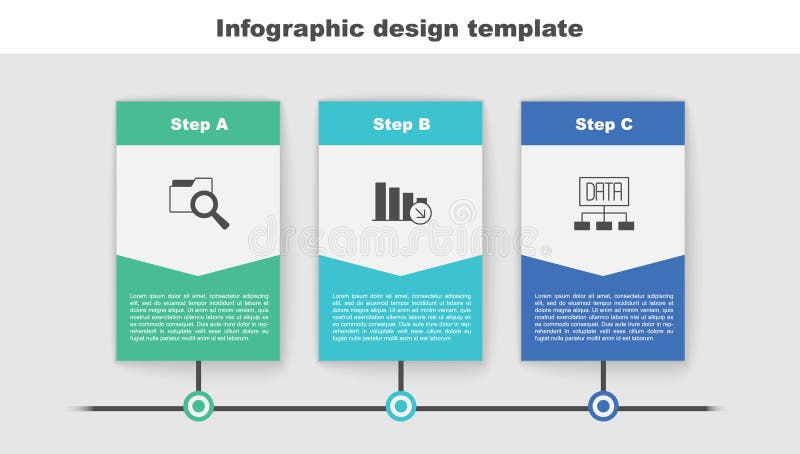
Free with trial Set line Data analysis, Financial growth decrease, and Search data. Business infographic template. Vector. Data decrease illustrations Set line Data analysis, Financial growth decrease, and Search data. Business infographic template. Vector
Free with trial Set line Financial growth decrease, Data analysis, Pie chart infographic, Server, Binary code, and icon. Vector. Data decrease illustrations Set line Financial growth decrease, Data analysis, Pie chart infographic, Server, Binary code, and icon. Vector
Free with trial Set line Financial growth decrease Binary code Data analysis Search data with folder and Pie chart infographic icon. Vector. Data decrease illustrations Set line Financial growth decrease, Binary code, Data analysis, Search data, with folder and Pie chart infographic icon
Free with trial Set Coal mine trolley Server Pie chart infographic Financial growth Data analysis decrease and Sales funnel with icon. Vector. Data decrease vectors Set Coal mine trolley, Server, Pie chart infographic, Financial growth, Data analysis, decrease, and Sales funnel with. Set Coal mine trolley Server Pie chart. Set Coal mine trolley Server Pie chart infographic Financial growth Data analysis decrease and Sales funnel with icon. Vector.
Free with trial Set Financial growth decrease Cloud computing lock Pie chart infographic Server Sales funnel with and Data analysis icon. Vector. Data decrease illustrations Set Financial growth decrease, Cloud computing lock, Pie chart infographic, Server, Sales funnel with, and Data analysis
Free with trial Downward Trend Chart Illustration with Bars and Arrow Signifying Decrease Business and Finance Data. Data decrease vectors Downward Trend Chart Illustration with Bars and Arrow Signifying Decrease Business and Finance Data
Free with trial Hand drawn style bar graph displaying a continuous downward trend and data decrease arrow. Data decrease vectors Hand drawn style bar graph displaying a continuous downward trend and data decrease arrow
Free with trial A stark bar graph illustrates a clear downward trend, symbolized by a descending arrow. This image represents decline, decrease, or negative progression in data. Data decrease vectors Vector art of bar graph with a downward trend line indicating decline or decrease in data. A stark bar graph illustrates a clear downward trend, symbolized by a descending arrow. This image represents decline, decrease, or negative progression in data
Free with trial Set Photo retouching Cloud technology data transfer Search engine Financial growth decrease Magnifying glass with check mark and New chat messages notification icon. Vector. Data decrease vectors Set Photo retouching, Cloud technology data transfer, Search engine, Financial growth decrease, Magnifying glass with. Set Photo retouching Cloud technology data transfer Search engine Financial growth decrease Magnifying glass with check mark and New chat messages notification icon. Vector.
Free with trial A bar chart with descending bars, representing decline, decrease, and negative data trends in a clear, informative style vector design Generative AI. Data decrease vectors Bar chart descending, decline decrease negative trend data vector design Generative AI. A bar chart with descending bars, representing decline, decrease, and negative data trends in a clear, informative style vector design Generative AI
Free with trial Man pictogram morphing into a downward arrow on white background, illustrating decline, decrease, falling trend or negative direction for finance, economy, data, business and social metrics. Data decrease illustrations Man icon showing data decrease or downward direction. Man pictogram morphing into a downward arrow on white background, illustrating decline, decrease, falling trend or negative direction for finance, economy, data, business and social metrics
Free with trial Finance data analytics, decrease graph line icon. Business research report analysis, finance performance analytics or company statistic outline vector icon column infographics and pointing down arrow. Data decrease illustrations Finance data analytics, decrease graph line icon
Free with trial Decline graph chart icon. Descending market stock scheme vector illustration. Decrease statistics symbol. Failing finance data sign. Arrow down economic analysis. Business loss trend. Report diagram. Data decrease vectors Decline graph chart icon. Descending market stock scheme vector illustration. Decrease statistics symbol. Failing finance data
Free with trial A red graph with arrows illustrating decrease and increase, representing data analysis and performance evaluation in business. Suitable for reports and presentations. Data decrease vectors Vector art of red graph with arrow, illustrating decrease and increase, representing data analysis and performance evaluation in. A red graph with arrows illustrating decrease and increase, representing data analysis and performance evaluation in business. Suitable for reports and presentations
Free with trial The image shows a bar graph with a red line indicating a downward trend. The bars decrease in height from left to right, suggesting a significant decline in the measured data over time. Data decrease illustrations A downward trend graph illustrating a significant decrease in data over time. The image shows a bar graph with a red line indicating a downward trend. The bars decrease in height from left to right, suggesting a significant decline in the measured data over time
Free with trial The image depicts a 3D bar graph with red bars, showing a clear downward trend. The bars decrease in height from left to right, indicating a significant decline in the measured data. An arrow points downwards, emphasizing the negative trend. Data decrease illustrations A downward trending graph illustrating a significant decrease in data points over time. The image depicts a 3D bar graph with red bars, showing a clear downward trend. The bars decrease in height from left to right, indicating a significant decline in the measured data. An arrow points downwards, emphasizing the negative trend
Free with trial Three dimensional blue arrows and plus sign representing growth, progress, increase, decrease, statistics, data analysis, business, finance, charts, and trends. Data decrease vectors Three dimensional blue arrows and plus sign symbolizing growth progress increase decrease statistics data analysis. Three dimensional blue arrows and plus sign representing growth, progress, increase, decrease, statistics, data analysis, business, finance, charts, and trends
Free with trial Set line Financial growth decrease, Cloud and shield and Search data analysis icon. Vector. Data decrease illustrations Set line Financial growth decrease, Cloud and shield and Search data analysis icon. Vector
Free with trial Set line Financial growth decrease, Data analysis, Server and Search data icon. Vector. Data decrease illustrations Set line Financial growth decrease, Data analysis, Server and Search data icon. Vector
Free with trial Set Mind map infographic Pie chart Server Folder and lock Sales funnel with Financial growth decrease Data analysis and icon. Vector. Data decrease vectors Set Mind map infographic, Pie chart, Server, Folder and lock, Sales funnel with, Financial growth decrease, Data. Set Mind map infographic Pie chart Server Folder and lock Sales funnel with Financial growth decrease Data analysis and icon. Vector.
Free with trial Set Binary code Pie chart infographic Data analysis Coal mine trolley Financial growth decrease and Browser with stocks market icon. Vector. Data decrease illustrations Set Binary code, Pie chart infographic, Data analysis, Coal mine trolley, Financial growth decrease, and Browser with. Set Binary code Pie chart infographic Data analysis Coal mine trolley Financial growth decrease and Browser with stocks market icon. Vector.
Free with trial Set line Data analysis Search data Financial growth decrease Server security with padlock Pie chart infographic and icon. Vector. Data decrease vectors Set line Data analysis, Search data, Financial growth decrease, Server security with padlock, Pie chart infographic, and
Free with trial Bar chart with descending arrow showing a significant decrease in data or performance. Data decrease vectors Bar chart with descending arrow showing a significant decrease in data or performance
Free with trial Set line Data analysis Folder and lock Financial growth decrease and Pie chart infographic. Business infographic template. Vector. Data decrease vectors Set line Data analysis, Folder and lock, Financial growth decrease and Pie chart infographic. Business infographic. Set line Data analysis Folder and lock Financial growth decrease and Pie chart infographic. Business infographic template. Vector.
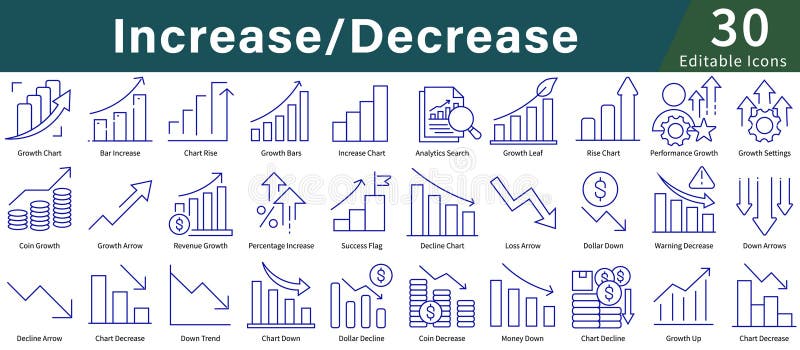
Free with trial Icons illustrating concepts of "Increase Decrease," using simple blue line art. Features include graphs and charts with upward and downward arrows, coins, dollar symbols, and percentage signs. Icons depict growth, decline, analytics, and performance tracking. Suitable for business, finance, or data analysis themes, these icons provide a visual representation of financial trends and statistics, making abstract concepts clear and easily understandable. The design is minimalistic and user-friendly, aimed at enhancing clarity in presentations and reports. Data decrease vectors Increase Decrease Icon Set in Line Style with Editable Vector for Growth, Analytics, Charts, and Data Visualization. Icons illustrating concepts of "Increase Decrease," using simple blue line art. Features include graphs and charts with upward and downward arrows, coins, dollar symbols, and percentage signs. Icons depict growth, decline, analytics, and performance tracking. Suitable for business, finance, or data analysis themes, these icons provide a visual representation of financial trends and statistics, making abstract concepts clear and easily understandable. The design is minimalistic and user-friendly, aimed at enhancing clarity in presentations and reports.
Free with trial Set line Laptop with browser window Browser Cloud technology data transfer Financial growth increase decrease Magnifying glass and delete Online shopping on screen and Server icon. Vector. Data decrease vectors Set line Laptop with browser window, Browser, Cloud technology data transfer, Financial growth increase, decrease. Set line Laptop with browser window Browser Cloud technology data transfer Financial growth increase decrease Magnifying glass and delete Online shopping on screen and Server icon. Vector.
Free with trial Set line Graph chart infographic Server Data Browser window Financial growth decrease Laptop with browser Cloud technology data transfer and Secure your site HTTPS SSL icon. Vector. Data decrease illustrations Set line Graph chart infographic, Server, Data, Browser window, Financial growth decrease, Laptop with browser, Cloud. Set line Graph chart infographic Server Data Browser window Financial growth decrease Laptop with browser Cloud technology data transfer and Secure your site HTTPS SSL icon. Vector.
Free with trial Set line Financial growth, Pie chart infographic, decrease, Server, Data analysis, and icon. Vector. Data decrease vectors Set line Financial growth, Pie chart infographic, decrease, Server, Data analysis, and icon. Vector
Free with trial Set Financial growth decrease Server Search data analysis Pie chart infographic cloud computing Browser with exclamation mark Data and icon. Vector. Data decrease illustrations Set Financial growth decrease, Server, Search data analysis, Pie chart infographic, cloud computing, Browser with. Set Financial growth decrease Server Search data analysis Pie chart infographic cloud computing Browser with exclamation mark Data and icon. Vector.
Free with trial Set line Financial growth decrease Server Data Browser incognito window Infographic of city map Search engine Magnifying glass with check mark and Online shopping on screen icon. Vector. Data decrease vectors Set line Financial growth decrease, Server, Data, Browser incognito window, Infographic of city map, Search engine. Set line Financial growth decrease Server Data Browser incognito window Infographic of city map Search engine Magnifying glass with check mark and Online shopping on screen icon. Vector.
Free with trial Set Browser window Cloud technology data transfer Search engine Mobile phone Server Data Financial growth decrease and icon. Vector. Data decrease vectors Set Browser window, Cloud technology data transfer, Search engine, Mobile phone, Server, Data, Financial growth decrease. Set Browser window Cloud technology data transfer Search engine Mobile phone Server Data Financial growth decrease and icon. Vector.
Free with trial Set Search data analysis, Pie chart infographic, Calculator, Financial growth decrease, with folder, and icon. Vector. Data decrease vectors Set Search data analysis, Pie chart infographic, Calculator, Financial growth decrease, with folder, and icon. Vector
Free with trial Set Data analysis Financial growth decrease Mind map infographic Cloud download and upload Calculator Pie chart and icon. Vector. Data decrease illustrations Set Data analysis, Financial growth decrease, Mind map infographic, Cloud download and upload, Calculator, Pie chart and
Free with trial Set line Financial growth decrease, Document with graph chart, Cloud download and upload and Data analysis icon. Vector. Data decrease illustrations Set line Financial growth decrease, Document with graph chart, Cloud download and upload and Data analysis icon. Vector
Free with trial Set line Search data analysis Server Cloud download and upload Binary code Financial growth decrease Browser with exclamation mark Data and icon. Vector. Data decrease vectors Set line Search data analysis, Server, Cloud download and upload, Binary code, Financial growth decrease, Browser with. Set line Search data analysis Server Cloud download and upload Binary code Financial growth decrease Browser with exclamation mark Data and icon. Vector.
Free with trial Set line Data analysis Financial growth decrease Cloud and shield and Browser with stocks market. Business infographic template. Vector. Data decrease illustrations Set line Data analysis, Financial growth decrease, Cloud and shield and Browser with stocks market. Business infographic
Free with trial Set Server, Data, SEO optimization, Browser window and Financial growth decrease. Business infographic template. Vector. Data decrease vectors Set Server, Data, SEO optimization, Browser window and Financial growth decrease. Business infographic template. Vector
Free with trial Set Browser window Web developer programming code Financial growth decrease Server Data Secure your site with HTTPS SSL Magnifying glass check mark and incognito icon. Vector. Data decrease illustrations Set Browser window, Web developer programming code, Financial growth decrease, Server, Data, Secure your site with HTTPS. Set Browser window Web developer programming code Financial growth decrease Server Data Secure your site with HTTPS SSL Magnifying glass check mark and incognito icon. Vector.
Free with trial Set line Financial growth decrease Data analysis Browser with stocks market Pie chart infographic Coal mine trolley and Cloud computing lock icon. Vector. Data decrease vectors Set line Financial growth decrease, Data analysis, Browser with stocks market, Pie chart infographic, Coal mine trolley. Set line Financial growth decrease Data analysis Browser with stocks market Pie chart infographic Coal mine trolley and Cloud computing lock icon. Vector.
Free with trial Set Search with folder Financial growth decrease and Data analysis. Business infographic template. Vector. Data decrease illustrations Set Search with folder, Financial growth decrease and Data analysis. Business infographic template. Vector
Free with trial Set line Website with stocks market Financial growth decrease Browser window and Cloud technology data transfer icon. Vector. Data decrease illustrations Set line Website with stocks market, Financial growth decrease, Browser window and Cloud technology data transfer icon
Free with trial Headset with microphone audio decrease chart concept for support service and call center decrease, falling data information trend. Data decrease vectors Headset with microphone audio decrease chart concept for support service and call center decrease, falling data information trend
Free with trial Set line Pie chart infographic Financial growth decrease and Search data analysis on seamless pattern. Vector. Data decrease illustrations Set line Pie chart infographic, Financial growth decrease and Search data analysis on seamless pattern. Vector
Free with trial Set Search data analysis, Financial growth decrease, Server and Binary code icon. Vector. Data decrease illustrations Set Search data analysis, Financial growth decrease, Server and Binary code icon. Vector
Free with trial Set Data analysis, Financial growth decrease, Search data and Pie chart infographic icon. Vector. Data decrease vectors Set Data analysis, Financial growth decrease, Search data and Pie chart infographic icon. Vector
Free with trial Set Pie chart infographic, Financial growth decrease, Data analysis and Search data on seamless pattern. Vector. Data decrease illustrations Set Pie chart infographic, Financial growth decrease, Data analysis and Search data on seamless pattern. Vector
Free with trial Set Binary code, Pie chart infographic, Data analysis and Financial growth decrease icon. Vector. Data decrease vectors Set Binary code, Pie chart infographic, Data analysis and Financial growth decrease icon. Vector
Free with trial The image depicts a bar graph with a downward trend. The bars, colored in various shades of blue, green, yellow, orange, and red, show a clear decrease in height from left to right. A large red arrow at the top of the graph further emphasizes the downward direction, indicating a significant decline in the data being represented. Data decrease illustrations Decreasing trend in data. The image depicts a bar graph with a downward trend. The bars, colored in various shades of blue, green, yellow, orange, and red, show a clear decrease in height from left to right. A large red arrow at the top of the graph further emphasizes the downward direction, indicating a significant decline in the data being represented
Free with trial This bar and line graph illustrates a declining trend in data values over a period of months. The x-axis represents time in months from January to December, while the y-axis shows the values ranging from 0 to 800. The red bars indicate the monthly data values, and the red line represents the overall trend. The trend shows a consistent decrease in values from January to December. Data decrease illustrations Decline in monthly data over time. This bar and line graph illustrates a declining trend in data values over a period of months. The x-axis represents time in months from January to December, while the y-axis shows the values ranging from 0 to 800. The red bars indicate the monthly data values, and the red line represents the overall trend. The trend shows a consistent decrease in values from January to December
Free with trial Set line Financial growth decrease, Data analysis, and Server on black and white. Vector. Data decrease illustrations Set line Financial growth decrease, Data analysis, and Server on black and white. Vector
Free with trial Data melting line graph illustration trend analysis, visualization ice, decrease plot data melting line graph. Data decrease illustrations Data melting line graph
Free with trial Set line Pie chart infographic, Financial growth decrease and Data analysis icon. Vector. Data decrease vectors Set line Pie chart infographic, Financial growth decrease and Data analysis icon. Vector
Free with trial Isometric gear wheel with a downward pointing arrow and falling droplets symbolizes a system or process of reduction, decrease, or falling metrics within a mechanical or digital context. Data decrease vectors Gear mechanism indicating metric data decrease process. Isometric gear wheel with a downward pointing arrow and falling droplets symbolizes a system or process of reduction, decrease, or falling metrics within a mechanical or digital context
Free with trial A three-dimensional bar graph composed of translucent blue bars illustrates a significant downward trend. The bars decrease in height from left to right, and a large, transparent blue arrow points downwards, reinforcing the concept of decline. The graph is set against a gradient blue background, creating a sense of depth and focus on the data visualization. Data decrease illustrations A3D Rendered Blue Bar Graph Showing a Downward Trend with a Falling Arrow chart data. A three-dimensional bar graph composed of translucent blue bars illustrates a significant downward trend. The bars decrease in height from left to right, and a large, transparent blue arrow points downwards, reinforcing the concept of decline. The graph is set against a gradient blue background, creating a sense of depth and focus on the data visualization
Free with trial The image depicts a graph with a prominent downward trend. The graph features a thick black line sloping downwards from left to right, indicating a decline. Alongside this line, there are several vertical bars representing data points. The bars vary in height, with some being taller and others shorter, suggesting fluctuations in the data. The overall visual representation suggests a decrease in. Data decrease vectors Graph displaying downward trend with multiple data points. The image depicts a graph with a prominent downward trend. The graph features a thick black line sloping downwards from left to right, indicating a decline. Alongside this line, there are several vertical bars representing data points. The bars vary in height, with some being taller and others shorter, suggesting fluctuations in the data. The overall visual representation suggests a decrease in
Free with trial A simple down arrow positioned on a horizontal line, symbolizing decrease, lower, or downward movement. This vector illustration is ideal for data visualization, stock market trends, user interface elements, or statistical reports. It represents reduction and negative changes in various contexts, vector design Generative AI. Data decrease vectors Down Arrow Indicator, Decrease and Lower, vector design Generative AI. A simple down arrow positioned on a horizontal line, symbolizing decrease, lower, or downward movement. This vector illustration is ideal for data visualization, stock market trends, user interface elements, or statistical reports. It represents reduction and negative changes in various contexts, vector design Generative AI
Free with trial Temperature monitoring. Large thermometer with downward arrow signifying decrease, accompanied by figure analyzing data. Temperature monitoring for weather, environment, health, sustainability. Data decrease vectors Temperature Measurement and Data Analysis Concept with Thermometer and Downward Arrow. Temperature monitoring. Large thermometer with downward arrow signifying decrease, accompanied by figure analyzing data. Temperature monitoring for weather, environment, health, sustainability
Free with trial A graphic illustration featuring three prominent red arrows, each adorned with a white percentage sign. The arrows are positioned to point downwards, creating a strong visual representation of a decline, reduction, or decrease in value, price, or rate. This imagery is commonly used in financial contexts, marketing, and data visualization to convey a downward trend or a sale. Data decrease illustrations Three red arrows pointing down with percentage signs symbolizing a decrease in value or price. A graphic illustration featuring three prominent red arrows, each adorned with a white percentage sign. The arrows are positioned to point downwards, creating a strong visual representation of a decline, reduction, or decrease in value, price, or rate. This imagery is commonly used in financial contexts, marketing, and data visualization to convey a downward trend or a sale
Free with trial Set Browser window Graph chart infographic Cloud technology data transfer upload Mobile phone incognito and Financial growth decrease icon. Vector. Data decrease illustrations Set Browser window, Graph chart infographic, Cloud technology data transfer, upload, Mobile phone, incognito and. Set Browser window Graph chart infographic Cloud technology data transfer upload Mobile phone incognito and Financial growth decrease icon. Vector.
Free with trial Set line Secure your site with HTTPS SSL Browser window Cloud technology data transfer Online play video Photo retouching Financial growth decrease and Digital speed meter icon. Vector. Data decrease illustrations Set line Secure your site with HTTPS, SSL, Browser window, Cloud technology data transfer, Online play video, Photo. Set line Secure your site with HTTPS SSL Browser window Cloud technology data transfer Online play video Photo retouching Financial growth decrease and Digital speed meter icon. Vector.
Free with trial A simple down arrow icon, commonly used to indicate 'download,' 'decrease,' or a downward direction. Ideal for file downloads, data flow, and user interface navigation, vector design Generative AI. Data decrease vectors Down Arrow Icon for Download or Decrease Action, vector design Generative AI. A simple down arrow icon, commonly used to indicate 'download,' 'decrease,' or a downward direction. Ideal for file downloads, data flow, and user interface navigation, vector design Generative AI
Free with trial A bright glossy red arrow curves downwards indicating a fall or decline. This symbol represents negative trends, decrease, or a downward movement in data or performance. Data decrease illustrations Glossy red downward curve arrow showing decline fall decrease trend. A bright glossy red arrow curves downwards indicating a fall or decline. This symbol represents negative trends, decrease, or a downward movement in data or performance
Free with trial A red line graph with data points illustrating a downward trend over time, suggesting a decrease in measured values. Data decrease illustrations Declining Trend in Data Analysis Representation. a red line graph with data points illustrating a downward trend over time, suggesting a decrease in measured values
Free with trial A simple vector icon of a minus sign, symbolizing subtraction, decrease, negative values, or removal. Ideal for calculators, data entry forms, pricing adjustments, or user interface controls. This fundamental symbol is universally understood for reduction, vector design Generative AI. Data decrease vectors Minus Sign Subtract Icon, Decrease Remove Negative Vector, vector design Generative AI. A simple vector icon of a minus sign, symbolizing subtraction, decrease, negative values, or removal. Ideal for calculators, data entry forms, pricing adjustments, or user interface controls. This fundamental symbol is universally understood for reduction, vector design Generative AI
Free with trial A vivid red arrow signifies a downward trend or negative movement. This impactful graphic represents decline loss decrease and is ideal for illustrating financial reports or data trends. Data decrease illustrations Bold red arrow points downward showing decline loss decrease trend direction. A vivid red arrow signifies a downward trend or negative movement. This impactful graphic represents decline loss decrease and is ideal for illustrating financial reports or data trends
Free with trial A simple line graph icon showing a downward trend, representing statistics, data, or a decline in performance. Useful for financial reports, market analysis, or educational materials. Its clear visual direction conveys negative momentum or a decrease, vector design Generative AI. Data decrease vectors Downward Trend Line Graph Icon for Statistics and Data, vector design Generative AI. A simple line graph icon showing a downward trend, representing statistics, data, or a decline in performance. Useful for financial reports, market analysis, or educational materials. Its clear visual direction conveys negative momentum or a decrease, vector design Generative AI
Free with trial A red line graph shows a steady decline in values over a period. The downward trajectory reflects a significant decrease, with data points plotted against a grid background. Data decrease illustrations Declining trend line illustrates significant downward movement in data over time. A red line graph shows a steady decline in values over a period. The downward trajectory reflects a significant decrease, with data points plotted against a grid background.
Free with trial A striking vector icon of a bold red downward arrow, symbolizing direction, decrease, or warning. Versatile for user interface elements, data visualization, alerts, or simply indicating a downward movement. Clean and impactful. vector design Generative AI. Data decrease vectors Bold Red Downward Arrow Icon for Direction or Decrease, vector design Generative AI. A striking vector icon of a bold red downward arrow, symbolizing direction, decrease, or warning. Versatile for user interface elements, data visualization, alerts, or simply indicating a downward movement. Clean and impactful. vector design Generative AI
Free with trial A green zigzag arrow graph pointing downwards, symbolizing a decrease, decline, or downward trend. This can be used for financial charts showing a market drop or for any data visualization representing a reduction or loss. vector design Generative AI. Data decrease vectors Green Arrow Graph Pointing Down for Financial and Data Trends, vector design Generative AI. A green zigzag arrow graph pointing downwards, symbolizing a decrease, decline, or downward trend. This can be used for financial charts showing a market drop or for any data visualization representing a reduction or loss. vector design Generative AI
Free with trial Business graph data in a bar chart showing increase and decrease with blue line illustration on plain background. Data decrease vectors Business graph data in a bar chart showing increase and decrease with blue line illustration on plain background
Free with trial A clean, minimalist icon representing a decrease of ten percent, symbolized by a down arrow and the -10% sign. Perfect for financial reports, data analysis, or any context requiring a visual representation of decline. Data decrease vectors Simple Outline Decrease Percentage Ten Percent Drop Down Arrow Icon. A clean, minimalist icon representing a decrease of ten percent, symbolized by a down arrow and the -10% sign. Perfect for financial reports, data analysis, or any context requiring a visual representation of decline.
Free with trial A bold flat vector icon of a downward-pointing arrow, symbolizing download, decrease, decline, or a downward direction. Ideal for data analytics, financial charts, and user interfaces. Represents movement, progression, or a specific action, vector design Generative AI. Data decrease vectors Down Arrow Icon: Download, Decrease Directional Indicator, vector design Generative AI. A bold flat vector icon of a downward-pointing arrow, symbolizing download, decrease, decline, or a downward direction. Ideal for data analytics, financial charts, and user interfaces. Represents movement, progression, or a specific action, vector design Generative AI