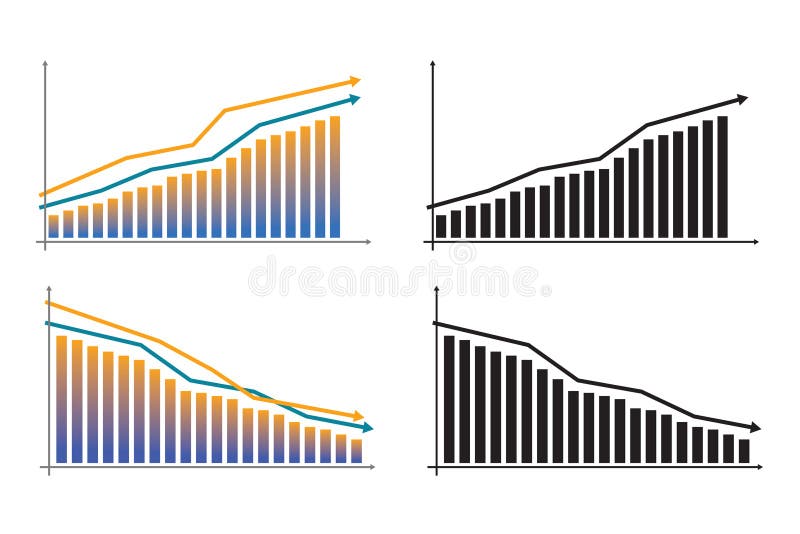
Free with trial Money Graph Paper Retro Vector Illustration. Data decrease vectors Money Graph Vector Illustration. Money Graph Paper Retro Vector Illustration
Free with trial Downwards moving chart over a map of the world. Data decrease illustrations World downwards chart. Downwards moving chart over a map of the world
Free with trial Chart with downwards arrow over currency symbols. Data decrease illustrations Chart currencies down. Chart with downwards arrow over currency symbols
Free with trial Abstract science analysis background frame illustration. Data decrease illustrations Abstract science analysis background frame
Free with trial Falling chart breaks the bottom, infographic. Data decrease illustrations Falling chart breaks the bottom
Free with trial Abstract statistics blue background frame border illustration. Data decrease illustrations Abstract statistics blue background frame border
Free with trial Different colors business circle graphs. vector file also available. Data decrease vectors Business Circle graphs
Free with trial A big yellow pie share marked Cost threatens to eat a smaller green piece marked Profits, symbolizing a business whose costs have become too high in relation to revenue. Data decrease illustrations Costs Eating Profits Pie Chart. A big yellow pie share marked Cost threatens to eat a smaller green piece marked Profits, symbolizing a business whose costs have become too high in relation to revenue
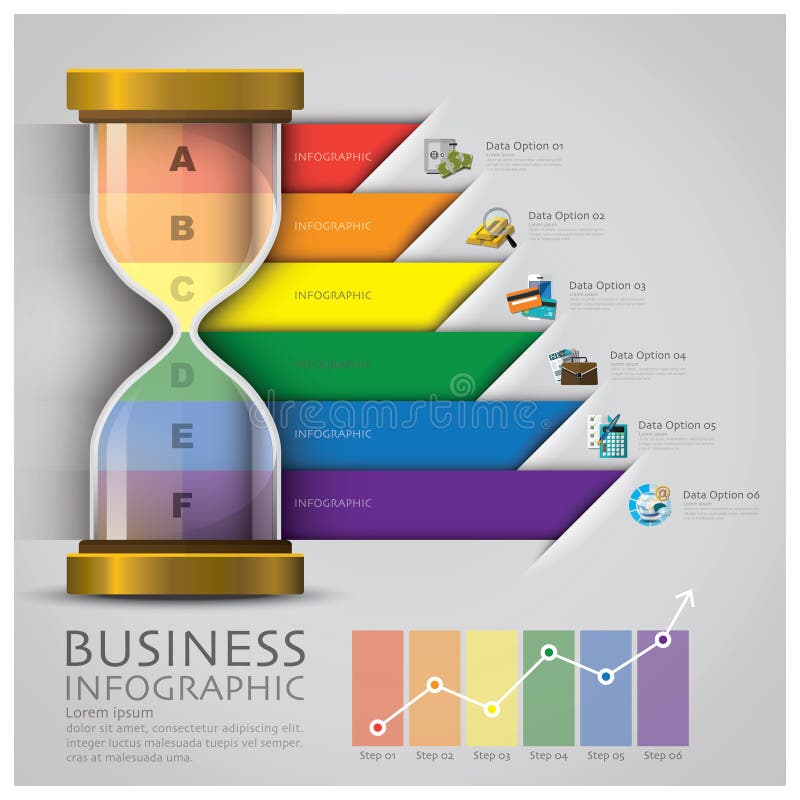
Free with trial Sandglass Money And Financial Business Infographic Design Template. Data decrease vectors Sandglass Money And Financial Business Infographic
Free with trial Infographic and chart icon set 5, eps10. Data decrease illustrations Infographic and chart icon set 5, eps10
Free with trial Busines down shiny chart width negative arrow. Vector illustration. from background. Data decrease vectors Busines down shiny chart width negative arrow
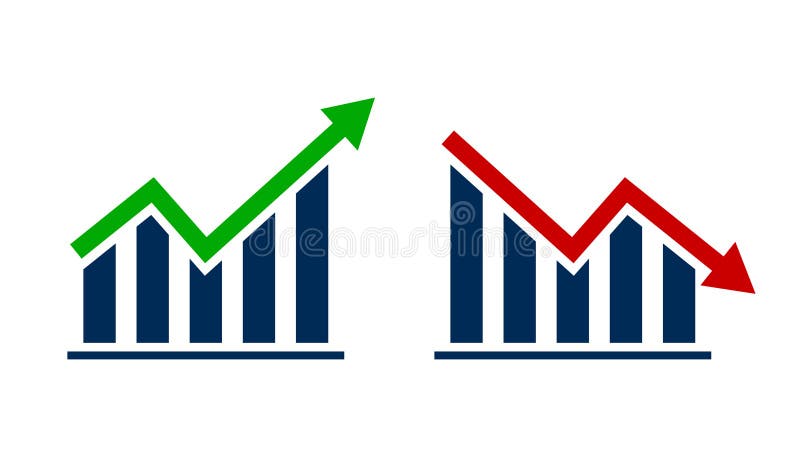
Free with trial Business Graph Up and Down, Financial Green arrow up and red arrow down. Stock exchange concept show about profit and loss trading. Vector Illustration. Data decrease vectors Business Graph Up and Down, Financial Green arrow up and red arrow down, Stock market concept. Vector illustration. Business Graph Up and Down, Financial Green arrow up and red arrow down. Stock exchange concept show about profit and loss trading. Vector Illustration
Free with trial Global economic recession concept as illustration. Declining world economy represented by globe and world map with flat design. Data decrease vectors Global economic recession concept as illustration. Declining world economy represented by globe and world map
Free with trial Charts and Diagrams Vector Color Line Icon Set. Contains such Icons as Bubble Chart, Column Chart, Pie Chart, Bar Chart, Network Diagram and more. Expanded Stroke. Data decrease vectors Charts and Diagrams Vector Color Line Icon Set. Contains such Icons as Bubble Chart, Column Chart, Pie Chart, Bar Chart and more. Charts and Diagrams Vector Color Line Icon Set. Contains such Icons as Bubble Chart, Column Chart, Pie Chart, Bar Chart, Network Diagram and more. Expanded Stroke
Free with trial Stock Market icons set vector illustration. Contains such icon as Candle Graph, AI, IPO, Investment, Portfolio and more. Expanded Stroke. Data decrease vectors Stock Market icons set vector illustration. Contains such icon as Candle Graph, AI, IPO, Investment and more. Expanded Stroke
Free with trial Quality and finance statistical control. Six sigma chart. Data decrease illustrations Statistical control
Free with trial Man standing in the middle of business diagram. Data decrease illustrations Business diagram
Free with trial Chart with downwards arrow over map of Europe. Data decrease illustrations Chart Europe down. Chart with downwards arrow over map of Europe
Free with trial Optimism: searching for the good economical results, isolated on white. Data decrease illustrations Optimism: searching for the good results. Optimism: searching for the good economical results, isolated on white
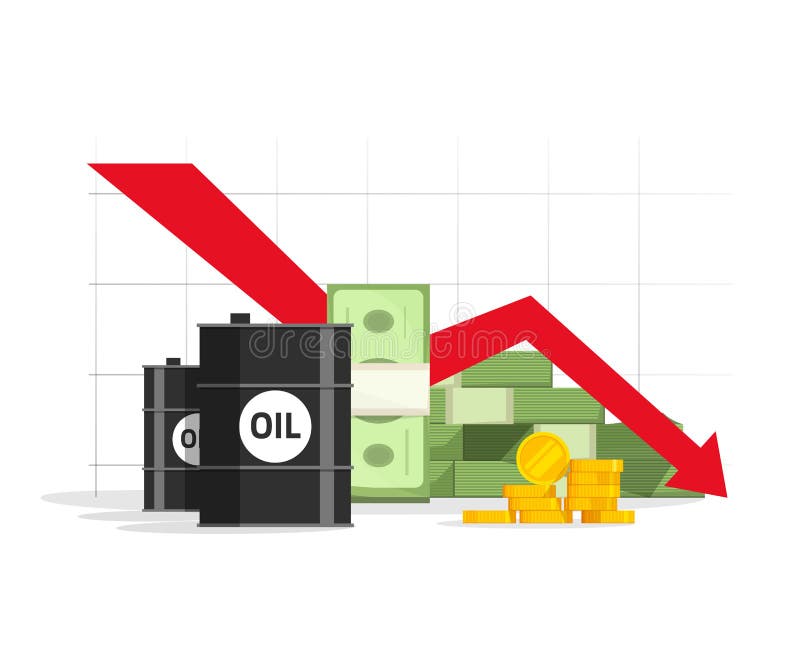
Free with trial Oil, money cash and gold with down arrow graph vector illustration, concept economy crisis, low budget, price decrease, stock market financial data, negative income. Data decrease vectors Concept of economy crisis, low budget, price decrease, stock market financial data, negative income. Oil, money cash and gold with down arrow graph vector illustration, concept economy crisis, low budget, price decrease, stock market financial data, negative income
Free with trial Set of modern flat design templates for Business, financial, big data, cost reduction, delivery. Easy to edit and customize. Modern Vector illustration concepts for business, landing, page, bundle, group, collection, character, people, social, media, graph, finance, investment, chart, growth, accounting, report, money, management, digital, technology, information, internet, science, software, binary, cut, decrease, plan, reduce, service, courier, package, transport, fast, shipping, express. Data decrease vectors Set of modern flat design templates for Business, financial, big data, cost reduction, delivery. Easy to edit and customize.
Free with trial Up and down graph icons. Arrow charts, growth diagram and decline graph, business data analysis and financial trend. Market statistic information vector set. Increase and decrease graph symbols. Data decrease vectors Up and down graph icons. Arrow charts, growth diagram and decline graph, business data analysis and financial trend. Market. Statistic information vector set. Up and down graph icons. Arrow charts, growth diagram and decline graph, business data analysis and financial trend. Market statistic information vector set. Increase and decrease graph symbols.
Free with trial Decrease fading revenue chart illustration financial data, report downturn, performance metrics decrease fading revenue chart. Data decrease illustrations Decrease fading revenue chart
Free with trial Colorful decrease diagram vector and isolated. Data decrease vectors Decrease diagram
Free with trial Background business, abstract image of a computer screen of abstract stock market data. Data decrease illustrations Stock Market Data Screen. Background business, abstract image of a computer screen of abstract stock market data
Free with trial Background business, abstract image of a computer screen of abstract stock market data. Data decrease illustrations Global Market Data Screen. Background business, abstract image of a computer screen of abstract stock market data
Free with trial Man look graphic chart, business analytics concept, big data processing icon, virtual reality interface, server room admin administrator, isometric illustration vector neon dark. Data decrease vectors Man look graphic chart, business analytics concept, big data processing icon, virtual reality interface, server room
Free with trial 3D Illustration of business chart decrease. Data decrease illustrations Chart decrease
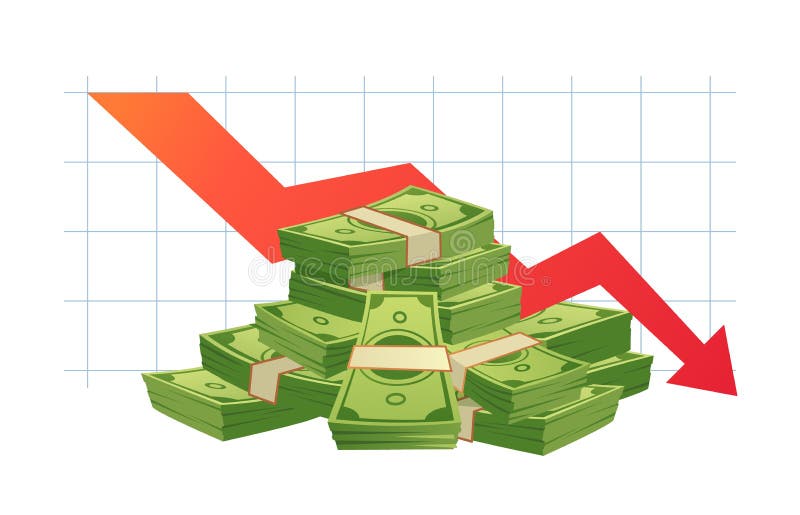
Free with trial Cash loss graph. Finance inflation schedule, money loss and decrease in income. Trader loss data, budget losses graph or investment bankruptcies isolated vector illustration. Data decrease vectors Cash loss graph. Finance inflation schedule, money loss and decrease in income vector illustration. Cash loss graph. Finance inflation schedule, money loss and decrease in income. Trader loss data, budget losses graph or investment bankruptcies isolated vector illustration
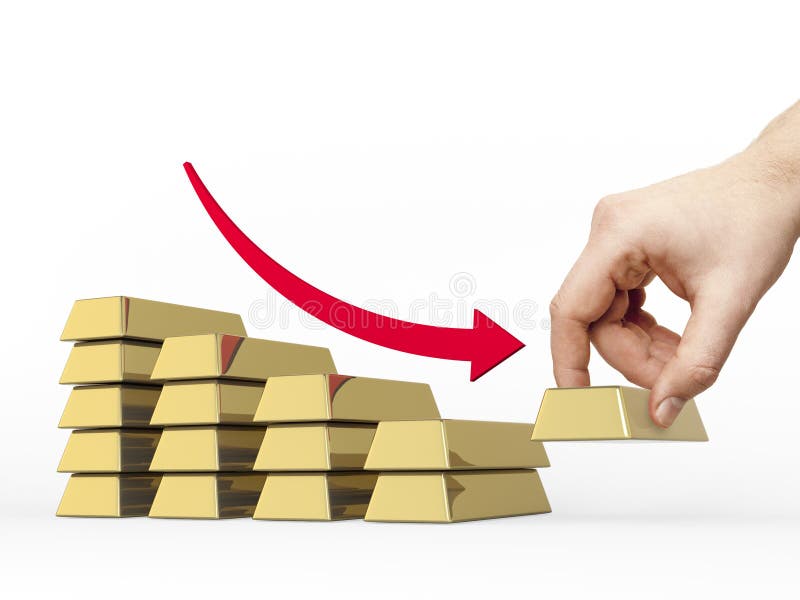
Free with trial Decrease bar chart made of golden bars. Hand take off the bottom bar. Red arrow shows decrease. Data decrease illustrations Decrease bar chart made of golden bars
Free with trial Business decrease or negative results of petroleum industry illustration. Data decrease illustrations Business decrease or negative results of petroleum industry
Free with trial Decrease graph. Businessman hand down profit business chart. Stock financial trade market diagram. Vector illustration flat design. Isolated on white background. Declining graph. Downward arrow. Data decrease vectors Decrease graph vector isolated icon on blue background. Decrease graph. Businessman hand down profit business chart. Stock financial trade market diagram. Vector illustration flat design. Isolated on white background. Declining graph. Downward arrow.
Free with trial Illustration of decrease graph on white background. Data decrease vectors Decrease graph on white background
Free with trial Dollar down icon. Money decrease symbol. Financial loss sign vector. Data decrease vectors Dollar down icon. Money decrease symbol. Financial loss sign
Free with trial Decrease graph icon. Businessman hand down profit business chart. Stock financial trade market diagram. Vector illustration flat design. Isolated on white background. Declining graph. Downward arrow. Data decrease vectors Decrease graph icon
Free with trial Up and down graph chart icon. Growth increase and decrease sign. Graph or diagram with arrow going up and down. Vector illustration. Data decrease vectors Up and down graph chart icon. Growth increase and decrease sign. Graph or diagram with arrow going up and down. Vector
Free with trial Modern business crisis collage witt business analyzing shocking falling stats graph symbolizing global decrease. Data decrease illustrations Modern business crisis collage witt business analyzing shocking falling stats graph symbolizing global decrease
Free with trial Graph line icons. Vector illustration include icon - data analysis, diagram, stat, histogram, economy outline pictogram for infographic statistic presentation. Green Color, Editable Stroke. Data decrease illustrations Graph line icons. Vector illustration include icon - data analysis, diagram, stat, histogram, economy outline pictogram
Free with trial Reduce factory pollution to help stop climate change or global warming, ecology to decrease carbon dioxide and sustainability concept, business leader use finger to block, stop or clog factory chimney. Data decrease vectors Reduce factory pollution to help stop climate change or global warming, ecology to decrease carbon dioxide and sustainability
Free with trial Silver and Red 3D Profit Decrease Background. Data decrease illustrations 3D Profit Decrease Background
Free with trial Assessment icons in line design. Assessment, data, analysis, compare, plan, analysis, testing, report, management isolated on white background vector Assessment editable stroke icons. Data decrease vectors Assessment icons in line design. Assessment, data, analysis, compare, plan, analysis, testing, report, management
Free with trial Financial arrows up and down. chart increase, decrease sign with green and red arrows. vector graph with green and red arrows design. Data decrease vectors Financial arrows up and down. chart increase, decrease sign with green and red arrows. vector graph with green and red arrows
Free with trial Assessment icons in line design, blue. Assessment, data, analysis, compare, plan, analysis, testing, report, management isolated on white background vector Assessment editable stroke icons. Data decrease vectors Assessment icons in line design, blue. Assessment, data, analysis, compare, plan, analysis, testing, report, management
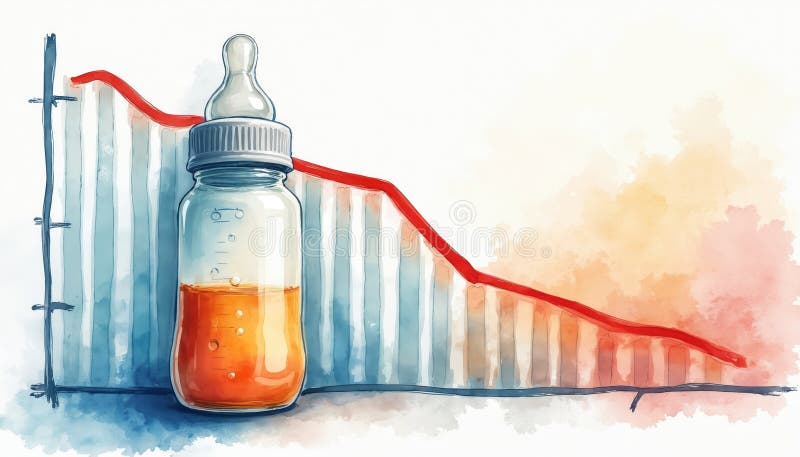
Free with trial Watercolor illustration baby bottle chart shows declining birth rate, metaphor. Falling trend, family, population decrease, economic impact, social issues future concerns. Concept. Data decrease illustrations Watercolor illustration baby bottle chart shows declining birth rate, metaphor. Falling trend, family, population decrease
Free with trial Businessman presenting falling down arrow for businesspeople at conference meeting decrease economical financial crisis failure concept full length horizontal vector illustration. Data decrease vectors Businessman presenting falling down arrow for businesspeople at conference meeting decrease economical financial crisis
Free with trial Chart glyph icon, finance and banking, decrease sign, vector graphics, a solid pattern on a white background, eps 10. Data decrease vectors Chart glyph icon, finance and banking, decrease
Free with trial Data analytics ascending icon from user interface outline collection. Thin line data analytics ascending icon isolated on white background. Data decrease vectors Data analytics ascending icon from user interface outline collection. Thin line data analytics ascending icon isolated on white
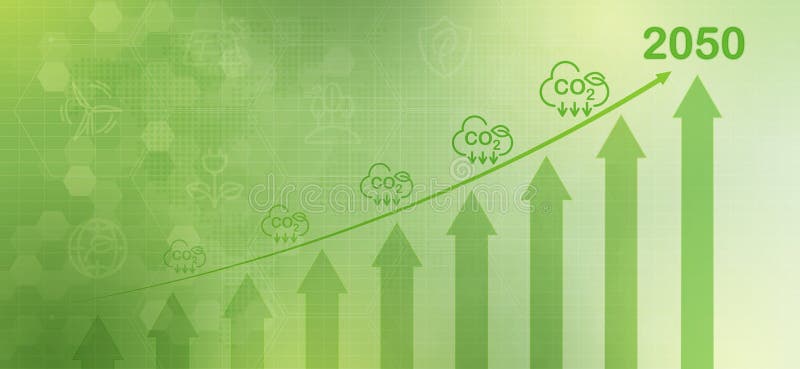
Free with trial Graph reduce CO2 or carbon concept. futuristic decrease down graph chart. CO2 emission using clean energy and limit global warming. green business from renewable energy. vector design. Data decrease illustrations Graph reduce CO2 or carbon concept. futuristic decrease down graph chart. CO2 emission using clean energy and limit global warming
Free with trial Assessment web icons set in thin line design. Pack of process, report, feedback, auditor, solution, strategy, time management, decrease, result, data analysis, other. Vector outline stroke pictograms. Data decrease illustrations Assessment web icons set in thin line design. Vector outline stroke pictograms. Assessment web icons set in thin line design. Pack of process, report, feedback, auditor, solution, strategy, time management, decrease, result, data analysis, other. Vector outline stroke pictograms
Free with trial Financial growth chart with trend line graph. Growth bar chart of economy. Financial decline. Economic crisis, decrease graph. Profit down. Vector illustration isolated on white background. Data decrease vectors Financial growth chart with trend line graph. Growth bar chart of economy. Financial decline. Economic crisis, decrease graph.
Free with trial Inefficient decrease like operational metric icon. flat linear trend modern sla logotype graphic stroke art design isolated on white. concept of easy business strategy or flexible crisis methodology. Data decrease vectors Inefficient decrease like operational metric icon
Free with trial Like, Update data and Graph chart icons simple set. Halftone dots button. Customisation sign. Social media likes, Sales chart, Growth report. Settings. Technology set. Classic flat like icon. Vector. Data decrease vectors Like, Update data and Graph chart icons set. Customisation sign. Vector. Like, Update data and Graph chart icons simple set. Halftone dots button. Customisation sign. Social media likes, Sales chart, Growth report. Settings. Technology set. Classic flat like icon. Vector
Free with trial Data slice in the volume of the distribution function of point data. Three-dimensional flow of analytical information. The bulge of the mountain in the context of science. Data decrease illustrations Data slice in the volume function of point data. Three-dimensional flow information. The bulge of the mountain science. Data slice in the volume of the distribution function of point data. Three-dimensional flow of analytical information. The bulge of the mountain in the context of science
Free with trial Missing data on analytics line graphic vector icon on white background. Flat vector missing data on analytics line graphic icon symbol sign from modern business collection for mobile concept and web. Data decrease vectors Missing data on analytics line graphic vector icon on white background. Flat vector missing data on analytics line graphic icon
Free with trial Chart, data, graph, reports, valuation Flat Color Icon Vector. Data decrease vectors Chart, data, graph, reports, valuation Flat Color Icon Vector
Free with trial Business growth up and down infographics | business graph going down | 3d graph chart decrease infographics - 4k desktop background. Data decrease illustrations Business growth up and down infographics | business graph going down | 3d graph chart decrease infographics. Business growth up and down infographics | business graph going down | 3d graph chart decrease infographics - 4k desktop background
Free with trial Reputation Decrease Graphic icon. Monochrome style design from diagram collection. UI. Pixel perfect simple pictogram reputation decrease graphic icon. Web design, apps, software, print usage. Data decrease illustrations Reputation Decrease Graphic icon. Monochrome style design from diagram icon collection. UI. Pixel perfect simple pictogram reputat. Reputation Decrease Graphic icon. Monochrome style design from diagram collection. UI. Pixel perfect simple pictogram reputation decrease graphic icon. Web design, apps, software, print usage.
Free with trial Downtrend arrow chart. Business Technological polygonal market Vector neon illustration. Low poly trend, data cash, finance concept. Connection lines, dots, wireframe mesh structure on blue background. Data decrease vectors Downtrend arrow chart. Business polygonal crisis market Vector neon. Low poly trend, data cash, finance concept. Downtrend arrow chart. Business Technological polygonal market Vector neon illustration. Low poly trend, data cash, finance concept. Connection lines, dots, wireframe mesh structure on blue background
Free with trial Missing data on analytics line graphic icon in filled, thin line, outline and stroke style. Vector illustration of two colored and black missing data on analytics line graphic vector icons designs. Data decrease vectors Missing data on analytics line graphic icon in filled, thin line, outline and stroke style. Vector illustration of two colored and
Free with trial Glowing red hot bitcoin BTC with explosion particles and warp binary data background. 2d illustration for crypto currency panic sell price drop during bearish downtrend market exchange. Data decrease illustrations Glowing red hot bitcoin BTC with explosion particles and warp binary data background.
Free with trial Futuristic drop arrow chart digital transformation abstract technology background. Big data and business growth currency stock and investment economy. Vector illustration. Data decrease vectors Futuristic drop arrow chart digital transformation abstract technology background. Big data and business growth currency stock and
Free with trial Glowing red hot ethereum ETH with explosion particles and warp binary data background. 2d illustration for crypto currency panic sell price drop during bearish downtrend market exchange. Data decrease illustrations Glowing red hot ethereum ETH with explosion particles and warp binary data background.
Free with trial Chart, data, graph, reports, valuation Icon. Line vector gray symbol for UI and UX, website or mobile application. Vector EPS10 Abstract Template background. Data decrease vectors Chart, data, graph, reports, valuation Icon. Line vector gray symbol for UI and UX, website or mobile application
Free with trial Market trend icon in comic style. Decline arrow with magnifier cartoon vector illustration on white isolated background. Decrease splash effect business concept. Data decrease vectors Market trend icon in comic style. Decline arrow with magnifier cartoon vector illustration on white isolated background. Decrease
Free with trial Market trend icon in comic style. Decline arrow with magnifier cartoon vector illustration on white isolated background. Decrease splash effect business concept. Data decrease vectors Market trend icon in comic style. Decline arrow with magnifier cartoon vector illustration on white isolated background. Decrease
Free with trial Checklist, Elevator and Presentation board icons simple set. Halftone dots button. Megaphone sign. Data list, Lift, Growth chart. Brand advertisement. Technology set. Vector. Data decrease vectors Checklist, Elevator and Presentation board icons set. Megaphone sign. Data list, Lift, Growth chart. Vector. Checklist, Elevator and Presentation board icons simple set. Halftone dots button. Megaphone sign. Data list, Lift, Growth chart. Brand advertisement. Technology set. Vector
Free with trial Data slice in the volume of the distribution function of point data. Three-dimensional flow of analytical information. The bulge of the mountain in the context of science. Data decrease illustrations Data slice in the volume function of point data. Three-dimensional flow information. The bulge of the mountain science. Data slice in the volume of the distribution function of point data. Three-dimensional flow of analytical information. The bulge of the mountain in the context of science
Free with trial Market trend icon in flat style. Decline arrow with magnifier vector illustration on white isolated background. Decrease business concept. Data decrease vectors Market trend icon in flat style. Decline arrow with magnifier vector illustration on white isolated background. Decrease business
Free with trial Dollar rate decrease and increase, money arrow up and down. Vector icon template. Data decrease vectors Dollar rate decrease and increase, money arrow up and down. Vector icon template
Free with trial Decrease icon in different style vector illustration. two colored and black decrease vector icons designed in filled, outline, line and stroke style can be used for web, mobile, ui. Data decrease vectors Decrease icon in different style vector illustration. two colored and black decrease vector icons designed in filled, outline
Free with trial Data analytics descending line graphic outline vector icon. Thin line black data analytics descending line graphic icon, flat vector simple element illustration from editable business concept isolated. Data decrease vectors Data analytics descending line graphic outline vector icon. Thin line black data analytics descending line graphic icon, flat
Free with trial Cylinder shape objects. Decreasing size illustration. Data storage Vector. Volume capacity symbol. EPS 10. Data decrease vectors Cylinder shape objects. Decreasing size illustration. Data storage Vector. Volume capacity symbol.
Free with trial Business investment graph up and down symbol on white background. stock market trend increase and decrease. vector illustration flat design. Data decrease vectors Business investment graph up and down symbol on white background. stock market trend increase and decrease. vector illustration
Free with trial Vector image charts and diagrams for presentation or financial report. Infographics concept. Increase and decrease of indicators in graphic diagram. Colorful vector illustration. Data decrease vectors Vector image charts and diagrams for presentation or financial report. Infographics concept.Increase and decrease of
Free with trial Businessman uses digital tablet to analyze business performance data. Growth graph shows increased quality, decreased costs. Business strategy, project management key concepts. Modern. Data decrease illustrations Businessman uses digital tablet to analyze business performance data. Growth graph shows increased quality, decreased costs.
Free with trial Bar Chart. Covid - 19 data statistic infographic chart template. Chart of Coronavirus Covid -19 pandemic in ascending continues to decrease and ascending again trend. Data decrease vectors Bar chart of Covid-19 developments. Bar Chart. Covid - 19 data statistic infographic chart template. Chart of Coronavirus Covid -19 pandemic in ascending continues to decrease and ascending again trend.
Free with trial 3D Arrows to present your profit or loss, increase or decrease in any sector. Data decrease vectors 3D Arrows