Free with trial An illustration featuring a laptop computer set against chart style background - one with green arrow pointing up and red arrow pointing down. Data decrease illustrations Computer Chart Up and Down. An illustration featuring a laptop computer set against chart style background - one with green arrow pointing up and red arrow pointing down
Free with trial 3d render of bar graph and a hand pressing it down. Data decrease illustrations Bar graph
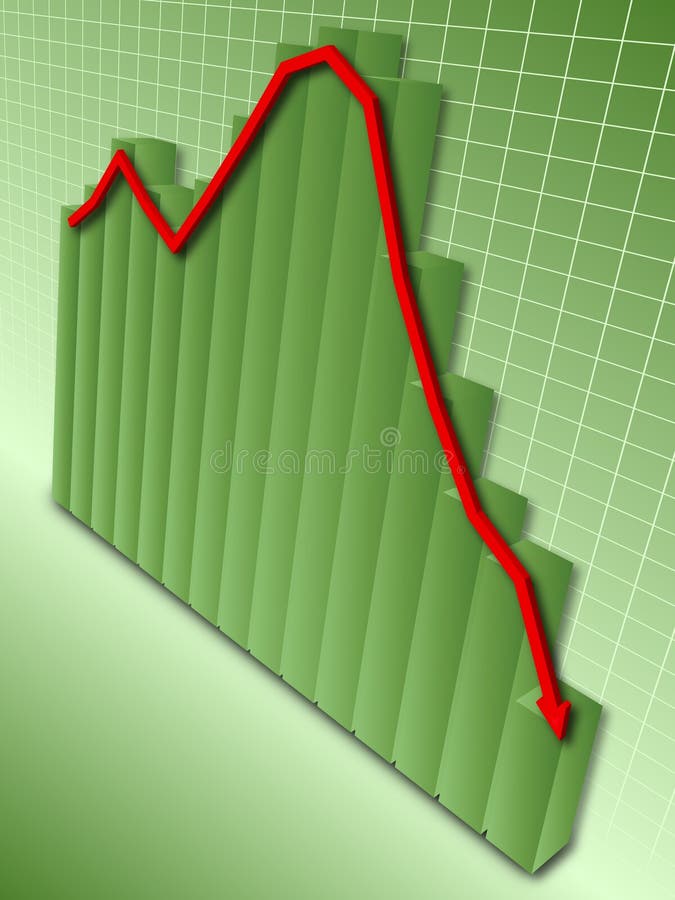
Free with trial Green bar graph with red arrow depicting downward trend of data symbolizing financial loss. Data decrease vectors Financial Loss
Free with trial Background business, abstract image of a computer screen of abstract stock market data. Data decrease illustrations Stock Market Screen. Background business, abstract image of a computer screen of abstract stock market data
Free with trial Statistic. Data analysis. Business and financial concept. Data decrease vectors Statistic
Free with trial Cool infographics bar charts for your business or marketing presentation. These are vector infographs that help you to give a great data visualization examples to your clients or partners. Available in EPS when you download. Data decrease vectors Infographics - Bar Charts. Cool infographics bar charts for your business or marketing presentation. These are vector infographs that help you to give a great data visualization examples to your clients or partners. Available in EPS when you download.
Free with trial Cool infographics business planner for your business or marketing presentation for a monthly task. These are vector infographs that help you to give a great data visualization examples to your clients or partners. Available in EPS when you download. Data decrease vectors Infographics - Business Planner. Cool infographics business planner for your business or marketing presentation for a monthly task. These are vector infographs that help you to give a great data visualization examples to your clients or partners. Available in EPS when you download.
Free with trial Cool infographics demonstrating business opportunities. These are vector infographs that help you to give a great data visualization examples to your clients or partners. Available in EPS when you download. Data decrease vectors Infographics - Business Opportunities. Cool infographics demonstrating business opportunities. These are vector infographs that help you to give a great data visualization examples to your clients or partners. Available in EPS when you download.
Free with trial Chart representing Financial Crisis and Value Decrease. Data decrease illustrations Financial Crisis
Free with trial A 3D render shows a red thermometer with a white scale and a red bulb on the left, next to a blue square icon with two white downward-pointing arrows on the right. Both objects are isolated on a white background. The thermometer indicates a low temperature, and the down arrow suggests a decrease or decline. Data decrease illustrations Red Thermometer Icon Next to Blue Down Arrow Symbol on White Background temperature heat. A 3D render shows a red thermometer with a white scale and a red bulb on the left, next to a blue square icon with two white downward-pointing arrows on the right. Both objects are isolated on a white background. The thermometer indicates a low temperature, and the down arrow suggests a decrease or decline
Free with trial Crisis. Graphs and charts templates. Business infographics. Statistic and data, bankruptcy, financial crisis, money loss, down arrow, economy reduction. Financial chart. Vector illustration. Data decrease vectors Crisis. Graphs and charts templates. Business infographics. Statistic and data, bankruptcy, financial crisis, money loss, down
Free with trial Graph showing decrease in profits or earnings in 3D on white background. Data decrease illustrations Graph showing decrease in profits or earnings
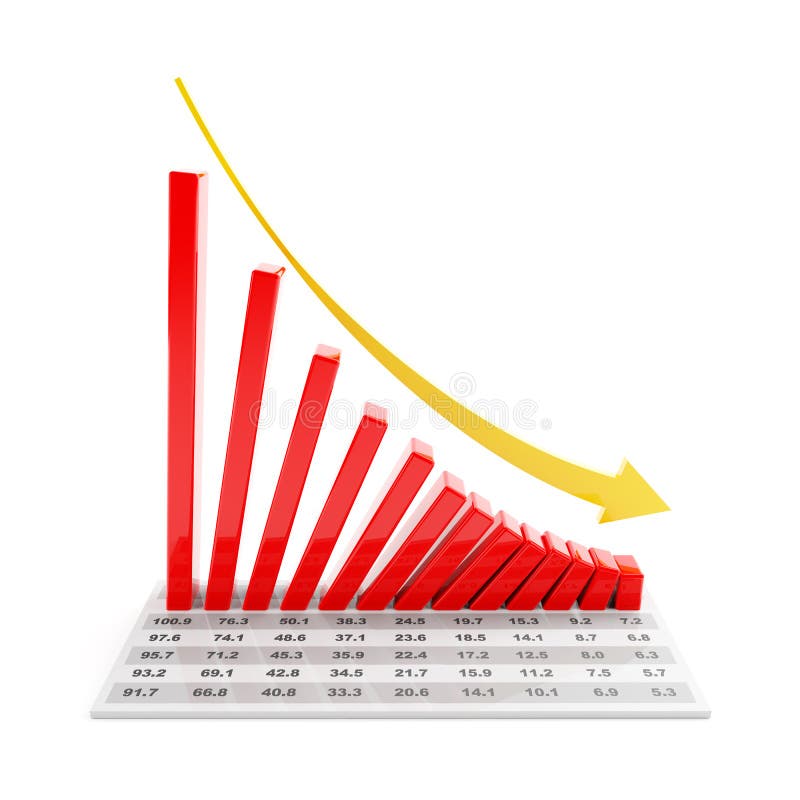
Free with trial Bar graph with data showing falling trend, 3d render. Data decrease illustrations Bar graph showing falling trend, 3d render. Bar graph with data showing falling trend, 3d render
Free with trial Crisis. Graphs and charts templates. Business infographics. Statistic and data, bankruptcy, financial crisis, money loss, down arrow, economy reduction. Financial chart. Vector illustration. Data decrease vectors Crisis. Graphs and charts templates. Business infographics. Statistic and data, bankruptcy, financial crisis, money loss, down
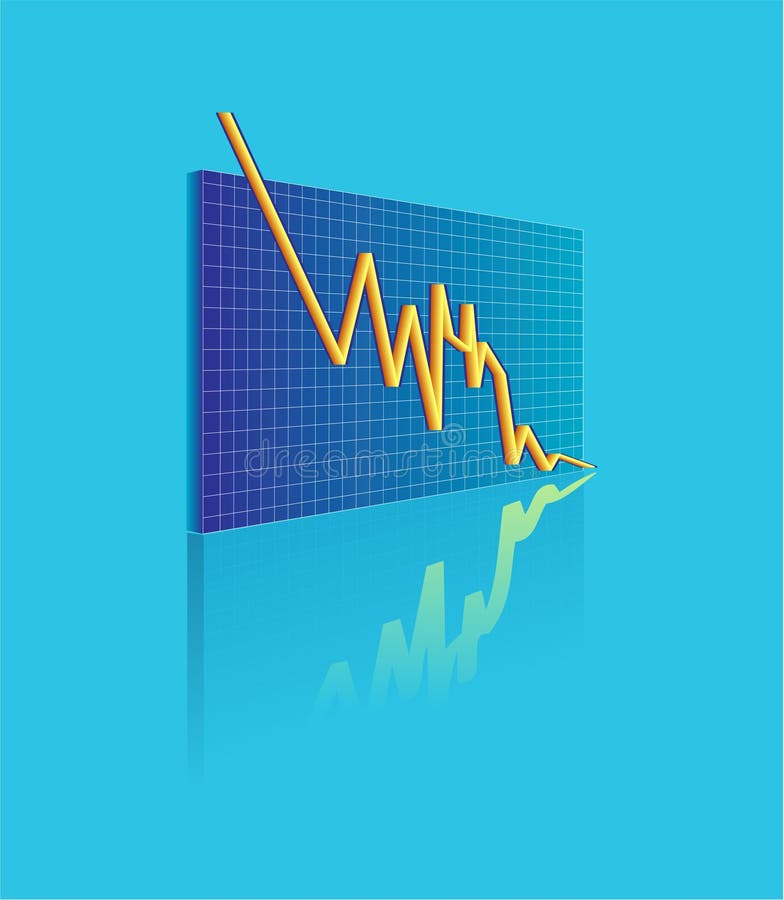
Free with trial A dramatic visual depicting a severe market crash or economic downturn. A vivid red line graph sharply descends, culminating in a downward-pointing arrow, set against a dark, stormy sky infused with abstract digital code elements. The reflective, gridded ground mirrors the ominous trend, amplifying the sense of crisis. This powerful image effectively conveys concepts of financial loss, business failure, data decline, and economic recession, making it suitable for news, financial reports, or presentations on negative market trends and risk. Data decrease illustrations Market Crash and Economic Downturn: Red Graph in Digital Storm. A dramatic visual depicting a severe market crash or economic downturn. A vivid red line graph sharply descends, culminating in a downward-pointing arrow, set against a dark, stormy sky infused with abstract digital code elements. The reflective, gridded ground mirrors the ominous trend, amplifying the sense of crisis. This powerful image effectively conveys concepts of financial loss, business failure, data decline, and economic recession, making it suitable for news, financial reports, or presentations on negative market trends and risk.
Free with trial Composite image of global crisis economy - red toned grunge world map on a data graph and a decline curve with COVID-19 text. Data decrease illustrations Global economy shock. Composite image of global crisis economy - red toned grunge world map on a data graph and a decline curve with COVID-19 text
Free with trial HODL - word in bitcoin trading market data on red background chart. Virtual cryptocurrency concept. Data decrease illustrations HODL - word in bitcoin trading market
Free with trial Business graph with red arrow down represents the decrease, three-dimensional rendering, 3D illustration. Data decrease illustrations Business graph down #2. Business graph with red arrow down represents the decrease, three-dimensional rendering, 3D illustration
Free with trial Red arrow falling. Economic crisis, bankruptcy, recession, decrease and investment concept. Flat design. EPS 8 vector illustration, no transparency, no gradients. Data decrease vectors Perspective arrow, crisis concept. Red arrow falling. Economic crisis, bankruptcy, recession, decrease and investment concept. Flat design. EPS 8 vector illustration, no transparency, no gradients
Free with trial Business graph with red arrow down represents the decrease, three-dimensional rendering, 3D illustration. Data decrease illustrations Business graph down #3. Business graph with red arrow down represents the decrease, three-dimensional rendering, 3D illustration
Free with trial Set statistics icon. Graphic analysis and asset management. Information chart profits. Business efficiency and investment. finance data. Line art, web and mobile app. Data decrease vectors Set statistics icon
Free with trial Steps of recession, decrease business concept. Blue arrow depict decline business. Flat illustration of downward arrow. Vector template element for infographic, web, presentation, social networks. Data decrease vectors Recession, decline business arrow. Decreasing graph flat vector. Steps of recession, decrease business concept. Blue arrow depict decline business. Flat illustration of downward arrow. Vector template element for infographic, web, presentation, social networks.
Free with trial A 3D red arrow with a white percentage symbol points downwards, indicating a decrease. Isolated on a transparent background. Data decrease vectors Red arrow with percentage symbol pointing down isolated on a transparent background 1. A 3D red arrow with a white percentage symbol points downwards, indicating. A 3D red arrow with a white percentage symbol points downwards, indicating a decrease. Isolated on a transparent background
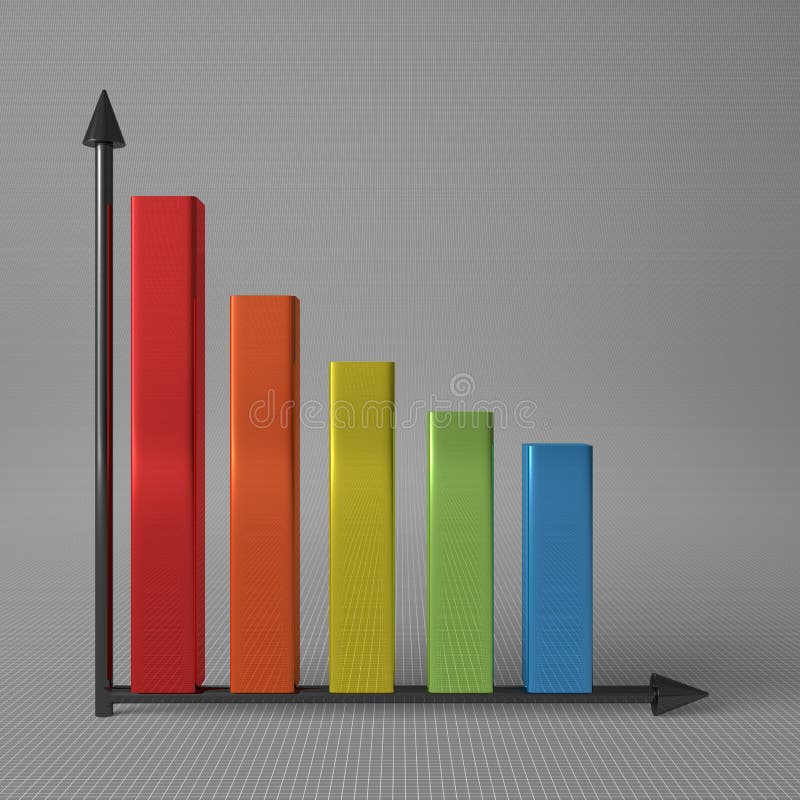
Free with trial Multicolor glossy bar chart showing decrease, with two black axis, standing on gray background, front view. Data decrease illustrations Bar chart with axis. Multicolor glossy bar chart showing decrease, with two black axis, standing on gray background, front view
Free with trial Set statistics icon. Graphic analysis and asset management. Information chart profits. Business efficiency and investment. finance data. flat design. Data decrease vectors Set statistics icon
Free with trial Business strategy conference or meeting office workers graphic or chart vector boss and employee with pointer financial statistics and analytical data coworkers teamwork or cooperation businessman. Data decrease vectors Office workers business graphics meetings and conferences boss and employee. Business strategy conference or meeting office workers graphic or chart vector boss and employee with pointer financial statistics and analytical data coworkers teamwork or cooperation businessman
Free with trial Business Crash Meaning Progress Report And Data. Data decrease illustrations Business Crash Shows Financial Report And Biz. Business Crash Meaning Progress Report And Data
Free with trial Modern reduction line icon. Premium pictogram isolated on a white background. Vector illustration. Stroke high quality symbol. Decrease icon in modern line style. Data decrease vectors Modern reduction line icon.
Free with trial 3d renderer illustration. White Business people with red arrow falling. Decrease concept. white background. Data decrease illustrations 3d White people with red arrow falling. Decrease concept. 3d renderer illustration. White Business people with red arrow falling. Decrease concept. white background
Free with trial 3d renderer illustration. White Business people with red arrow falling. Decrease concept. white background. Data decrease illustrations 3d White people with red arrow falling. Decrease concept. 3d renderer illustration. White Business people with red arrow falling. Decrease concept. white background
Free with trial Business analytics doodle vectors pack, consisting all the geometrical data charts in editable style. Use it for your web and commercial projects. Data decrease vectors Business Analytics Doodle Icons. Business analytics doodle vectors pack, consisting all the geometrical data charts in editable style. Use it for your web and commercial projects.
Free with trial Holographic globe with neon green and blue charts on dark blue and plaid backgrounds. Chaotic data in numbers. Indicators of growth and falls. 3d rendering. Data decrease illustrations Neon green, blue chart waves with the holographic globe. Holographic globe with neon green and blue charts on dark blue and plaid backgrounds. Chaotic data in numbers. Indicators of growth and falls. 3d rendering
Free with trial Modern reduction line icon. Premium pictogram isolated on a white background. Vector illustration. Stroke high quality symbol. Decrease icon in modern line style. Data decrease vectors Modern reduction line icon.
Free with trial Euro currency downtrend arrow chart. Business Technological polygonal Vector neon 3d illustration. Low poly success, data cash, finance concept. Connection wireframe mesh structure on blue background. Data decrease vectors Downtrend arrow Euro chart 3d Vector neon polygonal cryptocurrency Low poly business, crash, cash, finance concept. Euro currency downtrend arrow chart. Business Technological polygonal Vector neon 3d illustration. Low poly success, data cash, finance concept. Connection wireframe mesh structure on blue background
Free with trial Concept Of Mortgage rate decline visualized as house symbol decrease. Data decrease illustrations Mortgage rate decline visualized as house symbol decrease
Free with trial Online financial analysis line icon. linear style sign for mobile concept and web design. Laptop with decrease dollar rate outline vector icon. Symbol, logo illustration. Vector graphics. Data decrease vectors Online financial analysis line icon
Free with trial 3d renderer illustration. White Business people with red arrow falling. Decrease concept. white background. Data decrease illustrations 3d White people with red arrow falling. Decrease concept. 3d renderer illustration. White Business people with red arrow falling. Decrease concept. white background
Free with trial Bitcoin graph billboard icon flat vector. Pay finance. Digital data price. Data decrease illustrations Bitcoin graph billboard icon flat vector. Pay finance
Free with trial Bitcoin change icon flat vector. Online monetary system. Data price salary. Data decrease vectors Bitcoin change icon flat vector. Online monetary system
Free with trial Modern reduction line icon. Premium pictogram isolated on a white background. Vector illustration. Stroke high quality symbol. Decrease icon in modern line style. Data decrease vectors Modern reduction line icon.
Free with trial Bar chart or bar graph decreasing vector icon with drop down arrow. Statistical data of stock, financial in business to loss, negative, decline or crisis. Graphic for report, presentation. 48x48 px. n. Data decrease vectors Bar chart or bar graph decreasing vector icon with drop down arrow. 48x48 pixel perfect and editable stroke. Bar chart or bar graph decreasing vector icon with drop down arrow. Statistical data of stock, financial in business to loss, negative, decline or crisis. Graphic for report, presentation. 48x48 px.n
Free with trial Conference or meeting business strategy office workers graphic or chart vector men boss and employee with pointer financial statistics and analytical data coworkers teamwork or cooperation businessman. Data decrease vectors Business meeting or conference office workers graphic or chart. Conference or meeting business strategy office workers graphic or chart vector men boss and employee with pointer financial statistics and analytical data coworkers teamwork or cooperation businessman.
Free with trial Bar chart or bar graph decreasing vector icon with drop down arrow. Statistical data of stock, financial in business to loss, negative, decline or crisis. Graphic for report, presentation. 48x48 px. n. Data decrease illustrations Bar chart or bar graph decreasing vector icon with drop down arrow. 48x48 pixel perfect and editable stroke. Bar chart or bar graph decreasing vector icon with drop down arrow. Statistical data of stock, financial in business to loss, negative, decline or crisis. Graphic for report, presentation. 48x48 px.n
Free with trial Credit Score. Man Increasing Credit Rating for Low Rates. Interest Rates Dropping. Client Decrease Percent. Concept of Credit Report, Banking Service, Mortgage Loan. Vector illustration for Web Design. Data decrease vectors Credit Score. Man Increasing Credit Rating for Low Rates. Interest Rates Dropping. Client Decrease Percent. Concept of Credit
Free with trial Down market, decrease graph icon design vector. Data decrease vectors Down market, decrease graph icon design
Free with trial Bar chart or bar graph decreasing vector icon with drop down arrow. Statistical data of stock, financial in business to loss, negative, decline or crisis. Graphic for report, presentation. 48x48 px. n. Data decrease vectors Bar chart or bar graph decreasing vector icon with drop down arrow. 48x48 pixel perfect and editable stroke. Bar chart or bar graph decreasing vector icon with drop down arrow. Statistical data of stock, financial in business to loss, negative, decline or crisis. Graphic for report, presentation. 48x48 px.n
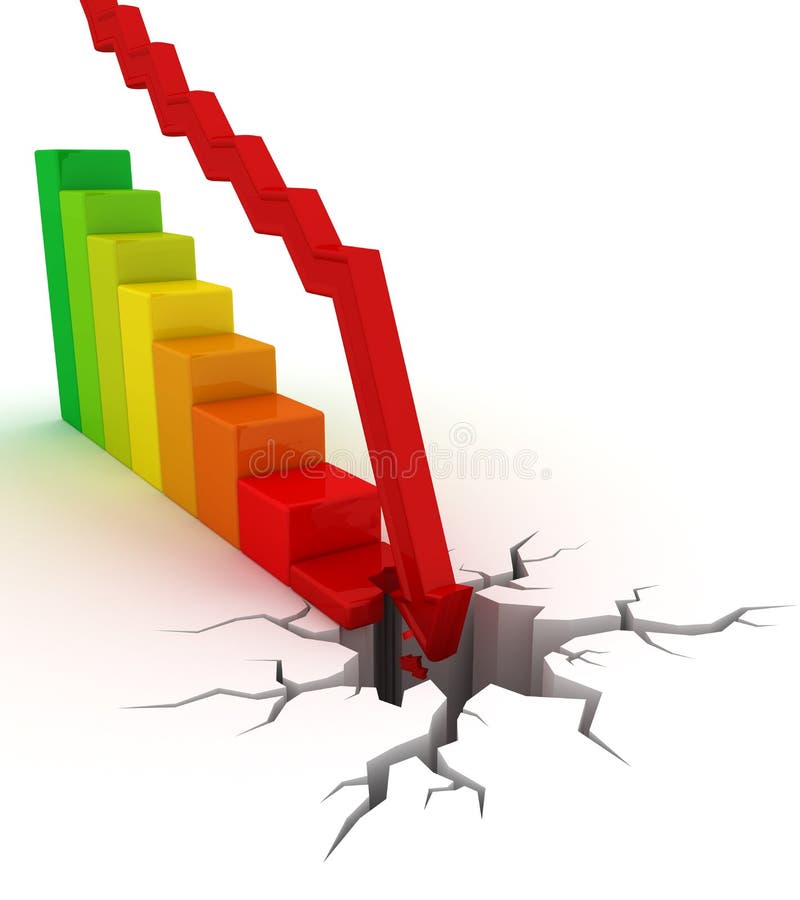
Free with trial This 3D rendering showcases a downward trending red arrow overlaid on a staircase, visually representing a declining market. The bar graph at the bottom further emphasizes the decrease. This image was generated by AI, ideal for illustrating financial news or presentations. Data decrease illustrations Falling Market Trend. This 3D rendering showcases a downward trending red arrow overlaid on a staircase, visually representing a declining market. The bar graph at the bottom further emphasizes the decrease. This image was generated by AI, ideal for illustrating financial news or presentations.
Free with trial Winner, Uv protection and Financial diagram line icons set. Timeline process infograph. Loan percent sign. Best results, Skin cream, Candlestick chart. Decrease rate. Business set. Vector. Data decrease vectors Winner, Uv protection and Financial diagram icons set. Loan percent sign. Vector. Winner, Uv protection and Financial diagram line icons set. Timeline process infograph. Loan percent sign. Best results, Skin cream, Candlestick chart. Decrease rate. Business set. Vector
Free with trial Trade chart, Web report and Truck delivery icons simple set. Comparison table. Pencil sign. Market data, Graph chart, Express service. Edit data. Business set. Pricing plan. Compare products. Vector. Data decrease vectors Trade chart, Web report and Truck delivery icons set. Pencil sign. Market data, Graph chart, Express service. Vector. Trade chart, Web report and Truck delivery icons simple set. Comparison table. Pencil sign. Market data, Graph chart, Express service. Edit data. Business set. Pricing plan. Compare products. Vector
Free with trial Red business graph with red arrow down, represents decrease in the year 2020, three-dimensional rendering, 3D illustration. Data decrease illustrations Business graph down 2020. Red business graph with red arrow down, represents decrease in the year 2020, three-dimensional rendering, 3D illustration
Free with trial Red business graph with red arrow down, represents decrease in the year 2019, three-dimensional rendering, 3D illustration. Data decrease illustrations Business graph down 2019. Red business graph with red arrow down, represents decrease in the year 2019, three-dimensional rendering, 3D illustration
Free with trial Economic balance of decrease on the background of a worker. Data decrease vectors Vector Worker. Economic balance of decrease on the background of a worker.
Free with trial Falling performance alert concept, graph going down with alert word. Data decrease illustrations Performance alert
Free with trial A bar chart in metallic style over white. Data decrease illustrations Bar Chart metallic. A bar chart in metallic style over white
Free with trial Vector illustration of people climbing ladder. Data decrease vectors To The Top. Vector illustration of people climbing ladder
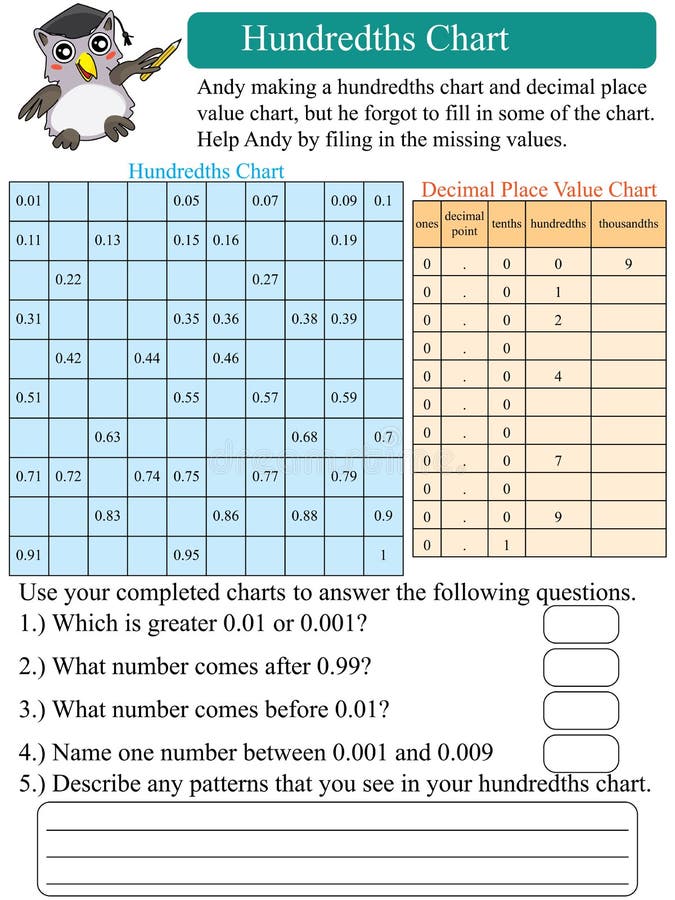
Free with trial Illustration design mathematics hundredths chart question. Data decrease vectors Mathematics hundredths chart
Free with trial A conceptual image of a clipboard with a pie chart on it with a floating pen and some paper. Data decrease illustrations Clipboard With Piechart 71. A conceptual image of a clipboard with a pie chart on it with a floating pen and some paper.
Free with trial Business diagram glas bars in motion building a stair and showing success. Data decrease illustrations Bar Chart In Motion. Business diagram glas bars in motion building a stair and showing success
Free with trial Three dimensional orange chart isolated on white background. Data decrease vectors Three dimensional orange chart
Free with trial Businessman in the background of a declining graph. Data decrease illustrations Declining graph
Free with trial 3D finance crisis graph showing decrease. Data decrease illustrations 3D finance crisis graph
Free with trial Hammer smashing down sales price-illustration,. Data decrease illustrations Euro down. Hammer smashing down sales price-illustration,
Free with trial Flat vector scheme of web analytics information, development and statistic. Vector illustration. Data decrease vectors Web analytics
Free with trial Bar Graphs on white background. Data decrease vectors Vector Bar graphs. Bar Graphs on white background
Free with trial Business collapse. This is a 3D rendered picture. Data decrease illustrations Business collapse
Free with trial 3d rendered illustration of a display with a falling statistic. Data decrease illustrations Falling statistic
Free with trial Business collapse. This is a 3D rendered picture. Data decrease illustrations Business collapse
Free with trial 3D Illustration of business chart up and down. Data decrease illustrations Chart up and down
Free with trial Flat 3d isometric design of processing concept. Data decrease vectors Processing concept
Free with trial An illustration showing financial fluctuation on a board. Data decrease vectors Vector statistics. An illustration showing financial fluctuation on a board.
Free with trial An Image representing global inequality. Data decrease illustrations The Rich Poor Divide. An Image representing global inequality.
Free with trial An image of a graphical pie chart, it could be useful for business concepts. Data decrease illustrations Pie Chart 127. An image of a graphical pie chart, it could be useful for business concepts.
Free with trial Stock market charts and graphs, Vector illustration template design. Data decrease vectors Vector stock market charts and graphs. Stock market charts and graphs, Vector illustration template design
Free with trial Speech bubble business graph illustration design over white. Data decrease illustrations Speech bubble business graph
Free with trial World background illustration of global economics. Data decrease vectors World background