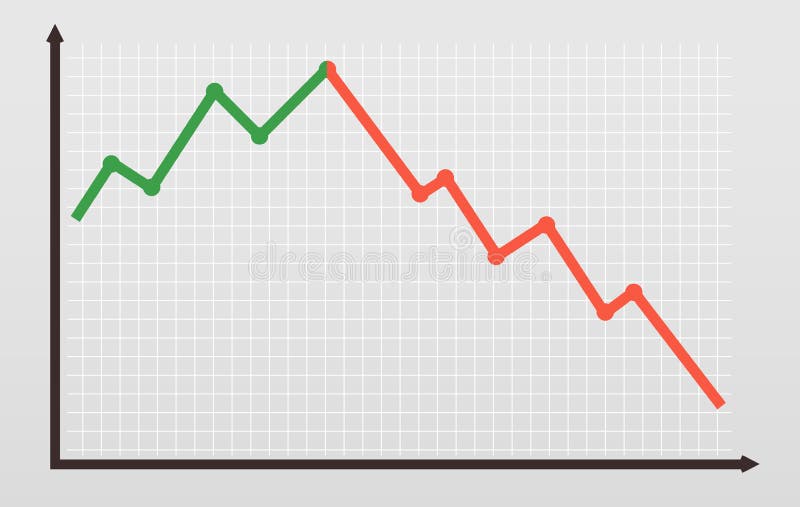
Free with trial Decreasing Report Meaning Graphic Statistics And Trend. Data decrease illustrations Decreasing Report Shows Graphic Analysis And Graphs. Decreasing Report Meaning Graphic Statistics And Trend
Free with trial 3d illustration of down diagram with dollar sign. Data decrease illustrations Falling dollar. 3d illustration of down diagram with dollar sign
Free with trial Blackboard with declining chart. Data decrease illustrations Blackboard with declining chart
Free with trial An image of a graphical pie chart, it could be useful for business concepts. Data decrease illustrations Pie Chart 132. An image of a graphical pie chart, it could be useful for business concepts.
Free with trial Triple colored arrow on isolated on white, 3D render. Data decrease illustrations Triple arrow on white. Triple colored arrow on isolated on white, 3D render
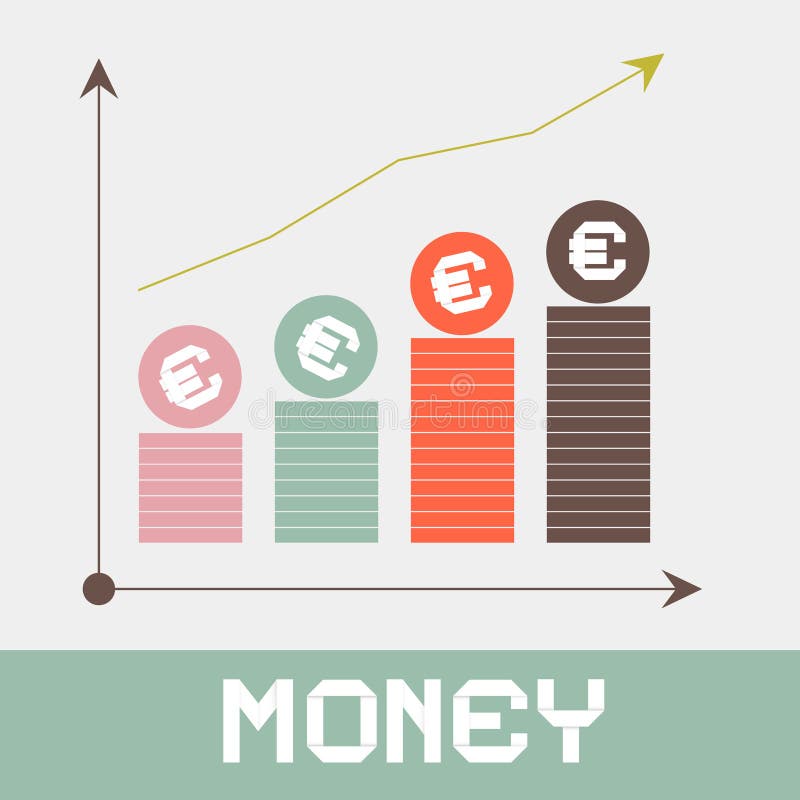
Free with trial Diagramme of falling of an euro exchange rate. Data decrease illustrations Diagramme of falling euro. Diagramme of falling of an euro exchange rate
Free with trial Declining business arrow on diagram of growth, downward green arrow. vector graph icon. eps10. Data decrease illustrations Declining business arrow on diagram of growth, downward green arrow. vector graph icon. eps10
Free with trial Set chart graph icon positive, negative infographic, layered. Data decrease vectors Set chart graph positive, negative infographic. Set chart graph icon positive, negative infographic, layered.
Free with trial Financial Stock Market Crisis During Coronavirus. Data decrease illustrations Coronavirus And Financial Stock Market Crisis. Financial Stock Market Crisis During Coronavirus
Free with trial An image of a glass graphical pie chart, it could be useful for business concepts. Data decrease illustrations Glass Pie Chart 1. An image of a glass graphical pie chart, it could be useful for business concepts.
Free with trial Inflation goods price increase macro economy indicator blue illustration concept shoppingvector. Data decrease vectors Inflation goods price increase macro economy indicator blue illustration concept grocery. Inflation goods price increase macro economy indicator blue illustration concept shoppingvector
Free with trial Digital illustration of increase graph in white background. Data decrease illustrations Increase graph
Free with trial Income fall. Business recession and financial losses vector illustration, arrow down money budget low, stocks reduction and expenses costs concept, profitability crisis graph downward. Data decrease vectors Income fall graph downward. Income fall. Business recession and financial losses vector illustration, arrow down money budget low, stocks reduction and expenses costs concept, profitability crisis graph downward
Free with trial Real estate falling chart with globe, 3d render, white background. Data decrease illustrations Real estate falling chart with globe, 3d render
Free with trial 3D Illustration of business chart up and down. Data decrease illustrations Chart up and down
Free with trial Notepad sketch business analysis background frame illustration. Data decrease illustrations Notepad sketch business analysis background frame
Free with trial Inflation goods price increase macro economy indicator blue illustration concept shopping grocery vector. Data decrease vectors Inflation goods price increase macro economy indicator blue illustration concept shopping grocery
Free with trial Stats graph background with results going up or down in small increments. Data decrease illustrations Growth graph. Stats graph background with results going up or down in small increments
Free with trial Deduction poster with images hands and scissors that are cutting piece of paper with tax written on it, vector illustration isolated on white background. Data decrease vectors Deduction poster with hands and scissors on vector illustration. Deduction poster with images hands and scissors that are cutting piece of paper with tax written on it, vector illustration isolated on white background
Free with trial Bad finance graph. Loss of financial savings, inflation schedule and money loss. Bankruptcy, financial investment loss or market debt crisis. Low finance business isolated vector illustration. Data decrease vectors Bad finance graph. Loss of financial savings, inflation schedule and money loss. Bankruptcy vector illustration. Bad finance graph. Loss of financial savings, inflation schedule and money loss. Bankruptcy, financial investment loss or market debt crisis. Low finance business isolated vector illustration
Free with trial Graphs with arrows going up and down illustration on white background. Business chart drawing. Data decrease illustrations Graphs with arrows going up and down freehand drawing. Graphs with arrows going up and down illustration on white background. Business chart drawing
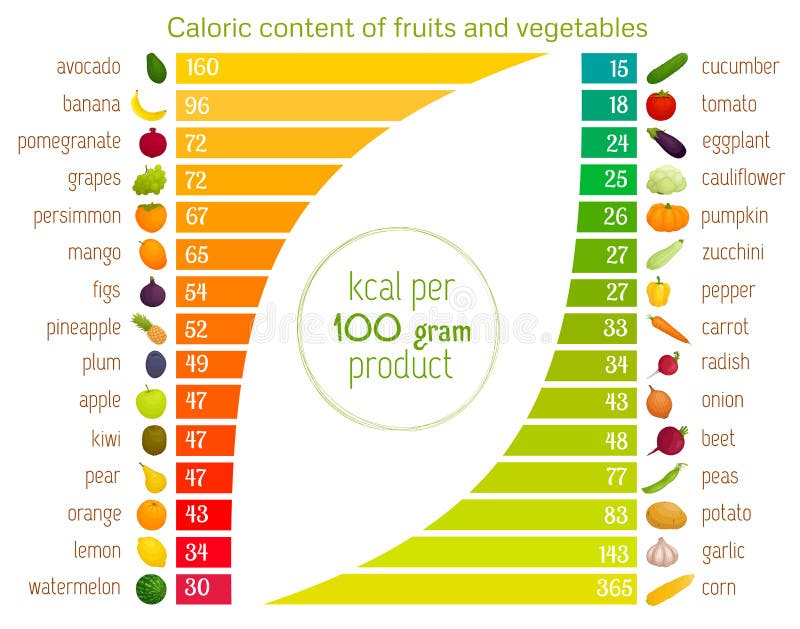
Free with trial Caloric content of vegetables and fruits in ascending order. Informative visual collage about healthy nutrition. Vector infographics and a table with values. Data decrease vectors Infographics on the calorie content of food. Vector. Caloric content of vegetables and fruits in ascending order. Informative visual collage about healthy nutrition. Vector infographics and a table with values.
Free with trial An image of a graphical pie chart, it could be useful for business concepts. Data decrease illustrations Pie Chart 122. An image of a graphical pie chart, it could be useful for business concepts.
Free with trial Business graph showing decreasing profit for dollar. Data decrease illustrations Business graph
Free with trial 3d illustration of down euro diagram with blue bars. Data decrease illustrations Falling euro. 3d illustration of down euro diagram with blue bars
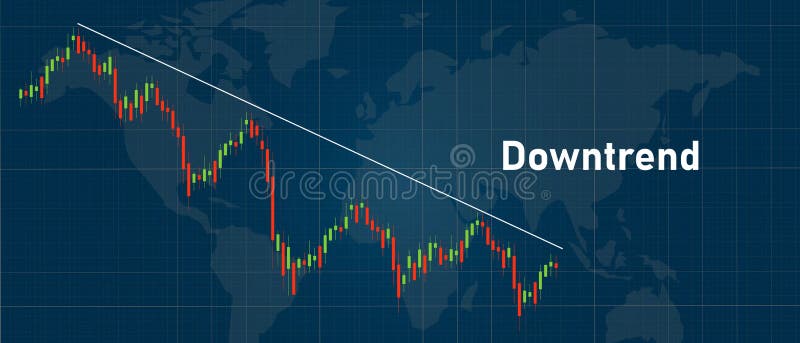
Free with trial Candlestick downtrend stock price graph vector, financial analysing tool dark background. Data decrease vectors Candlestick downtrend stock price graph vector, financial analysing tool
Free with trial A collection of Vector stock diagrams and pie charts on a white background. Data decrease vectors Charts
Free with trial Illustration of people avatar business plan concept. Data decrease illustrations Illustration of people avatar business plan concept
Free with trial Chart of development and decrease of the activity in work of the company or market (red and green schedules). Data decrease illustrations Green schedule of growth and red - falling. Chart of development and decrease of the activity in work of the company or market (red and green schedules)
Free with trial High resolution illustration of colorful business graph. Data decrease illustrations Colorful Business Graph
Free with trial 3D columns and numeric illustration of market value going down. Data decrease illustrations Market value decreasing. 3D columns and numeric illustration of market value going down
Free with trial Business concept of financial blame and panic. Data decrease illustrations Business Concept
Free with trial Dollars failure 3d, problem of currency. Data decrease illustrations Dollars failure 3d
Free with trial Square guyis running away from negative charts. Data decrease vectors Square guy-Chasing negative charts. Square guyis running away from negative charts.
Free with trial Symbol percentage against the background of an array of numbers and arrows. Data decrease vectors Symbol percentage
Free with trial Real estate falling chart with globe, 3d render, white background. Data decrease illustrations Real estate falling chart with globe, 3d render
Free with trial Crisis sign traffic isolated on white. Data decrease illustrations Crisis sign traffic
Free with trial Doodle of business analysis graph. Data decrease vectors Doodle of business analysis graph
Free with trial Digital illustration of graph in colour background. Data decrease illustrations Graph
Free with trial Isometric global finance crisis concept. Global economy crash. Unemployment, jobless and employee job reduction metaphor. Data decrease vectors Isometric global finance crisis concept. Global economy crash. Unemployment, jobless and employee job reduction metaphor
Free with trial Falling graph cost down chart illustration design over a white background. Data decrease illustrations Falling graph cost down chart illustration
Free with trial Vector cartoon stick figure drawing conceptual illustration of man or businessman hanged on the decreasing financial graph or chart arrow. Concept of crisis. Data decrease vectors Vector Cartoon Illustration of Man or Businessman Hanged on the Decreasing Financial Graph Arrow. Vector cartoon stick figure drawing conceptual illustration of man or businessman hanged on the decreasing financial graph or chart arrow. Concept of crisis.
Free with trial Real estate falling chart, 3d render, white background. Data decrease illustrations Real estate falling chart, 3d render
Free with trial Bull and bear market line chart, graphic falling down. Financial and economic crisis. Vector illustration. Data decrease vectors Bull and bear market line chart, graphic falling down. Financial and economic crisis. Vector illustration.
Free with trial Loss money on computer stocks graphs, vector illustration, flat cartoon pc and cash charts down arrow on screen, concept of unsuccessful financial trading, bad revenue or economy budget fail. Data decrease vectors Loss money on computer stocks graphs, vector illustration, flat cartoon pc and cash charts down arrow on screen, concept
Free with trial The hands are holding a tablets with stock quote charts on the screens. The fall and increase in the shares price graphs. The trader`s computers, sell, buy buttons. Business flat concept illustration. Data decrease vectors The tablet computers with stock quote charts on the screens. The hands are holding a tablets with stock quote charts on the screens. The fall and increase in the shares price graphs. The trader`s computers, sell, buy buttons. Business flat concept illustration.
Free with trial An opening in a wall shaped like an arrow graph. Data decrease illustrations Opening in a wall graph. An opening in a wall shaped like an arrow graph
Free with trial Falling shopping sale illustration concept. Data decrease vectors Falling shopping sale illustration
Free with trial Infographic template with 3 arrows pointing down. Can be used for diagram, graph, chart, report, web design. Vector illustration. Data decrease vectors Infographic template with 3 arrows pointing down. Can be used for diagram, graph, chart, report, web design.
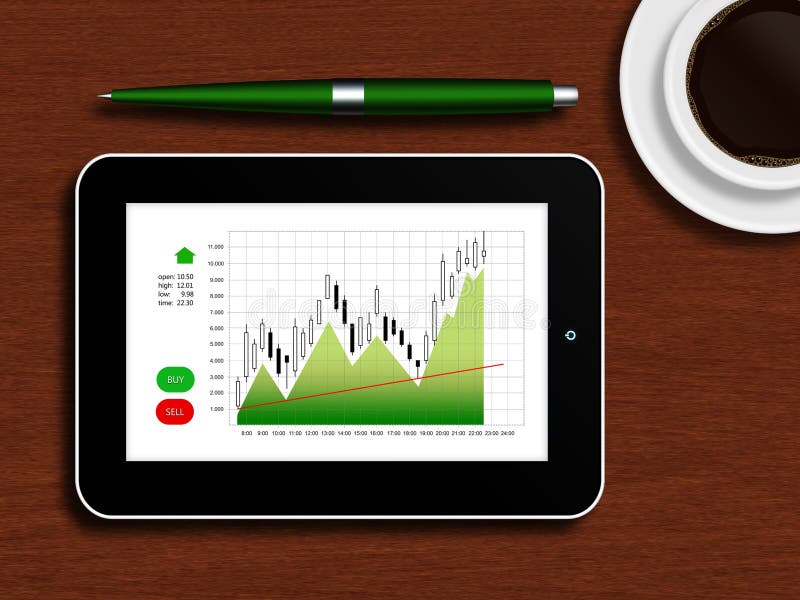
Free with trial Tablet with the stock chart lying on a wooden table with a cup of coffee and pen. Data decrease illustrations Tablet with the stock chart lying on a wooden table
Free with trial Abstract arrows shape design. Data decrease illustrations Vector arrows shape design. Abstract arrows shape design
Free with trial Increase Money Graph Paper Retro Vector Illustration. Data decrease vectors Increase Money Graph Paper
Free with trial Stock market crash illustration - red arrow down, world map. Data decrease vectors Stock market crash illustration - red arrow down
Free with trial Stock market forecast downfall vision to see future economic crisis or market crash concept panic businessman investor look through telescope to see stock market red downward bearish graph. Data decrease vectors Stock market forecast downfall vision to see future economic crisis or market crash concept panic businessman investor look. Stock market forecast downfall vision to see future economic crisis or market crash concept panic businessman investor look through telescope to see stock market red downward bearish graph
Free with trial Business automated analytic system isometric icon, businessman hold a meeting, strategy formulation, chart analysis and trading, virtual graphics vector neon dark. Data decrease vectors Business automated analytic system isometric icon, businessman hold a meeting, strategy formulation, chart analysis and
Free with trial Digital illustration of graph in colour background. Data decrease illustrations Graph
Free with trial Coronavirus covid19 virus impact global business, attack economy vector illustration. Cartoon businessman in panic running away, economical crisis collapse, bankruptcy huge downfall finance background. Data decrease vectors Coronavirus covid19 virus impacts global business crisis. Coronavirus covid19 virus impact global business, attack economy vector illustration. Cartoon businessman in panic running away, economical crisis collapse, bankruptcy huge downfall finance background
Free with trial Stock market quotes graph chart. Data decrease illustrations Finance stock exchange background. Stock market quotes graph chart.
Free with trial Stock market quotes graph chart loss crisis. Data decrease illustrations Stock market quotes graph loss crisis.
Free with trial Digital illustration of business arrow in colour background. Data decrease illustrations Business arrow
Free with trial Business or market crash vector concept. Symbol of financial crisis, economy recession. Minimal design eps10 illustration. Data decrease vectors Business or market crash vector concept. Symbol of financial crisis, economy recession. Minimal illustration
Free with trial Set infographic. Icons. Miniatures. Vector for various design. Data decrease vectors Set infographic. Icons.
Free with trial Forex market research conceptual icon. Forex chart vector design. Forex candlestick and magnifier illustration. Data decrease vectors Forex market research conceptual icon. Forex chart vector design
Free with trial 3d rendering of falling chart with mobile phone isolated over white. Data decrease illustrations 3d rendering of falling chart with mobile phone
Free with trial Housing market crash with price drop and decline in home sales tiny person concept. Real estate property purchase recession and value collapse vector illustration. Economy recession and drop forecast. Data decrease vectors Housing market crash with price drop and decline in sales tiny person concept. Housing market crash with price drop and decline in home sales tiny person concept. Real estate property purchase recession and value collapse vector illustration. Economy recession and drop forecast.
Free with trial Economic bubble crisis and money loss icon, downturn and bankruptcy symbol. Isolated vector linear sign of dollars and percent balloons, symbolizing unsustainable growth leading to eventual burst. Data decrease vectors Economic bubble crisis and money loss line icon. Economic bubble crisis and money loss icon, downturn and bankruptcy symbol. Isolated vector linear sign of dollars and percent balloons, symbolizing unsustainable growth leading to eventual burst
Free with trial Up and down arrow icon. 3D Web Vector Illustrations. Data decrease vectors Up and down arrow icon. 3D Web Vector Illustrations
Free with trial Coronavirus infographics vector diagrams, statistics and info charts. Covid-19 virus infection quarantine by years, disease recovery and death percent share charts, viral epidemic infographics. Data decrease vectors Coronavirus infection infographic charts and info. Coronavirus infographics vector diagrams, statistics and info charts. Covid-19 virus infection quarantine by years, disease recovery and death percent share charts, viral epidemic infographics
Free with trial Downtrend bearish stock market candle stick chart going down loss vector. Data decrease vectors Downtrend bearish stock market candle stick chart going down loss
Free with trial USE FOR LAYOUT, DESIGN, & BACKGROUND. Data decrease illustrations Businessman looking for decreasing graph. USE FOR LAYOUT, DESIGN, & BACKGROUND
Free with trial Digital illustration of graph in colour background. Data decrease illustrations Graph
Free with trial Digital illustration of graph in colour background. Data decrease illustrations Graph
Free with trial Graph going down and up sign with green and red arrows vector. Bar chart symbol icon with arrow moving down and sales bar chart with arrow moving up. Data decrease vectors Graph going down and up sign with green and red arrows vector. Bar chart symbol icon with arrow moving down and sales bar chart. With arrow moving up
Free with trial Testosterone level by age as hormone production reduction outline diagram. Labeled educational measurement scheme with age and amount axis vector illustration. Libido and sexual health stages by aging. Data decrease vectors Testosterone level by age and hormone production reduction outline diagram. Testosterone level by age as hormone production reduction outline diagram. Labeled educational measurement scheme with age and amount axis vector illustration. Libido and sexual health stages by aging
Free with trial Vector decreasing red pencils on the chart. Data decrease vectors Vector decreasing chart. Vector decreasing red pencils on the chart