Free with trial A pair of gleaming gold bars placed on digital financial graphs, symbolizing wealth and investment strategy. The background features abstract data points and fluctuating lines. Data decrease illustrations Shiny Gold Bars Resting on Financial Charts Representing Wealth and Investment Opportunities. A pair of gleaming gold bars placed on digital financial graphs, symbolizing wealth and investment strategy. The background features abstract data points and fluctuating lines
Free with trial This vector illustration depicts a descending bar graph, representing decline and negative trends. It is suitable for financial reports, business analysis, and presentations. Data decrease vectors Illustration of a descending bar graph, , representing decline, decrease, and negative trends in business or finance. This vector illustration depicts a descending bar graph, representing decline and negative trends. It is suitable for financial reports, business analysis, and presentations
Free with trial Illustration shows optimal path among many. Orange path lights on blue tech background. Relates to strategic planning, risk management, exploring new market opportunities data transfer. Data decrease illustrations Illustration shows optimal path among many. Orange path lights on blue tech background. Relates to strategic planning, risk
Free with trial 3D Colorful Charts Magnifier Analysis, Data Visualization, Market Research ,chart,magnifying glass , This photo was created using generative AI. Data decrease illustrations 3D Colorful Charts Magnifier Analysis, Data Visualization, Market Research ,chart,magnifying glass
Free with trial Illuminated red financial chart depicting vibrant stock market trends, showcasing upward and downward movements. ideal for financial reports, analysis, and investment presentations in the stock market domain. Generative AI. Data decrease illustrations Dynamic Red Financial Data Chart with Glowing Lights for Stock Market Analysis Generative AI. Illuminated red financial chart depicting vibrant stock market trends, showcasing upward and downward movements. ideal for financial reports, analysis, and investment presentations in the stock market domain. Generative AI
Free with trial Business chart icon set with graph, statistic, line and bar diagram for finance or analysis. Pie graphics with horizontal and donut layout for data growth. Vector report for trend or economy by pictogram scheme. Data decrease vectors Business chart icon set with graph, statistic, line and bar diagram for finance or analysis. Pie graphics with
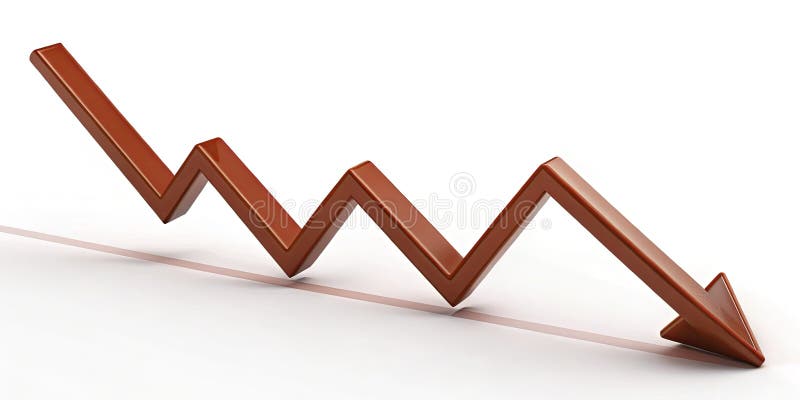
Free with trial A vibrant red arrow zigzags downward against a stark white background The arrow's sharp angles create a dynamic visual representation of a negative trend. The image is clean and simple. Data decrease illustrations Red Zigzag Arrow Downward Trending Graphic White Background Sharp Angles Decline Decrease Fall. A vibrant red arrow zigzags downward against a stark white background The arrow's sharp angles create a dynamic visual representation of a negative trend. The image is clean and simple
Free with trial A single, glossy green arrow points directly downwards. The arrow has a smooth, rounded appearance and a reflective surface, suggesting a 3D rendered object. It is presented in isolation on a clean white background, making it a clear and prominent visual element. This icon commonly represents a decrease, download, or negative direction. Data decrease illustrations Glossy Green Downward Arrow Icon on a White Background image photo. A single, glossy green arrow points directly downwards. The arrow has a smooth, rounded appearance and a reflective surface, suggesting a 3D rendered object. It is presented in isolation on a clean white background, making it a clear and prominent visual element. This icon commonly represents a decrease, download, or negative direction
Free with trial Economy, balloons or man on graph for crisis, stock market investment or inflation on white background. Financial decrease, crash or trader on charts for price drop or crypto profit risk in studio. Data decrease illustrations Economy, balloons or man on graph for crisis, stock market investment or inflation on white background. Financial
Free with trial Three stacks of gold coins decrease in height from left to right, overlaid by a red arrow pointing downwards. Isolated on a transparent background. Data decrease vectors Stacks of gold coins with red downward trending arrow isolated on a transparent background money. Three stacks of gold coins decrease in height from left to right, overlaid by a red arrow pointing downwards. Isolated on a transparent background
Free with trial This compelling red zigzag line graph vividly illustrates a downward market trend, offering a concise yet insightful representation of declining stock prices. The dynamic zigzag pattern clearly highlights fluctuations and sharp drops in the data, making it an ideal tool for visualizing market analysis and economic indicators. The falling red line graph effectively communicates the negative. Data decrease illustrations Analyzing a Declining Market Trend Visualizing Falling Stock Prices with a Red Zigzag Line Graph. This compelling red zigzag line graph vividly illustrates a downward market trend, offering a concise yet insightful representation of declining stock prices. The dynamic zigzag pattern clearly highlights fluctuations and sharp drops in the data, making it an ideal tool for visualizing market analysis and economic indicators. The falling red line graph effectively communicates the negative
Free with trial A graph visually depicts two distinct lines, one showing a pronounced increase while the other reflects a steady decline, all presented in striking orange tones. Data decrease illustrations Trends in Data Representation Illustrating Contrasting Growth and Decline Patterns in Vibrant Hues. A graph visually depicts two distinct lines, one showing a pronounced increase while the other reflects a steady decline, all presented in striking orange tones
Free with trial Vertical bar graph, bars decrease left to right, red arrow points down Vertical Mobile Wallpaper. Data decrease illustrations Vertical bar graph, bars decrease left to right, red arrow points down
Free with trial Vertical bar graph, bars decrease left to right, red arrow points down For Social Media Post Size. Data decrease illustrations Vertical bar graph, bars decrease left to right, red arrow points down
Free with trial Vertical bar graph, bars decrease left to right, red arrow points down Generative AI. Data decrease illustrations Vertical bar graph, bars decrease left to right, red arrow points down
Free with trial A character stands alone, holding a large red arrow pointing downward, symbolizing a decline or decrease, set against a plain white backdrop. Data decrease illustrations Character Holding a Large Red Downward Arrow Indicating Decline on a White Background. A character stands alone, holding a large red arrow pointing downward, symbolizing a decline or decrease, set against a plain white backdrop
Free with trial A 3D illustration depicts a large white dollar sign centered on a vibrant purple circle. Two smaller white circles are positioned on either side of the purple circle. A green upward-pointing arrow is in the top right circle, signifying growth or increase, while a red downward-pointing arrow is in the bottom left circle, indicating decline or decrease. The composition is set against a clean white. Data decrease illustrations 3D Dollar Sign with Up and Down Arrows Indicating Financial Growth and Decline on White Background. A 3D illustration depicts a large white dollar sign centered on a vibrant purple circle. Two smaller white circles are positioned on either side of the purple circle. A green upward-pointing arrow is in the top right circle, signifying growth or increase, while a red downward-pointing arrow is in the bottom left circle, indicating decline or decrease. The composition is set against a clean white
Free with trial This image shows a vibrant 3D bar chart and pie chart, ideal for business presentations and reports to visualize data effectively. The colorful design is visually appealing and easy to understand. Data decrease illustrations Colorful 3D Bar and Pie Charts for Business Presentation. This image shows a vibrant 3D bar chart and pie chart, ideal for business presentations and reports to visualize data effectively. The colorful design is visually appealing and easy to understand.
Free with trial A character stands isolated and holds a large red downward arrow, representing a decrease in values or metrics. Data decrease illustrations Character Holding a Large Red Downward Arrow Symbolizing Decline on a White Background. A character stands isolated and holds a large red downward arrow, representing a decrease in values or metrics
Free with trial Two prominent blue three-dimensional arrows are positioned vertically against a stark white background. One arrow points directly upwards, and the other points directly downwards, symbolizing opposing directions or concepts such as increase and decrease. Data decrease illustrations Two Blue 3D Arrows Pointing Up and Down on a White Background Keywords: arrow, arrows, up arrow, down arrow, direction, movement. Two prominent blue three-dimensional arrows are positioned vertically against a stark white background. One arrow points directly upwards, and the other points directly downwards, symbolizing opposing directions or concepts such as increase and decrease
Free with trial This vibrant 3D bar chart illustrates upward trending data, perfect for presentations or reports on financial growth, market analysis, or business success. The colorful blocks represent different data points. Data decrease illustrations Colorful 3D Bar Chart Showing Business Growth and Success. This vibrant 3D bar chart illustrates upward trending data, perfect for presentations or reports on financial growth, market analysis, or business success. The colorful blocks represent different data points.
Free with trial Three-dimensional rectangular bars stand side-by-side on a white background. The bars are of different heights, with the shortest on the left, a medium-height bar in the middle, and the tallest bar on the right. The bars are colored blue, pink, and orange, respectively. This arrangement visually represents a bar chart or graph, suggesting concepts of growth, data comparison, or progress. Data decrease illustrations Three 3D Rendered Rectangular Bars of Varying Heights and Colors on a White Background bar chart. Three-dimensional rectangular bars stand side-by-side on a white background. The bars are of different heights, with the shortest on the left, a medium-height bar in the middle, and the tallest bar on the right. The bars are colored blue, pink, and orange, respectively. This arrangement visually represents a bar chart or graph, suggesting concepts of growth, data comparison, or progress
Free with trial Three black, rounded, vertical bars of progressively increasing height are displayed against a clean white background. The bars are smooth and have a matte finish. This visual representation suggests concepts of growth, progress, data analysis, or a simple bar graph. Data decrease illustrations Three black rounded bars of increasing height on a white background bar chart graph. Three black, rounded, vertical bars of progressively increasing height are displayed against a clean white background. The bars are smooth and have a matte finish. This visual representation suggests concepts of growth, progress, data analysis, or a simple bar graph
Free with trial Stacks of gold coins decrease in size from left to right, overlaid by a red downward arrow and a financial graph in the background. Data decrease illustrations Stacks Of Gold Coins Decreasing In Size With Red Downward Arrow And Financial Graph finance money. Stacks of gold coins decrease in size from left to right, overlaid by a red downward arrow and a financial graph in the background
Free with trial Concrete blocks form a downward arrow graph. Business concept of decline, crisis, or falling market trend. Financial data visualization. Data decrease illustrations Concrete blocks form a downward arrow graph. Business concept of decline, crisis, or falling market trend
Free with trial Hand interacting with blue chart, analyzing growth, trends, and financial performance data ,Generative ai. Data decrease illustrations Hand analyzing blue chart, deciphering growth trends and financial performance for business success. Hand interacting with blue chart, analyzing growth, trends, and financial performance data ,Generative ai
Free with trial A glossy green arrow pointing downwards, emblazoned with a white percentage symbol, symbolizing decreasing prices, financial decline, sales reduction, and negative economic trends. Data decrease illustrations Green downward arrow with percentage symbol indicating sales decrease and financial growth decline. A glossy green arrow pointing downwards, emblazoned with a white percentage symbol, symbolizing decreasing prices, financial decline, sales reduction, and negative economic trends
Free with trial Magnifying glass over bar graph, symbolizes research, analysis, insights, growth, and strategy. Can be used for display or montage your products. Empty Space for display your products, copy space ,banner, advertising. Generative AI. Data decrease illustrations Data Analysis and Market Research Magnifying glass over bar graph symbolizes research analysis insights growth and strategy. Magnifying glass over bar graph, symbolizes research, analysis, insights, growth, and strategy. Can be used for display or montage your products. Empty Space for display your products, copy space ,banner, advertising. Generative AI
Free with trial Person holds smartphone displaying stock market charts. Person reviews financial data. Stock market trading in progress, on computer monitor. Person analyses market trends. Person. Data decrease illustrations Person holds smartphone displaying stock market charts. Person reviews financial data. Stock market trading in progress on. Person holds smartphone displaying stock market charts. Person reviews financial data. Stock market trading in progress, on computer monitor. Person analyses market trends. Person.
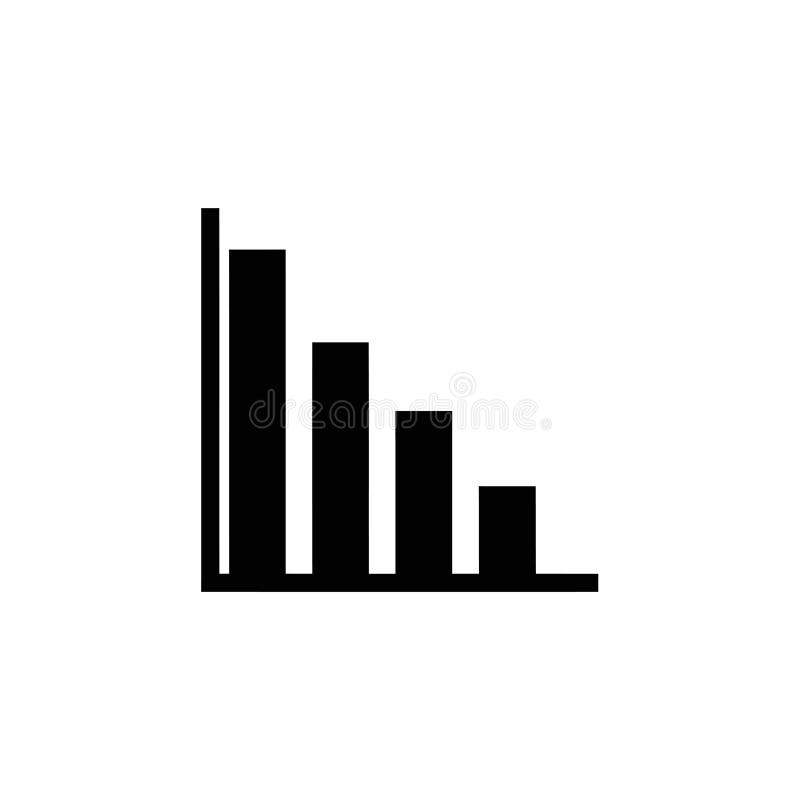
Free with trial Reduction chart icon Black line art vector in black and white outline set collection sign. Data decrease vectors Decline Chart Icon Illustrating Decrease in Performance, Economic Downturn, and Analytical Data. Reduction chart icon Black line art vector in black and white outline set collection sign
Free with trial Financial chart illustration. Declining graphic concept. Red arrow decrease Vector. Business diagram symbol. EPS 10. Data decrease vectors Financial chart illustration. Declining graphic concept. Red arrow decrease Vector. Business diagram symbol.
Free with trial This sales graph clearly illustrates a concerning downward trend. The visualization displays a significant decline in sales figures over a specified period, potentially indicating a market downturn or other factors impacting business performance. Careful analysis of this data is crucial for understanding the underlying causes. Are sales decreasing across all product lines or specific segments. Data decrease illustrations Analyzing Declining Sales Trends A Deep Dive into Market Performance and Potential Recovery Strategies. This sales graph clearly illustrates a concerning downward trend. The visualization displays a significant decline in sales figures over a specified period, potentially indicating a market downturn or other factors impacting business performance. Careful analysis of this data is crucial for understanding the underlying causes. Are sales decreasing across all product lines or specific segments
Free with trial A single, shiny red arrow curves downwards, signifying a decrease or negative direction, presented on a clean white background. Data decrease illustrations A glossy red downward curving arrow indicating a decline or negative trend isolated on white background. A single, shiny red arrow curves downwards, signifying a decrease or negative direction, presented on a clean white background
Free with trial Two sets of three dimensional bar charts. One set shows ascending bars in light colors, shows bars in yellow, beige with decreasing trend. Visual representation aids in data analysis. Data decrease illustrations Two sets of three dimensional bar charts. One set shows ascending bars in light colors, shows bars in yellow, beige with
Free with trial Global inflation trends displayed on multiple digital screens. Macroeconomic research paper on screens shows worldwide inflation data. Charts graphs illustrate global economic. Data decrease illustrations Global inflation trends displayed on multiple digital screens. Macroeconomic research paper on screens shows worldwide inflation
Free with trial The financial data graph is rendered using a 3D rendering of the world map as a background for the declining indexes. Data decrease illustrations The financial data graph is rendered using a 3D rendering of the world map as a background for the declining indexes.
Free with trial Bar Chart Growth And Decline Line And Solid Icon Set. Financial Performance, Economic Trends, Business Analysis Symbol Collection. Data Visualization And Market Trends. Isolated Vector Illustration. Data decrease vectors Bar Chart Growth And Decline Line And Solid Icon Set. Financial Performance, Economic Trends, Business Analysis Symbol
Free with trial This image showcases vibrant 3D bar and pie charts, illustrating growth and statistical data. Perfect for presentations or reports on financial success. Data decrease illustrations Colorful 3D Bar and Pie Charts Showing Business Growth and Statistics. This image showcases vibrant 3D bar and pie charts, illustrating growth and statistical data. Perfect for presentations or reports on financial success.
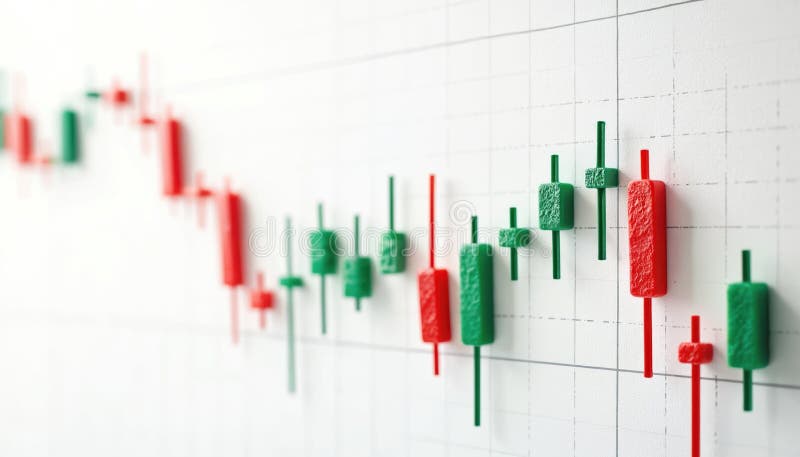
Free with trial Candlestick chart shows stock market fluctuations. Green candles show price increase, red candles pointing price decrease. Financial diagram of investment chart shows up down trends. Data decrease illustrations Candlestick chart shows stock market fluctuations. Green candles show price increase, red candles pointing price decrease.
Free with trial Abstract bar graph chart background representing stock market trade growth and financial investment success ideal for business analysis economic data visualization and corporate finance concept designs. Data decrease illustrations Abstract bar graph chart stock market trade background showing upward growth financial investment concept. Abstract bar graph chart background representing stock market trade growth and financial investment success ideal for business analysis economic data visualization and corporate finance concept designs
Free with trial A grid of 28 simple black line art icons on a white background depicting various financial charts graphs and business related symbols including bar charts pie charts computers and money. Data decrease vectors Collection of 28 minimalist line art icons representing financial data charts and business concepts graph. A grid of 28 simple black line art icons on a white background depicting various financial charts graphs and business related symbols including bar charts pie charts computers and money
Free with trial The graphic illustrates stable bank withdrawals alongside a growing financial trend with upward movement, Bank withdrawals are currently stable and not showing any significant increase or decrease. Data decrease vectors The graphic illustrates stable bank withdrawals alongside a growing financial trend with upward movement, Bank withdrawals are
Free with trial Global economic instability, market volatility, and the growing demand for energy security are represented by the combination of an oil pump jack, oil barrels, and the national flag of Sri Lanka. Data decrease illustrations The backdrop of geopolitical challenges and economic volatility is driving the increase or decrease in Sri Lankan oil prices. Global economic instability, market. Global economic instability, market volatility, and the growing demand for energy security are represented by the combination of an oil pump jack, oil barrels, and the national flag of Sri Lanka.
Free with trial A stylized blue cloud graphic features a yellow percentage symbol and a blue downward-pointing arrow, suggesting a decrease in price or a sale. Data decrease vectors Cloud icon with a percentage symbol and a downward arrow, isolated on transparent background cyber monday element. A stylized blue cloud graphic features a yellow percentage symbol and a blue downward-pointing arrow, suggesting a decrease in price or a sale
Free with trial Four stacks of Canadian coins, varying in height, are shown with red downward-pointing arrows on their sides. The isolated object on a white background symbolizes a decrease in currency value or economic downturn. created Ai. Data decrease illustrations Canadian currency stacks with downward red arrows indicating financial decline isolated on white background. Four stacks of Canadian coins, varying in height, are shown with red downward-pointing arrows on their sides. The isolated object on a white background symbolizes a decrease in currency value or economic downturn. created Ai
Free with trial A hand with a pen analyzes financial charts on a digital screen, highlighting investment trends, market analysis, and economic growth using visual representation of performance. Data decrease illustrations Analyzing financial data with pen on digital screen, showing investment trends and growth. Chart displays performance. A hand with a pen analyzes financial charts on a digital screen, highlighting investment trends, market analysis, and economic growth using visual representation of performance
Free with trial A futuristic robotic hand reaches towards interactive financial charts, showcasing cutting-edge technology in data analysis and stock market trends with vivid color accents. Scalp. Data decrease illustrations Advanced robotic hand interacting with dynamic financial charts and graphs, artificial intelligence analysis, stock. A futuristic robotic hand reaches towards interactive financial charts, showcasing cutting-edge technology in data analysis and stock market trends with vivid color accents. Scalp
Free with trial A 3D render of a business chart illustrating a financial decline with a visual representation of falling data, presented on an artist's easel. Concept for economic downturn. Data decrease vectors 3d business graph showing a downward trend with bar chart and line on an easel stand transparent background. A 3D render of a business chart illustrating a financial decline with a visual representation of falling data, presented on an artist's easel. Concept for economic downturn
Free with trial Red arrow pointing downward on colorful vertical bars. Business financial crisis chart with decreasing trend line. Economic data visualization. Data decrease illustrations Red arrow pointing downward on colorful vertical bars. Business financial crisis chart with decreasing trend line
Free with trial A bold red arrow curves and points downwards, symbolizing a decrease or negative trajectory, isolated on a plain white background. Data decrease illustrations A vibrant red arrow curves downwards indicating a sharp decline or negative trend isolated on white background. A bold red arrow curves and points downwards, symbolizing a decrease or negative trajectory, isolated on a plain white background
Free with trial Eight circular icons with black backgrounds each feature a different chart or graph symbol. The frames are bordered by a sequence of colorful lines: red, green, blue, and yellow. The icons include bar graphs, line graphs, a pie chart, and scatter plots, all depicted in white. Each symbol includes axes and grid patterns, indicating statistical or financial data representation. The arrangement is in two rows of four, emphasizing symmetry and variety in chart types. A i Generated. Data decrease vectors Collection of eight different chart and graph icons displayed in circular black frames with colorful borders. Eight circular icons with black backgrounds each feature a different chart or graph symbol. The frames are bordered by a sequence of colorful lines: red, green, blue, and yellow. The icons include bar graphs, line graphs, a pie chart, and scatter plots, all depicted in white. Each symbol includes axes and grid patterns, indicating statistical or financial data representation. The arrangement is in two rows of four, emphasizing symmetry and variety in chart types. A i Generated
Free with trial A bar graph showing a downward trend, with red and blue bars against a dark background. it represents a financial downturn, economic recession, or stock market crash. data analysis is key to understanding the trends. Data decrease illustrations Stock market crash graph downtrend chart financial crisis economic recession business failure investment loss. a bar graph showing a downward trend, with red and blue bars against a dark background. it represents a financial downturn, economic recession, or stock market crash. data analysis is key to understanding the trends
Free with trial This high-quality vector graphic features a simple, hand-drawn red arrow pointing downwards. Perfect for presentations, websites, infographics, and any project requiring a clear and concise directional indicator. The minimalist design ensures versatility across various styles and applications. Download this easily scalable vector and enhance your designs with a clean and professional look. Ideal for illustrating decline, decrease, or a downward trend. This versatile asset is perfect for both digital and print use, offering high-resolution quality for crisp results. Data decrease illustrations Hand-Drawn Red Down Arrow: Simple, Clean, and Versatile Vector Graphic for Presentations, Websites, and More! UI UX sign. This high-quality vector graphic features a simple, hand-drawn red arrow pointing downwards. Perfect for presentations, websites, infographics, and any project requiring a clear and concise directional indicator. The minimalist design ensures versatility across various styles and applications. Download this easily scalable vector and enhance your designs with a clean and professional look. Ideal for illustrating decline, decrease, or a downward trend. This versatile asset is perfect for both digital and print use, offering high-resolution quality for crisp results.
Free with trial A laptop screen shows a graph with orange lines. The graph is showing a downward trend, which could indicate a decrease in stock prices or a decline in a particular market. Data decrease illustrations A laptop screen shows a graph with orange lines. The graph is showing a downward trend, which could indicate a decrease in stock
Free with trial Red arrow pointing down, financial data graph. Business concept of economic decline, market crash, financial crisis, investment loss, budget cut. Statistics chart, stock market fall. Data decrease illustrations Red arrow pointing down, financial data graph. Business concept of economic decline, market crash, financial crisis, investment
Free with trial Set line Cloud download technology data transfer Secure your site with HTTPS SSL Search engine Browser incognito window Server Data New chat messages notification and setting icon. Vector. Data decrease illustrations Set line Cloud download, technology data transfer, Secure your site with HTTPS, SSL, Search engine, Browser incognito. Set line Cloud download technology data transfer Secure your site with HTTPS SSL Search engine Browser incognito window Server Data New chat messages notification and setting icon. Vector.
Free with trial A 3D rendered image featuring two arrows pointing downwards on a white background. A bold red arrow descends sharply, while a thinner blue arrow follows a slightly different path. A small red ring is depicted at the point where the red arrow touches the surface, suggesting a low point or impact. This visual represents a concept of decline or loss. Data decrease illustrations Red and Blue Arrows Pointing Downward on White Background Representing Decline Keywords: arrow, down, decline, decrease, loss, red. A 3D rendered image featuring two arrows pointing downwards on a white background. A bold red arrow descends sharply, while a thinner blue arrow follows a slightly different path. A small red ring is depicted at the point where the red arrow touches the surface, suggesting a low point or impact. This visual represents a concept of decline or loss
Free with trial Real estate market analysis. Graphical representation of property value trends, growth patterns. Small house model with increasing bar chart in front of financial data diagram. Data decrease illustrations Real estate market analysis. Graphical representation of property value trends, growth patterns. Small house model with
Free with trial Red stock market chart decreasing. Financial trading background, investment risk concept. Economic crisis, market crash, index fall. Bear market trend with digital data volatility on. Data decrease illustrations Red stock market chart decreasing. Financial trading background, investment risk concept. Economic crisis, market crash, index
Free with trial Set line Cloud computing lock Pie chart infographic Financial growth Search with folder Document and decrease icon. Vector. Data decrease illustrations Set line Cloud computing lock, Pie chart infographic, Financial growth, Search with folder, Document and decrease icon
Free with trial Thailand flag with a declining bar chart and down arrows, symbolizing decline in data, performance, or various national indicators in the country. Data decrease illustrations Flag with a declining bar chart and down arrows
Free with trial Tunisia flag with a declining bar chart and down arrows, symbolizing decline in data, performance, or various national indicators in the country. Data decrease illustrations Flag with a declining bar chart and down arrows
Free with trial Sudan flag with a declining bar chart and down arrows, symbolizing decline in data, performance, or various national indicators in the country. Data decrease illustrations Flag with a declining bar chart and down arrows
Free with trial Slovenia flag with a declining bar chart and down arrows, symbolizing decline in data, performance, or various national indicators in the country. Data decrease illustrations Flag with a declining bar chart and down arrows
Free with trial Turkmenistan flag with a declining bar chart and down arrows, symbolizing decline in data, performance, or various national indicators in the country. Data decrease illustrations Flag with a declining bar chart and down arrows
Free with trial Sri Lanka flag with a declining bar chart and down arrows, symbolizing decline in data, performance, or various national indicators in the country. Data decrease illustrations Flag with a declining bar chart and down arrows
Free with trial Singapore flag with a declining bar chart and down arrows, symbolizing decline in data, performance, or various national indicators in the country. Data decrease illustrations Flag with a declining bar chart and down arrows
Free with trial Sweden flag with a declining bar chart and down arrows, symbolizing decline in data, performance, or various national indicators in the country. Data decrease illustrations Flag with a declining bar chart and down arrows
Free with trial Tajikistan flag with a declining bar chart and down arrows, symbolizing decline in data, performance, or various national indicators in the country. Data decrease illustrations Flag with a declining bar chart and down arrows
Free with trial Trinidad and Tobago flag with a declining bar chart and down arrows, symbolizing decline in data, performance, or various national indicators in the country. Data decrease illustrations Flag with a declining bar chart and down arrows
Free with trial Slovakia flag with a declining bar chart and down arrows, symbolizing decline in data, performance, or various national indicators in the country. Data decrease illustrations Flag with a declining bar chart and down arrows
Free with trial Suriname flag with a declining bar chart and down arrows, symbolizing decline in data, performance, or various national indicators in the country. Data decrease illustrations Flag with a declining bar chart and down arrows
Free with trial Spain flag with a declining bar chart and down arrows, symbolizing decline in data, performance, or various national indicators in the country. Data decrease illustrations Flag with a declining bar chart and down arrows
Free with trial Somalia flag with a declining bar chart and down arrows, symbolizing decline in data, performance, or various national indicators in the country. Data decrease illustrations Flag with a declining bar chart and down arrows
Free with trial Tanzania flag with a declining bar chart and down arrows, symbolizing decline in data, performance, or various national indicators in the country. Data decrease illustrations Flag with a declining bar chart and down arrows
Free with trial Serbia flag with a declining bar chart and down arrows, symbolizing decline in data, performance, or various national indicators in the country. Data decrease illustrations Flag with a declining bar chart and down arrows
Free with trial South Africa flag with a declining bar chart and down arrows, symbolizing decline in data, performance, or various national indicators in the country. Data decrease illustrations Flag with a declining bar chart and down arrows
Free with trial Rwanda flag with a declining bar chart and down arrows, symbolizing decline in data, performance, or various national indicators in the country. Data decrease illustrations Flag with a declining bar chart and down arrows
Free with trial Republic of the Congo flag with a declining bar chart and down arrows, symbolizing decline in data, performance, or various national indicators in the country. Data decrease illustrations Flag with a declining bar chart and down arrows
Free with trial Senegal flag with a declining bar chart and down arrows, symbolizing decline in data, performance, or various national indicators in the country. Data decrease illustrations Flag with a declining bar chart and down arrows