Free with trial Data analytics icons collection is a vector illustration with editable stroke. Data decrease vectors Data analytics icons collection is a vector illustration with editable stroke.
Free with trial The flag of Uganda with declining stock market graph and financial data overlay, symbolizing economic downturn, recession, or bearish market trends. Data decrease illustrations The flag of Uganda with declining stock market graph and financial data overlay
Free with trial The flag of Zimbabwe with declining stock market graph and financial data overlay, symbolizing economic downturn, recession, or bearish market trends. Data decrease illustrations The flag of Zimbabwe with declining stock market graph and financial data overlay
Free with trial Businessman faces red bar graph wall. Economic challenges, financial crisis, market downturn concept. Man in suit, business, finance, data, investment, business strategy risk. Data decrease illustrations Businessman faces red bar graph wall. Economic challenges, financial crisis, market downturn concept. Man in suit, business
Free with trial Digital tablet displaying real-time gold price chart with line graphs, market indicators. Investment analysis, financial market data, trading concept. Tablet is on gold bars financial. Data decrease illustrations Digital tablet displaying real-time gold price chart with line graphs, market indicators. Investment analysis, financial market
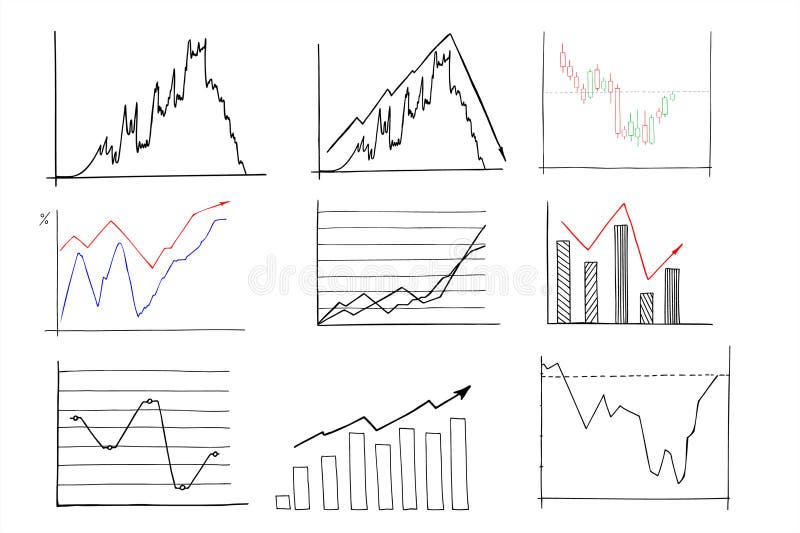
Free with trial Chart line set. Graph, finance report, income growth, economy statistic, diagram, infographic, mind map, data visualization vector illustration. Outline signs of analytic. Editable Stroke. Data decrease vectors Analytical graphic chart with trend lines, columns set hand drawn ink sketch. Change in time of election results or income, plans. Chart line set. Graph, finance report, income growth, economy statistic, diagram, infographic, mind map, data visualization vector illustration. Outline signs of analytic. Editable Stroke
Free with trial Bear represents falling stock market on red chart background. Financial graph shows investment loss, price decrease. Bearish concept symbolizes economic recession, downturn global. Data decrease illustrations Bear represents falling stock market on red chart background. Financial graph shows investment loss, price decrease. Bearish
Free with trial Colorful 3D bar chart illustration on blue background with red, orange, yellow, turquoise bars. Simple, clean geometric shapes represent statistics, business data for reports. Data decrease illustrations Colorful 3D bar chart illustration on blue background with red, orange, yellow, turquoise bars. Simple, clean geometric shapes
Free with trial Businessperson analyzes financial data on digital tablet. Growth chart, cost reduction strategies displayed on screen. Project management business strategy key concepts. Effective. Data decrease illustrations Businessperson analyzes financial data on digital tablet. Growth chart, cost reduction strategies displayed on screen. Project
Free with trial This image shows a bar graph with a downward trending line and a dollar sign. It represents financial loss, economic downturn, or a decrease in market value. Data decrease vectors Vector art of a bar graph with a downward trending line and a dollar sign, representing financial loss or economic downturn. This image shows a bar graph with a downward trending line and a dollar sign. It represents financial loss, economic downturn, or a decrease in market value
Free with trial Red arrow pointing downward on financial spreadsheet. Magnifying glass focuses on economic decline trend. No people. Business recession. Analyzing financial data. Spreadsheet with. Data decrease illustrations Red arrow pointing downward on financial spreadsheet. Magnifying glass focuses on economic decline trend. No people. Business
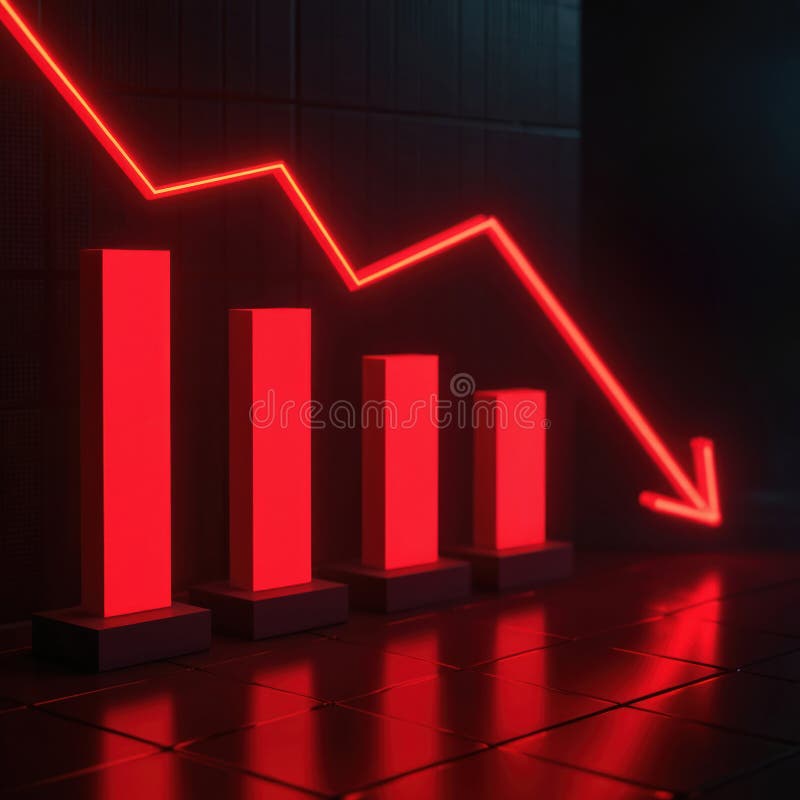
Free with trial Red glowing line graph shows market decline. Bar chart bars decrease, indicating falling sales, revenue loss. Financial report chart displays economic crisis, business downturn tech. Data decrease illustrations Red glowing line graph shows market decline. Bar chart bars decrease, indicating falling sales, revenue loss. Financial report
Free with trial A 3D representation of a document displaying a bar chart and a dotted line graph, indicating data trends and analysis. A small, rounded icon featuring a landscape with mountains and a sun is placed ab. Data decrease illustrations 3d infographic showing a document with a bar chart and line graph, alongside a small image icon, isolated on white background. A 3D representation of a document displaying a bar chart and a dotted line graph, indicating data trends and analysis. A small, rounded icon featuring a landscape with mountains and a sun is placed ab
Free with trial Golden dollar sign with red arrow pointing down. Financial crisis concept, recession chart, stock market crash symbol. Economic downturn, loss, decrease, risk, bad investment money. Data decrease illustrations Golden dollar sign with red arrow pointing down. Financial crisis concept, recession chart, stock market crash symbol. Economic
Free with trial A person in a suit presents a bar chart indicating quality increase and cost decrease, illuminated by golden light. Data decrease illustrations Person in Suit Presenting Bar Chart with Quality Up and Cost Down, Illuminated by Golden Light Modern technology business. A person in a suit presents a bar chart indicating quality increase and cost decrease, illuminated by golden light
Free with trial Graph with arrow down outline icon, symbolizing a downward trend or decrease in data. Perfect for financial reports, stock market analysis, and performance tracking. Data decrease vectors Professional Graph with Downward Arrow Vector Illustration for Business Presentations. Graph with arrow down outline icon, symbolizing a downward trend or decrease in data. Perfect for financial reports, stock market analysis, and performance tracking.
Free with trial Graph with arrow down outline icon, symbolizing a downward trend or decrease in data. Perfect for financial reports, stock market analysis, and performance tracking. Data decrease vectors Professional Graph with Downward Arrow Vector Illustration for Business Presentations. Graph with arrow down outline icon, symbolizing a downward trend or decrease in data. Perfect for financial reports, stock market analysis, and performance tracking.
Free with trial Graph with arrow down outline icon, symbolizing a downward trend or decrease in data. Perfect for financial reports, stock market analysis, and performance tracking. Data decrease vectors Professional Graph with Downward Arrow Vector Illustration for Business Presentations. Graph with arrow down outline icon, symbolizing a downward trend or decrease in data. Perfect for financial reports, stock market analysis, and performance tracking.
Free with trial Graph with arrow down outline icon, symbolizing a downward trend or decrease in data. Perfect for financial reports, stock market analysis, and performance tracking. Data decrease vectors Professional Graph with Downward Arrow Vector Illustration for Business Presentations. Graph with arrow down outline icon, symbolizing a downward trend or decrease in data. Perfect for financial reports, stock market analysis, and performance tracking.
Free with trial Red arrow graph indicates stock market decline, real estate downturn, financial loss. 3d illustration visualizes business concept of negative progress, sale reduction, profit decrease. Data decrease illustrations Red arrow graph indicates stock market decline, real estate downturn, financial loss. 3d illustration visualizes business concept
Free with trial Three red arrows pointing down with white percentage symbols signifying a drop in prices or economic decline isolated on transparent background. Data decrease vectors Three red downward pointing arrows with percentage symbols indicating a decrease in value or sales isolated on transparent. Three red arrows pointing down with white percentage symbols signifying a drop in prices or economic decline isolated on transparent background
Free with trial Shiny metallic percentage sign centered on blue financial graph background. Selective focus highlights symbol over stock market data. Represents finance, business, price, discount sale. Data decrease illustrations Shiny metallic percentage sign centered on blue financial graph background. Selective focus highlights symbol over stock market
Free with trial Abstract digital graph with orange and blue lines. Concept represents finance marketing business chart growth financial trading, data analysis tech currency statistic index trend. Data decrease illustrations Abstract digital graph with orange and blue lines. Concept represents finance marketing business chart growth financial trading
Free with trial Cost reduction chart displayed on a mobile phone held by a person in a suit shows a downward trend representing financial analysis business strategy and investment planning for economic forecasting d. Data decrease illustrations Cost reduction chart financial analysis business strategy investment planning market trend economic forecast data. Cost reduction chart displayed on a mobile phone held by a person in a suit shows a downward trend representing financial analysis business strategy and investment planning for economic forecasting d
Free with trial Cost reduction chart displayed on a mobile device held by a hand shows a declining trend representing financial analysis business strategy and investment planning indicating potential market downturn. Data decrease illustrations Cost reduction chart financial analysis business strategy investment planning market trend economic forecast data. Cost reduction chart displayed on a mobile device held by a hand shows a declining trend representing financial analysis business strategy and investment planning indicating potential market downturn
Free with trial The graph of the growth and fall of valuable assets is black, three-dimensional, in a modern digital style. Exchange, trading, decrease, increase concept. Generative Ai. Data decrease illustrations The graph of the growth and fall of valuable assets is black, three-dimensional, in a modern digital style. Exchange, trading
Free with trial A businessman in a suit holds a bar chart showing quality increasing and cost decreasing, with golden sparkles. Data decrease illustrations Businessman Holding Upward Trending Bar Chart Showing Quality Increase and Cost Decrease with Golden Sparkles Modern technology. A businessman in a suit holds a bar chart showing quality increasing and cost decreasing, with golden sparkles
Free with trial Realistic financial graphs index number analysis business investment market economy and trading concept. Generative AI glowing lines and diagram on digital screen charts crypto data blur light line. Data decrease illustrations Trading market financial graphs and glowing lines diagram on digital neural network AI generated art. Realistic financial graphs index number analysis business investment market economy and trading concept. Generative AI glowing lines and diagram on digital screen charts crypto data blur light line
Free with trial Realistic financial graphs index number analysis business investment market economy and trading concept. Generative AI glowing lines and diagram on digital screen charts crypto data blur light line. Data decrease illustrations Trading market financial graphs and glowing lines diagram on digital neural network AI generated art. Realistic financial graphs index number analysis business investment market economy and trading concept. Generative AI glowing lines and diagram on digital screen charts crypto data blur light line
Free with trial Realistic financial graphs index number analysis business investment market economy and trading concept. Generative AI glowing lines and diagram on digital screen charts crypto data blur light line. Data decrease illustrations Trading market financial graphs and glowing lines diagram on digital neural network AI generated art. Realistic financial graphs index number analysis business investment market economy and trading concept. Generative AI glowing lines and diagram on digital screen charts crypto data blur light line
Free with trial Realistic financial graphs index number analysis business investment market economy and trading concept. Generative AI glowing lines and diagram on digital screen charts crypto data blur light line. Data decrease illustrations Trading market financial graphs and glowing lines diagram on digital neural network AI generated art. Realistic financial graphs index number analysis business investment market economy and trading concept. Generative AI glowing lines and diagram on digital screen charts crypto data blur light line
Free with trial Realistic financial graphs index number analysis business investment market economy and trading concept. Generative AI glowing lines and diagram on digital screen charts crypto data blur light line. Data decrease illustrations Trading market financial graphs and glowing lines diagram on digital neural network AI generated art. Realistic financial graphs index number analysis business investment market economy and trading concept. Generative AI glowing lines and diagram on digital screen charts crypto data blur light line
Free with trial Realistic financial graphs index number analysis business investment market economy and trading concept. Generative AI glowing lines and diagram on digital screen charts crypto data blur light line. Data decrease illustrations Trading market financial graphs and glowing lines diagram on digital neural network AI generated art. Realistic financial graphs index number analysis business investment market economy and trading concept. Generative AI glowing lines and diagram on digital screen charts crypto data blur light line
Free with trial Realistic financial graphs index number analysis business investment market economy and trading concept. Generative AI glowing lines and diagram on digital screen charts crypto data blur light line. Data decrease illustrations Trading market financial graphs and glowing lines diagram on digital neural network AI generated art. Realistic financial graphs index number analysis business investment market economy and trading concept. Generative AI glowing lines and diagram on digital screen charts crypto data blur light line
Free with trial Realistic financial graphs index number analysis business investment market economy and trading concept. Generative AI glowing lines and diagram on digital screen charts crypto data blur light line. Data decrease illustrations Trading market financial graphs and glowing lines diagram on digital neural network AI generated art. Realistic financial graphs index number analysis business investment market economy and trading concept. Generative AI glowing lines and diagram on digital screen charts crypto data blur light line
Free with trial A hand interacts with a digital screen displaying financial growth trends and data visualizations for the year 2025. Data decrease illustrations Analyzing financial growth trends on a digital interface. A hand interacts with a digital screen displaying financial growth trends and data visualizations for the year 2025
Free with trial Stock market or forex trading candlestick graph in graphic design for financial investment concept. Motion. Financial data and diagrams showing increase and decrease in profits. Data decrease illustrations Stock market or forex trading candlestick graph in graphic design for financial investment concept. Motion. Financial
Free with trial Stock market or forex trading candlestick graph in graphic design for financial investment concept. Motion. Financial data and diagrams showing increase and decrease in profits. Data decrease illustrations Stock market or forex trading candlestick graph in graphic design for financial investment concept. Motion. Financial
Free with trial Stock market or forex trading candlestick graph in graphic design for financial investment concept. Motion. Financial data and diagrams showing increase and decrease in profits. Data decrease illustrations Stock market or forex trading candlestick graph in graphic design for financial investment concept. Motion. Financial
Free with trial This AI-generated image depicts a calculator displaying "TAX-2025" alongside a bar graph, illustrating potential tax revenue projections for the year. The graph, generated by AI, shows a projected decrease in tax revenue over time. This visualization is helpful for financial planning and forecastin. Data decrease illustrations Tax Projections 2025. This AI-generated image depicts a calculator displaying "TAX-2025" alongside a bar graph, illustrating potential tax revenue projections for the year. The graph, generated by AI, shows a projected decrease in tax revenue over time. This visualization is helpful for financial planning and forecastin
Free with trial A businessman in a suit presents a graph showing a declining trend from 2023 to 2026. The image depicts a negative financial forecast, ideal for illustrating economic downturn, market analysis, or investment strategy presentations. The visualization uses clear data representation for impactful communication. Data decrease illustrations Businessman presenting declining 2023-2026 graph. A businessman in a suit presents a graph showing a declining trend from 2023 to 2026. The image depicts a negative financial forecast, ideal for illustrating economic downturn, market analysis, or investment strategy presentations. The visualization uses clear data representation for impactful communication
Free with trial This image presents a detailed timeline infographic illustrating the archaeological dig restoration process spanning from 2004 to 2005, divided into six distinct color-coded sections that visually represent different procedural steps using blue, green, yellow, and orange hues to track the steady increase and subsequent decrease in dig records over time, featuring a bold white title reading. Data decrease illustrations Archaeological dig restoration process timeline infographic showing progress from 2004 to 2005 with color-coded sections and. This image presents a detailed timeline infographic illustrating the archaeological dig restoration process spanning from 2004 to 2005, divided into six distinct color-coded sections that visually represent different procedural steps using blue, green, yellow, and orange hues to track the steady increase and subsequent decrease in dig records over time, featuring a bold white title reading
Free with trial The image displays a bar chart representing yearly data spanning from 2011 to 2021. The bars are colored in blue, with a notable decrease in bar height in 2020, followed by a large increase in 2021. The chart includes a Y-axis with numerical values, though specific labels are not clearly visible. The bars on the right side of the chart have color-coded sections in green, orange, and yellow,. Data decrease illustrations Bar chart showing yearly data from 2011 to 2021 with a significant drop in 2020. The image displays a bar chart representing yearly data spanning from 2011 to. The image displays a bar chart representing yearly data spanning from 2011 to 2021. The bars are colored in blue, with a notable decrease in bar height in 2020, followed by a large increase in 2021. The chart includes a Y-axis with numerical values, though specific labels are not clearly visible. The bars on the right side of the chart have color-coded sections in green, orange, and yellow,
Free with trial A businessperson meticulously analyzes a futuristic graph displayed on a digital tablet, visualizing carbon reduction strategies and ambitious sustainability goals. This compelling digital art piece represents the urgent need for environmental action and a greener future, focusing on climate change solutions. The graph showcases data analysis related to environmental efforts, highlighting the. Data decrease illustrations Businessperson analyzing a futuristic graph representing carbon reduction strategies and sustainable goals for a greener future. A businessperson meticulously analyzes a futuristic graph displayed on a digital tablet, visualizing carbon reduction strategies and ambitious sustainability goals. This compelling digital art piece represents the urgent need for environmental action and a greener future, focusing on climate change solutions. The graph showcases data analysis related to environmental efforts, highlighting the
Free with trial Visualizing stock market decline and economic recession with a red chart and downward arrows, showing financial loss and investment risk in a dark background. A sign of economic downturn. Data decrease illustrations Stock market crash recession financial crisis investment loss economic downturn chart analysis data fall 2024. visualizing stock market decline and economic recession with a red chart and downward arrows, showing financial loss and investment risk in a dark background. A sign of economic downturn.
Free with trial A business professional presents carbon emission reduction targets on a tablet screen, emphasizing environmental sustainability initiatives. The image showcases a detailed presentation with clear data visualizations, including graphs and charts, illustrating key strategies for achieving net-zero emissions. This modern illustration highlights the importance of corporate responsibility in combating. Data decrease illustrations A businessperson presenting carbon emission reduction targets on a tablet screen with environmental sustainability icons. A business professional presents carbon emission reduction targets on a tablet screen, emphasizing environmental sustainability initiatives. The image showcases a detailed presentation with clear data visualizations, including graphs and charts, illustrating key strategies for achieving net-zero emissions. This modern illustration highlights the importance of corporate responsibility in combating
Free with trial Big data icons High-Quality Vector Icons Collection with Editable Stroke. Ideal for Professional and Creative Projects. Data decrease vectors Big data icons High-Quality Vector Icons Collection with Editable Stroke. Ideal for Professional and Creative Projects
Free with trial The flag of UK with declining stock market graph and financial data overlay, symbolizing economic downturn, recession, or bearish market trends. Data decrease illustrations The flag of UK with declining stock market graph and financial data overlay
Free with trial Job ID: fba8760d-e973-412d-9011-a0e8d72a93ed. Data decrease illustrations Colorful Bar Graph with Flags: Abstract Representation of Data and Trends. Job ID: fba8760d-e973-412d-9011-a0e8d72a93ed
Free with trial The flag of UAE with declining stock market graph and financial data overlay, symbolizing economic downturn, recession, or bearish market trends. Data decrease illustrations The flag of UAE with declining stock market graph and financial data overlay
Free with trial The flag of Yemen with declining stock market graph and financial data overlay, symbolizing economic downturn, recession, or bearish market trends. Data decrease illustrations The flag of Yemen with declining stock market graph and financial data overlay
Free with trial The flag of Zambia with declining stock market graph and financial data overlay, symbolizing economic downturn, recession, or bearish market trends. Data decrease illustrations The flag of Zambia with declining stock market graph and financial data overlay
Free with trial The flag of Turkey with declining stock market graph and financial data overlay, symbolizing economic downturn, recession, or bearish market trends. Data decrease illustrations The flag of Turkey with declining stock market graph and financial data overlay
Free with trial The flag of Uruguay with declining stock market graph and financial data overlay, symbolizing economic downturn, recession, or bearish market trends. Data decrease illustrations The flag of Uruguay with declining stock market graph and financial data overlay
Free with trial The flag of Vietnam with declining stock market graph and financial data overlay, symbolizing economic downturn, recession, or bearish market trends. Data decrease illustrations The flag of Vietnam with declining stock market graph and financial data overlay
Free with trial The flag of Ukraine with declining stock market graph and financial data overlay, symbolizing economic downturn, recession, or bearish market trends. Data decrease illustrations The flag of Ukraine with declining stock market graph and financial data overlay
Free with trial The flag of Tunisia with declining stock market graph and financial data overlay, symbolizing economic downturn, recession, or bearish market trends. Data decrease illustrations The flag of Tunisia with declining stock market graph and financial data overlay
Free with trial The flag of Thailand with declining stock market graph and financial data overlay, symbolizing economic downturn, recession, or bearish market trends. Data decrease illustrations The flag of Thailand with declining stock market graph and financial data overlay
Free with trial The flag of Tanzania with declining stock market graph and financial data overlay, symbolizing economic downturn, recession, or bearish market trends. Data decrease illustrations The flag of Tanzania with declining stock market graph and financial data overlay
Free with trial The flag of Venezuela with declining stock market graph and financial data overlay, symbolizing economic downturn, recession, or bearish market trends. Data decrease illustrations The flag of Venezuela with declining stock market graph and financial data overlay
Free with trial The flag of Tajikistan with declining stock market graph and financial data overlay, symbolizing economic downturn, recession, or bearish market trends. Data decrease illustrations The flag of Tajikistan with declining stock market graph and financial data overlay
Free with trial The flag of Uzbekistan with declining stock market graph and financial data overlay, symbolizing economic downturn, recession, or bearish market trends. Data decrease illustrations The flag of Uzbekistan with declining stock market graph and financial data overlay
Free with trial The flag of Turkmenistan with declining stock market graph and financial data overlay, symbolizing economic downturn, recession, or bearish market trends. Data decrease illustrations The flag of Turkmenistan with declining stock market graph and financial data overlay
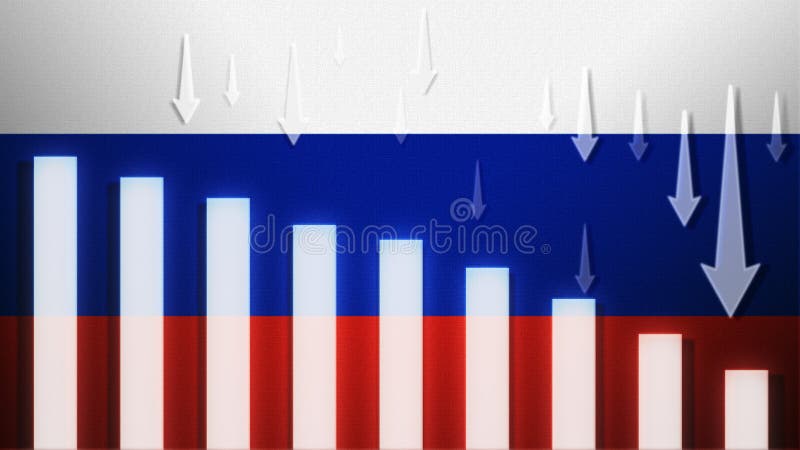
Free with trial Russia flag with a declining bar chart and down arrows, symbolizing decline in data, performance, or various national indicators in the country. Data decrease illustrations Flag with a declining bar chart and down arrows
Free with trial Madagascar flag with a declining bar chart and down arrows, symbolizing decline in data, performance, or various national indicators in the country. Data decrease illustrations Flag with a declining bar chart and down arrows
Free with trial Greece flag with a declining bar chart and down arrows, symbolizing decline in data, performance, or various national indicators in the country. Data decrease illustrations Flag with a declining bar chart and down arrows
Free with trial Guyana flag with a declining bar chart and down arrows, symbolizing decline in data, performance, or various national indicators in the country. Data decrease illustrations Flag with a declining bar chart and down arrows
Free with trial Kazakhstan flag with a declining bar chart and down arrows, symbolizing decline in data, performance, or various national indicators in the country. Data decrease illustrations Flag with a declining bar chart and down arrows
Free with trial Nigeria flag with a declining bar chart and down arrows, symbolizing decline in data, performance, or various national indicators in the country. Data decrease illustrations Flag with a declining bar chart and down arrows
Free with trial New Caledonia flag with a declining bar chart and down arrows, symbolizing decline in data, performance, or various national indicators in the country. Data decrease illustrations Flag with a declining bar chart and down arrows
Free with trial Norway flag with a declining bar chart and down arrows, symbolizing decline in data, performance, or various national indicators in the country. Data decrease illustrations Flag with a declining bar chart and down arrows
Free with trial Iraq flag with a declining bar chart and down arrows, symbolizing decline in data, performance, or various national indicators in the country. Data decrease illustrations Flag with a declining bar chart and down arrows
Free with trial Jamaica flag with a declining bar chart and down arrows, symbolizing decline in data, performance, or various national indicators in the country. Data decrease illustrations Flag with a declining bar chart and down arrows
Free with trial Puerto Rico flag with a declining bar chart and down arrows, symbolizing decline in data, performance, or various national indicators in the country. Data decrease illustrations Flag with a declining bar chart and down arrows
Free with trial Liberia flag with a declining bar chart and down arrows, symbolizing decline in data, performance, or various national indicators in the country. Data decrease illustrations Flag with a declining bar chart and down arrows
Free with trial Malaysia flag with a declining bar chart and down arrows, symbolizing decline in data, performance, or various national indicators in the country. Data decrease illustrations Flag with a declining bar chart and down arrows
Free with trial Oman flag with a declining bar chart and down arrows, symbolizing decline in data, performance, or various national indicators in the country. Data decrease illustrations Flag with a declining bar chart and down arrows
Free with trial Kyrgyzstan flag with a declining bar chart and down arrows, symbolizing decline in data, performance, or various national indicators in the country. Data decrease illustrations Flag with a declining bar chart and down arrows
Free with trial Panama flag with a declining bar chart and down arrows, symbolizing decline in data, performance, or various national indicators in the country. Data decrease illustrations Flag with a declining bar chart and down arrows
Free with trial Iran flag with a declining bar chart and down arrows, symbolizing decline in data, performance, or various national indicators in the country. Data decrease illustrations Flag with a declining bar chart and down arrows