Free with trial 3d blue magnifying glass with downward-trending chart inside Financial analysis, economic decline, risk assessment, market monitoring, investment evaluation concept Low poly digital futuristic Vector. Decrease arrow chart vectors 3d blue magnifying glass with downward-trending chart inside Financial analysis, economic decline, risk assessment
Free with trial Line Financial growth decrease icon isolated on black background. Increasing revenue. Colorful outline concept. Vector. Decrease arrow chart illustrations Line Financial growth decrease icon isolated on black background. Increasing revenue. Colorful outline concept. Vector
Free with trial Set Isometric Financial growth increase Football betting money decrease and Casino dealer icon. Purple hexagon button. Vector. Decrease arrow chart vectors Set Isometric Financial growth increase, Football betting money, decrease and Casino dealer icon. Purple hexagon button
Free with trial Two distinct bar charts are depicted against a white background. The left chart a downward trend with bars in blue, yellow, and purple, accompanied by a yellow coin with a dollar sign and an arrow pointing down towards it from a small graph indicating a rising trend. The right chart an upward trend with bars in red, green, and blue, and a green coin with a dollar sign connected to a circle with a. Decrease arrow chart illustrations Bar charts showing financial growth and decline with dollar symbols. Two distinct bar charts are depicted against a white background. The left chart a downward trend with bars in blue, yellow, and purple, accompanied by a yellow coin with a dollar sign and an arrow pointing down towards it from a small graph indicating a rising trend. The right chart an upward trend with bars in red, green, and blue, and a green coin with a dollar sign connected to a circle with a
Free with trial Pink Financial growth decrease icon isolated on pink background. Increasing revenue. Minimalism concept. 3D render illustration. Decrease arrow chart illustrations Pink Financial growth decrease icon isolated on pink background. Increasing revenue. Minimalism concept. 3D render
Free with trial This graphic illustration depicts a stark representation of declining business performance. It features a bar chart with three colorful bars (yellow, orange, green) suggesting varying data points, overlaid with three distinct lines in yellow, blue, and orange, all sharply descending downwards. A prominent red arrow points downwards, emphasizing the negative trend. A small yellow plus sign is also visible, potentially signifying a point of reference or a contrasting element. The clean white background isolates the graphical elements, making them ideal for conveying concepts of loss, recession, or negative growth. Decrease arrow chart illustrations Declining Business Graph with Downward Arrows. This graphic illustration depicts a stark representation of declining business performance. It features a bar chart with three colorful bars (yellow, orange, green) suggesting varying data points, overlaid with three distinct lines in yellow, blue, and orange, all sharply descending downwards. A prominent red arrow points downwards, emphasizing the negative trend. A small yellow plus sign is also visible, potentially signifying a point of reference or a contrasting element. The clean white background isolates the graphical elements, making them ideal for conveying concepts of loss, recession, or negative growth.
Free with trial A thick, bright red arrow with a white outline, angled downwards and to the right, indicating direction or decline. Decrease arrow chart vectors Bold red arrow pointing down and to the right. A thick, bright red arrow with a white outline, angled downwards and to the right, indicating direction or decline
Free with trial A vibrant red arrow graph sharply declining against a dark, textured background, symbolizing a significant financial downturn or economic crisis. Decrease arrow chart illustrations Red downward arrow graph on dark background showing financial crisis. A vibrant red arrow graph sharply declining against a dark, textured background, symbolizing a significant financial downturn or economic crisis
Free with trial Set Browser window Graph chart infographic Cloud technology data transfer upload Mobile phone incognito and Financial growth decrease icon. Vector. Decrease arrow chart illustrations Set Browser window, Graph chart infographic, Cloud technology data transfer, upload, Mobile phone, incognito and. Set Browser window Graph chart infographic Cloud technology data transfer upload Mobile phone incognito and Financial growth decrease icon. Vector.
Free with trial A minimalist black and white line icon showing a stylized woman next to a descending arrow. This symbol represents concepts like failure, demotion, loss, or a downward trend. Decrease arrow chart vectors Female figure with downward arrow icon symbolizing demotion or decline. A minimalist black and white line icon showing a stylized woman next to a descending arrow. This symbol represents concepts like failure, demotion, loss, or a downward trend
Free with trial A bar graph showing a downward trend with a red arrow indicating a decline. Decrease arrow chart illustrations Decreasing bar graph with downward arrow isolated on white background. A bar graph showing a downward trend with a red arrow indicating a decline
Free with trial A striking 3D red arrow, constructed from individual rectangular blocks, curves and points downwards against a stark white background. The segmented design of the arrow suggests a process of decline or a downward trend, making it a powerful visual metaphor for concepts like economic downturn, loss, or negative progress. Decrease arrow chart illustrations 3D Red Arrow Composed of Blocks Pointing Downwards on White descending. A striking 3D red arrow, constructed from individual rectangular blocks, curves and points downwards against a stark white background. The segmented design of the arrow suggests a process of decline or a downward trend, making it a powerful visual metaphor for concepts like economic downturn, loss, or negative progress
Free with trial A stark red arrow dramatically descends across a series of blue bars, illustrating a significant downward trend. Decrease arrow chart illustrations Red arrow shows sharp decline on blue bar graph. A stark red arrow dramatically descends across a series of blue bars, illustrating a significant downward trend
Free with trial Several dark, pointed arrow shapes are patterned diagonally across a light background. The arrows point downwards, suggesting a trend or direction. Decrease arrow chart illustrations Downward Trend Shown With Repeating Arrow Shapes on a Plain Background. Several dark, pointed arrow shapes are patterned diagonally across a light background. The arrows point downwards, suggesting a trend or direction.
Free with trial A 3d rendering of stack of gold bars with a red arrow pointing downwards, suggesting a decrease in the price or value of gold. Decrease arrow chart illustrations Stack of gold bars with a red arrow pointing downwards
Free with trial Inflation sign. Sack pictogram with dollar sign and arrow down. Symbol of money depreciation vector linear illustration. Decrease arrow chart vectors Inflation sign. Sack pictogram with dollar sign and arrow down. Symbol of money depreciation vector linear illustration.
Free with trial Economic critical crisis concept. The bar garph with red drop down arrow on red background. Recession financial, cryptocurrency, gold, and the stock market. Losing money and cash. Bearish. Decrease arrow chart vectors Economic critical crisis concept. The bar garph with red drop down arrow on red background. Recession financial, cryptocurrency
Free with trial A stack of US dollar bills and scattered coins are arranged on a wooden surface next to a bright red graph arrow pointing downwards. Image. Decrease arrow chart illustrations US Dollar Bills and Coins with Downward Red Arrow. A stack of US dollar bills and scattered coins are arranged on a wooden surface next to a bright red graph arrow pointing downwards. Image
Free with trial Yellow light bulb and red downward arrow. 3D rendering isolated on white background. Decrease arrow chart illustrations Yellow light bulb and red downward arrow. 3D rendering
Free with trial A hand uses chalk to draw a large downward-pointing arrow on a dark chalkboard, symbolizing financial decline, market crash, economic recession, or business loss. The stark contrast highlights the concept of falling values and negative trends. Decrease arrow chart illustrations Hand Drawing Downward Arrow on Chalkboard Representing Decline and Loss. A hand uses chalk to draw a large downward-pointing arrow on a dark chalkboard, symbolizing financial decline, market crash, economic recession, or business loss. The stark contrast highlights the concept of falling values and negative trends
Free with trial Graph with decrease report. Business and finance vector illustration. Diagram with recession and bankruptcy progress. Decrease arrow chart vectors Graph with decrease report. Business and finance vector illustration. Diagram with recession and bankruptcy
Free with trial A close-up view of black financial and business chart icons arranged in a grid on a light background. Decrease arrow chart illustrations Close-up of financial and business chart icons on a grid finance charts. A close-up view of black financial and business chart icons arranged in a grid on a light background
Free with trial A minimalist graphic featuring a green footprint icon next to a downward-pointing arrow. The image is clean and simple, set against a white background. This design can represent various concepts such as progress, direction, or a decline. Suitable for use in educational materials, infographics, websites, or presentations related to movement, steps, or downward trends. Decrease arrow chart illustrations Footprint and Down Arrow Icon. A minimalist graphic featuring a green footprint icon next to a downward-pointing arrow. The image is clean and simple, set against a white background. This design can represent various concepts such as progress, direction, or a decline. Suitable for use in educational materials, infographics, websites, or presentations related to movement, steps, or downward trends.
Free with trial Business graph with up arrow down arrow logo template. Decrease arrow chart vectors Business graph with up arrow down arrow logo template
Free with trial Black icon of a falling graph with a downward arrow on a white background. Clear details and vibrant colors en. Decrease arrow chart illustrations Falling Graph with Downward Arrow Icon on White Background downward trend decline. Black icon of a falling graph with a downward arrow on a white background. Clear details and vibrant colors en
Free with trial Green up and red down 3d arrow graph showing rising, descending trend, business result, profit or loss symbol symbol. Business arrow, goals concept. 3d world money symbols. Financial growth vector isolated. Decrease arrow chart vectors Green up and red down 3d arrow graph showing rising, descending trend, business result, profit. world money symbols. Green up and red down 3d arrow graph showing rising, descending trend, business result, profit or loss symbol symbol. Business arrow, goals concept. 3d world money symbols. Financial growth vector isolated
Free with trial Green up and red down 3d arrow graph showing rising, descending trend, business result, profit or loss symbol symbol. Business arrow, goals concept. 3d world money symbols. Financial growth vector isolated. Decrease arrow chart vectors Green up and red down 3d arrow graph showing rising, descending trend, business result, profit. world money symbols. Green up and red down 3d arrow graph showing rising, descending trend, business result, profit or loss symbol symbol. Business arrow, goals concept. 3d world money symbols. Financial growth vector isolated
Free with trial Green up and red down 3d arrow graph showing rising, descending trend, business result, profit or loss symbol symbol. Business arrow, goals concept. 3d world money symbols. Financial growth vector isolated. Decrease arrow chart vectors Green up and red down 3d arrow graph showing rising, descending trend, business result, profit. world money symbols. Green up and red down 3d arrow graph showing rising, descending trend, business result, profit or loss symbol symbol. Business arrow, goals concept. 3d world money symbols. Financial growth vector isolated
Free with trial Green up and red down 3d arrow graph showing rising, descending trend, business result, profit or loss symbol symbol. Business arrow, goals concept. 3d world money symbols. Financial growth vector isolated. Decrease arrow chart vectors Green up and red down 3d arrow graph showing rising, descending trend, business result, profit. world money symbols. Green up and red down 3d arrow graph showing rising, descending trend, business result, profit or loss symbol symbol. Business arrow, goals concept. 3d world money symbols. Financial growth vector isolated
Free with trial Green up and red down 3d arrow graph showing rising, descending trend, business result, profit or loss symbol symbol. Business arrow, goals concept. 3d world money symbols. Financial growth vector isolated. Decrease arrow chart vectors Green up and red down 3d arrow graph showing rising, descending trend, business result, profit. world money symbols. Green up and red down 3d arrow graph showing rising, descending trend, business result, profit or loss symbol symbol. Business arrow, goals concept. 3d world money symbols. Financial growth vector isolated
Free with trial Render showing glossy green downward arrow isolated on white background with shadow. Decrease arrow chart illustrations Glossy Green Downward Arrow Isolated on White Background With Shadow Keywords: arrow, down, direction, green, symbol, isolated. Render showing glossy green downward arrow isolated on white background with shadow
Free with trial Set Money plant in the pot, Financial growth decrease, Bank building and bag. Business infographic template. Vector. Decrease arrow chart vectors Set Money plant in the pot, Financial growth decrease, Bank building and bag. Business infographic template. Vector
Free with trial Grey Financial growth decrease icon isolated on purple-blue background. Increasing revenue. Minimalism concept. 3D render illustration. Decrease arrow chart illustrations Grey Financial growth decrease icon isolated on purple-blue background. Increasing revenue. Minimalism concept. 3D
Free with trial Arrow Up Down Icon North South Upward Downward Pointer Scale Rise Fall Elevator Sign Symbol Growth Scroll Gesture Position Navigation Location Sign. Decrease arrow chart vectors Arrow Up Down Icon North South Upward Downward Pointer Scale Rise Fall Elevator Sign Symbol Growth Scroll Gesture
Free with trial Downward arrow, swirling line with blue concentric circles, and percentage symbol suggest falling rates. Ideal for finance, economy, interest, discount, marketing statistics cost management. Flat. Decrease arrow chart vectors Declining Percentage Rate Represented by Downward Arrow and Percentage Symbol. Downward arrow, swirling line with blue concentric circles, and percentage symbol suggest falling rates. Ideal for finance, economy, interest, discount, marketing statistics cost management. Flat
Free with trial Smartphone screen with password protection icon, downward sale arrow, and a chart depicting analytics. Ideal for cybersecurity, digital sales, ecommerce metrics, data protection, online safety. Decrease arrow chart vectors Mobile Security Features and Analytics Highlighting Sales Performance with Trend Insights. Smartphone screen with password protection icon, downward sale arrow, and a chart depicting analytics. Ideal for cybersecurity, digital sales, ecommerce metrics, data protection, online safety
Free with trial Purple-blue Financial growth decrease icon isolated on grey background. Increasing revenue. Minimalism concept. 3D render illustration. Decrease arrow chart illustrations Purple-blue Financial growth decrease icon isolated on grey background. Increasing revenue. Minimalism concept. 3D
Free with trial Dollar symbols set. Market trend Vector. Dollars rate variation. Currency arrow movement. Manual vector only. No autotrace used. EPS 10. Decrease arrow chart vectors Dollar symbols set. Market trend Vector. Dollars rate variation. Currency arrow movement. Manual vector only. No autotrace used.
Free with trial Growth chart line icon. Neumorphic, Flat shadow, 3d buttons. Column graph sign. Market analytics symbol. Line growth chart icon. Social media icons. Vector. Decrease arrow chart vectors Growth chart line icon. Column graph sign. Neumorphic buttons. Vector. Growth chart line icon. Neumorphic, Flat shadow, 3d buttons. Column graph sign. Market analytics symbol. Line growth chart icon. Social media icons. Vector
Free with trial Logotype line Financial growth decrease icon isolated on grey background. Increasing revenue. Logo design template element. Vector. Decrease arrow chart illustrations Logotype line Financial growth decrease icon isolated on grey background. Increasing revenue. Logo design template
Free with trial A red downward-trending arrow overlays a background of financial documents featuring colorful charts and graphs. A person in a suit is writing on one of the pages, indicating analysis or note-taking. The setting suggests a focus on market trends, possibly within a corporate or financial context. The grid pattern across the image adds a conceptual element of data analysis. a i generated. Decrease arrow chart illustrations Declining market trends analysis with a downward trending red arrow overlay. A red downward-trending arrow overlays a background of financial documents featuring colorful charts and graphs. A person in a suit is writing on one of the pages, indicating analysis or note-taking. The setting suggests a focus on market trends, possibly within a corporate or financial context. The grid pattern across the image adds a conceptual element of data analysis. a i generated
Free with trial A striking visual of a vibrant green arrow pointing upwards and a bold red arrow pointing downwards, symbolizing progress, finance, and directional changes. Perfect for presentations. Decrease arrow chart illustrations Green up arrow and red down arrow icons representing growth and decline white background. A striking visual of a vibrant green arrow pointing upwards and a bold red arrow pointing downwards, symbolizing progress, finance, and directional changes. Perfect for presentations
Free with trial White Financial growth decrease icon isolated with long shadow background. Increasing revenue. Circle button. Vector. Decrease arrow chart vectors White Financial growth decrease icon isolated with long shadow background. Increasing revenue. Circle button. Vector
Free with trial A simple line graph showing a downward trend with an arrow pointing down on a white background. Decrease arrow chart illustrations Downward trending line graph with arrow indicating decline business finance. A simple line graph showing a downward trend with an arrow pointing down on a white background
Free with trial A stark red jagged arrow points downwards diagonally against a solid black background, symbolizing a significant decline or loss. Decrease arrow chart illustrations Red jagged downward trend arrow on black background. A stark red jagged arrow points downwards diagonally against a solid black background, symbolizing a significant decline or loss
Free with trial Financial crisis concept. Broken piggy bank and declining chart, loss of money vector concept, bankruptcy, onset of poverty, budget recession, market fall. Bad economy and lower investment costs. Decrease arrow chart vectors Financial crisis concept. Broken piggy bank and declining chart, loss of money vector concept, bankruptcy, onset of
Free with trial Economic critical crisis concept. The bar garph with drop down arrow on red background. Recession financial, cryptocurrency, gold, and the stock market. Losing money and cash. Bearish. Decrease arrow chart vectors Economic critical crisis concept. The bar garph with drop down arrow on red background. Recession financial, cryptocurrency, gold
Free with trial A stark black jagged arrow descends diagonally, indicating a sharp decline or negative trend. Its sharp angles suggest volatility. Decrease arrow chart illustrations Black jagged arrow pointing downward and to the right. A stark black jagged arrow descends diagonally, indicating a sharp decline or negative trend. Its sharp angles suggest volatility
Free with trial Orange arrow pointing downward indicating a financial decline in a factory setting. Concept of economic downturn or falling production in industry. Decrease arrow chart illustrations Orange arrow pointing downward indicating a financial decline in a factory setting
Free with trial Line Financial growth decrease icon isolated on white background. Increasing revenue. Colorful outline concept. Vector. Decrease arrow chart illustrations Line Financial growth decrease icon isolated on white background. Increasing revenue. Colorful outline concept. Vector
Free with trial Isometric line Financial growth decrease icon isolated on pink and blue background. Increasing revenue. Square button. Vector. Decrease arrow chart vectors Isometric line Financial growth decrease icon isolated on pink and blue background. Increasing revenue. Square button
Free with trial Hand Drawn Downward Trend Arrow On white Background. Decrease arrow chart illustrations Hand-drawn black zigzag line ending with a downward arrow On white Background, symbolizing decline or negative trend. Hand Drawn Downward Trend Arrow On white. Hand Drawn Downward Trend Arrow On white Background
Free with trial A vibrant red arrow curves downwards, pointing to the right, isolated on a clean white background. Decrease arrow chart illustrations Red downward curved arrow isolated on white background. A vibrant red arrow curves downwards, pointing to the right, isolated on a clean white background
Free with trial Financial stock market chart with falling red arrow and rising green arrow. Business growth and decline concept for economic analysis success failure and investment. Decrease arrow chart vectors Red decreasing and green increasing arrows representing market trend analytics. Financial stock market chart with falling red arrow and rising green arrow. Business growth and decline concept for economic analysis success failure and investment
Free with trial Economy downturn concept showing declining bar graph with red arrow, background,. Decrease arrow chart illustrations Economy downturn concept showing declining bar graph with red arrow, background
Free with trial Abstract blue up and down arrow icons illustration set minimalist molecular grid design isolated on white background for technology business growth data analysis and finance ui ux. Decrease arrow chart vectors Abstract blue up and down arrow icons illustration set minimalist molecular grid design isolated on white background for
Free with trial A dynamic red jagged arrow plunges downward, visually representing a sharp decline, economic downturn, or negative trend in business and finance. Ideal for charting losses or market drops. Decrease arrow chart illustrations Red jagged arrow pointing down symbolizing financial decline or negative trend. A dynamic red jagged arrow plunges downward, visually representing a sharp decline, economic downturn, or negative trend in business and finance. Ideal for charting losses or market drops
Free with trial A stark red arrow zigzags downwards, powerfully representing economic downturns, market crashes, and negative financial trends. This visual signifies a crisis or significant drop. Decrease arrow chart illustrations Red downward arrow symbolizing financial decline and economic recession trends. A stark red arrow zigzags downwards, powerfully representing economic downturns, market crashes, and negative financial trends. This visual signifies a crisis or significant drop
Free with trial Stacked black oil barrels on a circular platform with a prominent red downward-pointing arrow. Isolated on a transparent background. Decrease arrow chart vectors Oil barrels with red downward arrow isolated on a transparent background black. Stacked black oil barrels on a circular platform with a prominent red downward-pointing arrow. Isolated on a transparent background
Free with trial A black downward arrow with a percentage symbol and a jagged line inside it on a white background. Decrease arrow chart illustrations Black downward arrow with percentage sign and jagged line on white image photo. A black downward arrow with a percentage symbol and a jagged line inside it on a white background
Free with trial Black and white graph showing a fluctuating trend line with an upward and a downward arrow. Decrease arrow chart illustrations Black and white graph showing fluctuating trend with up and down arrows chart data. Black and white graph showing a fluctuating trend line with an upward and a downward arrow
Free with trial Worried man holding a red downward pointing arrow represents financial decline or business failure. Flat vector illustration isolated on white background. Decrease arrow chart illustrations Worried man holding a red downward pointing arrow represents financial decline or business failure
Free with trial Graph of oscillating line with horizontal line and arrow isolated on white background. Decrease arrow chart vectors Graph of oscillating line with horizontal line and arrow isolated on white background
Free with trial A curved orange arrow with a lighter orange segment pointing downwards, isolated on a clean white background. Decrease arrow chart illustrations Orange arrow pointing down isolated on white background. A curved orange arrow with a lighter orange segment pointing downwards, isolated on a clean white background
Free with trial A black and white illustration features a thermometer, a warning triangle with an exclamation mark, a percentage symbol, and a downward trending arrow. Decrease arrow chart vectors Warning Sign with Thermometer, Percentage Symbol, and Downward Arrow danger alert. A black and white illustration features a thermometer, a warning triangle with an exclamation mark, a percentage symbol, and a downward trending arrow
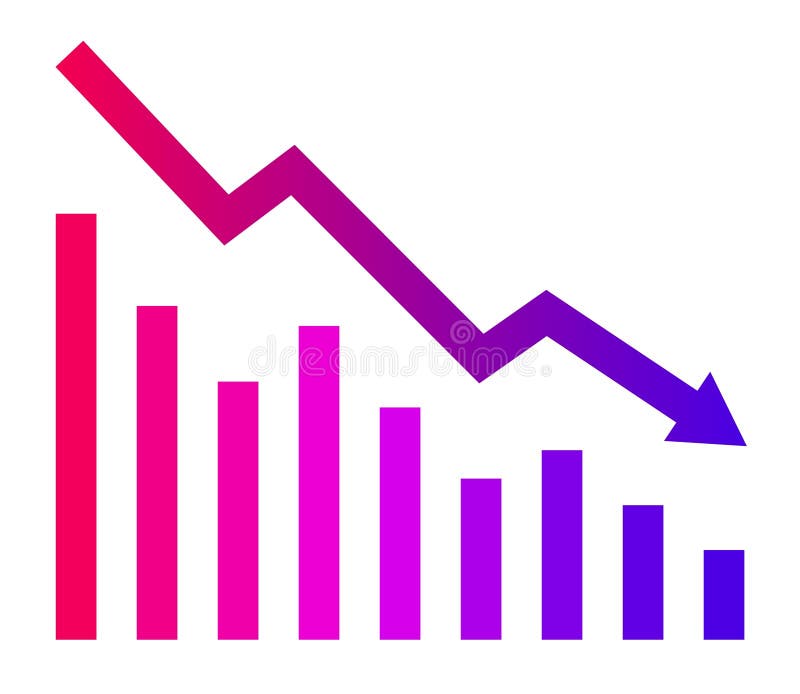
Free with trial The image depicts a bar graph with a downward trend. The bars start high on the left and progressively decrease in height towards the right. A large red downward arrow further emphasizes the declining trend. Decrease arrow chart vectors Decreasing trend in bar graph. The image depicts a bar graph with a downward trend. The bars start high on the left and progressively decrease in height towards the right. A large red downward arrow further emphasizes the declining trend
Free with trial A downward pointing arrow graphic with connecting lines indicates a market dip or negative trend and can be used for financial analysis, presentations and website illustrations. Decrease arrow chart illustrations Downward Arrow Concept Illustration. A downward pointing arrow graphic with connecting lines indicates a market dip or negative trend and can be used for financial analysis, presentations and website illustrations
Free with trial A black arrow points downwards towards two horizontal steps on a white background. Decrease arrow chart illustrations Black Arrow Pointing Down Towards Steps Icon on White Background stairs decline. A black arrow points downwards towards two horizontal steps on a white background
Free with trial A close-up of paper cutouts, showing a red background and a declining green arrow. Decrease arrow chart illustrations Red paper with green arrow up. A close-up of paper cutouts, showing a red background and a declining green arrow
Free with trial A stark visual representation of financial decline. A stack of gleaming gold coins is depicted, with a prominent red arrow pointing downwards, symbolizing a significant drop in value or economic downturn. The clean, white background emphasizes the core elements, making it ideal for conveying concepts of recession, loss, market crash, or financial instability. Decrease arrow chart illustrations Financial Crisis: Falling Gold Coins and Red Downward Arrow. A stark visual representation of financial decline. A stack of gleaming gold coins is depicted, with a prominent red arrow pointing downwards, symbolizing a significant drop in value or economic downturn. The clean, white background emphasizes the core elements, making it ideal for conveying concepts of recession, loss, market crash, or financial instability.
Free with trial A professional 3D conceptual visualization of a financial market crash or economic recession, featuring a stack of solid gold bullion bars contrasted by a sharp, descending golden arrow pointing downwards on a clean neutral background. Decrease arrow chart illustrations Financial Market Downturn Concept with Stacked Gold Bullion and Descending Arrow. A professional 3D conceptual visualization of a financial market crash or economic recession, featuring a stack of solid gold bullion bars contrasted by a sharp, descending golden arrow pointing downwards on a clean neutral background
Free with trial A black bar graph icon with a downward arrow and trend line indicates a decline. Clear details and vibrant col. Decrease arrow chart illustrations Black Bar Graph Icon with Downward Arrow and Trend Line on White Background data. A black bar graph icon with a downward arrow and trend line indicates a decline. Clear details and vibrant col
Free with trial Red 3D zigzag arrow is trending downward on plain white background, casting faint shadow. Business decline, financial analysis, data visualization, modern design, digital marketing, growth reduction, minimalistic style. Decrease arrow chart illustrations Red 3D zigzag arrow is trending downward on plain white background, casting faint shadow
Free with trial A minimalist set of hand-drawn icons featuring a dynamic arrow indicating movement or progress and a line graph displaying data trends, perfect for illustrating concepts of growth, analysis, and chang. Decrease arrow chart vectors Arrow and graph icons set isolated on transparent background. A minimalist set of hand-drawn icons featuring a dynamic arrow indicating movement or progress and a line graph displaying data trends, perfect for illustrating concepts of growth, analysis, and chang
Free with trial A vibrant red arrow graph dramatically depicts a downward trend, ideal for illustrating concepts of decline, loss, recession, or negative growth. The transparent background allows for seamless integration into various designs, presentations, and reports. This vector graphic is perfect for financial reports, presentations, websites, and social media posts. Decrease arrow chart illustrations Red Downward Trending Arrow Graph on Transparent Background. A vibrant red arrow graph dramatically depicts a downward trend, ideal for illustrating concepts of decline, loss, recession, or negative growth. The transparent background allows for seamless integration into various designs, presentations, and reports. This vector graphic is perfect for financial reports, presentations, websites, and social media posts.
Free with trial This set contains business chart, magnifying glass. Good for market research and investment data collection concept design. Decrease arrow chart vectors Set of business chart statistic icon vector illustration on transparent background. This set contains business chart, magnifying glass. Good for market research and investment data collection concept design
Free with trial A black downward trending arrow composed of segmented pieces points diagonally down on a white background. Decrease arrow chart illustrations Black downward trending arrow with segmented segments on white background decline. A black downward trending arrow composed of segmented pieces points diagonally down on a white background
Free with trial A black line graph with a zigzagging downward trend and an arrow pointing down. Clear details and vibrant colo. Decrease arrow chart illustrations Black line graph showing a sharp downward trend on white background chart decline. A black line graph with a zigzagging downward trend and an arrow pointing down. Clear details and vibrant colo
Free with trial A black graph showing an upward trend with a curved arrow indicating a reversal on a white background. Decrease arrow chart illustrations Upward trending graph with a curved arrow indicating a reversal on white background. A black graph showing an upward trend with a curved arrow indicating a reversal on a white background
Free with trial Black silhouette of a descending graph with arrow for business decline concepts. Decrease arrow chart vectors Black silhouette of a descending graph with arrow for business decline concepts.