Free with trial Green up and red down 3d arrow graph showing rising, descending trend, business result, profit or loss symbol symbol. Business arrow, goals concept. 3d world money symbols. Financial growth. Decrease arrow chart illustrations Green up and red down 3d arrow graph showing rising, descending trend, business result, 3d world money symbols. Financial growth. Green up and red down 3d arrow graph showing rising, descending trend, business result, profit or loss symbol symbol. Business arrow, goals concept. 3d world money symbols. Financial growth
Free with trial This vibrant illustration showcases a bold red arched arrow descending sharply against a clean white textured background. The drawing style mimics a crayon or colored pencil sketch giving it a playful and attention-grabbing aesthetic. Rendered by Ai, this graphic element is perfect for indicating trends direction or highlighting specific information on marketing materials or websites. It. Decrease arrow chart illustrations Vibrant red crayon arrow showing downward motion. This vibrant illustration showcases a bold red arched arrow descending sharply against a clean white textured background. The drawing style mimics a crayon or colored pencil sketch giving it a playful and attention-grabbing aesthetic. Rendered by Ai, this graphic element is perfect for indicating trends direction or highlighting specific information on marketing materials or websites. It
Free with trial Report line icon. Continuous line with share plane. Column graph, pie chart sign. Market analytics symbol. 3d heart in speech bubble. Report single line ribbon. Loop curve pattern. Vector. Decrease arrow chart vectors Report line icon. Column graph, pie chart sign. Continuous line with plane. Vector. Report line icon. Continuous line with share plane. Column graph, pie chart sign. Market analytics symbol. 3d heart in speech bubble. Report single line ribbon. Loop curve pattern. Vector
Free with trial Green up and red down 3d arrow graph showing rising, descending trend, business result, profit or loss symbol symbol. Business arrow, goals concept. 3d world money symbols. Financial growth. Decrease arrow chart illustrations Green up and red down 3d arrow graph showing rising, descending trend, business result, 3d world money symbols. Financial growth. Green up and red down 3d arrow graph showing rising, descending trend, business result, profit or loss symbol symbol. Business arrow, goals concept. 3d world money symbols. Financial growth
Free with trial Green up and red down 3d arrow graph showing rising, descending trend, business result, profit or loss symbol symbol. Business arrow, goals concept. 3d world money symbols. Financial growth. Decrease arrow chart illustrations Green up and red down 3d arrow graph showing rising, descending trend, business result, 3d world money symbols. Financial growth. Green up and red down 3d arrow graph showing rising, descending trend, business result, profit or loss symbol symbol. Business arrow, goals concept. 3d world money symbols. Financial growth
Free with trial Green up and red down 3d arrow graph showing rising, descending trend, business result, profit or loss symbol symbol. Business arrow, goals concept. 3d world money symbols. Financial growth. Decrease arrow chart illustrations Green up and red down 3d arrow graph showing rising, descending trend, business result, 3d world money symbols. Financial growth. Green up and red down 3d arrow graph showing rising, descending trend, business result, profit or loss symbol symbol. Business arrow, goals concept. 3d world money symbols. Financial growth
Free with trial Green up and red down 3d arrow graph showing rising, descending trend, business result, profit or loss symbol symbol. Business arrow, goals concept. 3d world money symbols. Financial growth. Decrease arrow chart illustrations Green up and red down 3d arrow graph showing rising, descending trend, business result, 3d world money symbols. Financial growth. Green up and red down 3d arrow graph showing rising, descending trend, business result, profit or loss symbol symbol. Business arrow, goals concept. 3d world money symbols. Financial growth
Free with trial Green up and red down 3d arrow graph showing rising, descending trend, business result, profit or loss symbol symbol. Business arrow, goals concept. 3d world money symbols. Financial growth. Decrease arrow chart illustrations Green up and red down 3d arrow graph showing rising, descending trend, business result, 3d world money symbols. Financial growth. Green up and red down 3d arrow graph showing rising, descending trend, business result, profit or loss symbol symbol. Business arrow, goals concept. 3d world money symbols. Financial growth
Free with trial An economic crisis with falling oil barrel price and red down arrow symbol financial risk and market volatility loss concept. Decrease arrow chart illustrations Economic crisis with falling oil barrel price and red down arrow symbol financial risk and market volatility loss concept
Free with trial Businessman lifting up percentage sign. concept of Inflation or interest rate falling down, decrease, profit fall in economic recession. Decrease arrow chart vectors Businessman lifting up percentage sign. concept of Inflation or interest rate falling down, decrease, profit fall in economic
Free with trial A black graph shows a market normalization flat trend with a downward arrow on a white background. Decrease arrow chart illustrations Market normalization flat trend graph with downward arrow on white background image. A black graph shows a market normalization flat trend with a downward arrow on a white background
Free with trial CPI consumer price index going down decrease number consumption confidence in economy crisis purchasing power vector. Decrease arrow chart vectors CPI consumer price index going down decrease number consumption confidence in economy crisis purchasing power
Free with trial Horizontal chart line icon. Halftone dotted pattern. Gradient icon with grain shadow. Column graph sign. Market analytics symbol. Line horizontal chart icon. Various designs. Vector. Decrease arrow chart vectors Horizontal chart line icon. Column graph sign. Halftone dotted pattern. Vector. Horizontal chart line icon. Halftone dotted pattern. Gradient icon with grain shadow. Column graph sign. Market analytics symbol. Line horizontal chart icon. Various designs. Vector
Free with trial A vibrant purple arrow points downwards, landing in a glowing circle on a landscape with fiery lava, suggesting a market downturn or decline for investment analysis. Decrease arrow chart illustrations Market Dip Arrow Down with Glowing Circle. A vibrant purple arrow points downwards, landing in a glowing circle on a landscape with fiery lava, suggesting a market downturn or decline for investment analysis
Free with trial Methanol fuel commodity price in global market going down decrease low cheap international transaction trading market vector. Decrease arrow chart vectors Methanol fuel commodity price in global market going down decrease low cheap international transaction trading market
Free with trial A bold red zigzag arrow sharply descends, visually representing a significant downturn, loss, or negative trend. This graphic element powerfully conveys a downward trajectory. Decrease arrow chart illustrations Red zigzag arrow pointing downward symbolizing decline and loss. A bold red zigzag arrow sharply descends, visually representing a significant downturn, loss, or negative trend. This graphic element powerfully conveys a downward trajectory
Free with trial Declining business graph chart showing downward trend in finances. Decrease arrow chart vectors Declining business graph chart showing downward trend in finances
Free with trial Red dollar coin with a downward arrow, representing currency decline, devaluation, or financial loss. Decrease arrow chart vectors Minimalist Red dollar coin with a downward arrow. Red dollar coin with a downward arrow, representing currency decline, devaluation, or financial loss
Free with trial Drop down red arrow business market crisis on world map red dark background. Crisis economy and investment loss graph. vector illustration fantastic design. Decrease arrow chart vectors Drop down red arrow business market crisis on world map red dark background.
Free with trial Red arrow dramatically falls against a dark backdrop with scattered coins, suggesting financial downturn or market crash, suitable for economic analysis visuals. Decrease arrow chart illustrations Red Arrow Symbol Indicates Market Decline. Red arrow dramatically falls against a dark backdrop with scattered coins, suggesting financial downturn or market crash, suitable for economic analysis visuals
Free with trial Business bar graph icon vector with upward and downward arrow. Trend analysis symbol with long shadow. Decrease arrow chart vectors Business bar graph icon with upward and downward arrow. Trend analysis symbol with long shadow
Free with trial Flat 3d Isometric Falling Arrow Piercing Through Businessman Hand. Investment Risk and Downtrend Stock Market Concept. Decrease arrow chart vectors Isometric Falling Arrow Piercing Through Businessman Hand
Free with trial A focused hand uses red chalk drawing downward arrow on blackboard showing negative business concept and pessimistic financial decline. Decrease arrow chart illustrations Focused hand uses red chalk drawing downward arrow on blackboard showing negative business concept and pessimistic financial. A focused hand uses red chalk. A focused hand uses red chalk drawing downward arrow on blackboard showing negative business concept and pessimistic financial decline
Free with trial A black downward trending arrow with the text recession risk below it on a white background. Decrease arrow chart illustrations Downward trending arrow indicating recession risk on white background economy financial. A black downward trending arrow with the text recession risk below it on a white background
Free with trial A glossy, three-dimensional orange arrow curves downwards, clearly indicating a direction or a downward trend. This versatile graphic is perfect for representing various concepts related to movement or decline. Decrease arrow chart illustrations Bright orange curved downward arrow icon signifying direction and movement white background. A glossy, three-dimensional orange arrow curves downwards, clearly indicating a direction or a downward trend. This versatile graphic is perfect for representing various concepts related to movement or decline
Free with trial A 3D icon features a blue pound sterling symbol within a white circle, which is bordered by a light blue ring. To the right of the circle, a small orange circle contains a white downward-pointing triangle, indicating a decrease or fall. The icon is presented on a clean white background with a subtle shadow. Decrease arrow chart illustrations 3D Icon with Pound Sterling Symbol and Downward Arrow on White Background currency money. A 3D icon features a blue pound sterling symbol within a white circle, which is bordered by a light blue ring. To the right of the circle, a small orange circle contains a white downward-pointing triangle, indicating a decrease or fall. The icon is presented on a clean white background with a subtle shadow
Free with trial Vibrant financial decisions shown through floating digital market charts --chaos 55 --ar 16:9 --profile 8vfa4lb --v 7 Job ID: 73c43520-d3ac-4d75-940e-9fab8db6f1ed. Generative AI. Decrease arrow chart illustrations Red Arrow Decrease on Stock Market Graph Showing Economic Downturn and Financial Decline. Vibrant financial decisions shown through floating digital market charts --chaos 55 --ar 16:9 --profile 8vfa4lb --v 7 Job ID: 73c43520-d3ac-4d75-940e-9fab8db6f1ed. Generative AI
Free with trial Drop in demand for AI caused by crisis is demonstrated by woman going down chart, holding supermarket cart. Technological crisis and problems of artificial intelligence negatively affect use of AI. Decrease arrow chart vectors Drop in demand for AI caused by crisis demonstrated by woman going down chart, holding shopping cart. Drop in demand for AI caused by crisis is demonstrated by woman going down chart, holding supermarket cart. Technological crisis and problems of artificial intelligence negatively affect use of AI
Free with trial A glossy, vibrant orange arrow curves gracefully downwards, indicating a path or a decline. Its smooth finish and clear direction make it a versatile graphic element. Decrease arrow chart illustrations Bright orange curved arrow pointing downward showing direction and progress white background. A glossy, vibrant orange arrow curves gracefully downwards, indicating a path or a decline. Its smooth finish and clear direction make it a versatile graphic element
Free with trial A visually striking 3D blue arrow pointing downwards. This versatile icon signifies downloads, declines, or directional movement, perfect for web interfaces and digital applications. Decrease arrow chart illustrations Bright blue 3d downward pointing arrow icon for download or directional use white background. A visually striking 3D blue arrow pointing downwards. This versatile icon signifies downloads, declines, or directional movement, perfect for web interfaces and digital applications
Free with trial Downward trending bar graph with a black arrow, representing losses. Decrease arrow chart vectors Downward trending bar graph with a black arrow, representing losses
Free with trial Declining Bar Graph with Arrow Showing Increase and Downward Trend. Decrease arrow chart vectors Declining Bar Graph with Arrow Showing Increase and Downward Trend
Free with trial Red falling arrow and desperate businessman silhouette representing stock market crash, investment loss and financial crisis. Decrease arrow chart illustrations Stock market crash showing a desperate businessman and red falling arrow on digital screen. Red falling arrow and desperate businessman silhouette representing stock market crash, investment loss and financial crisis
Free with trial Economy growth arrow icons on white. Decrease arrow chart illustrations Economy growth arrow icons
Free with trial Indicating negative trend red arrow slanting down on finance dashboard, with bars and data points. Financial, analytics, data visualization, technology, digital interface, dashboard, statistical. Decrease arrow chart illustrations Indicating negative trend red arrow slanting down on finance dashboard, with bars and data points
Free with trial Green arrow on financial graph with terrified cartoon face reacting to a sharp downward trend. Concept of market crash or business loss. Decrease arrow chart illustrations Green arrow on financial graph with terrified cartoon face reacting to a sharp downward trend
Free with trial A vibrant, flat-design illustration depicts a bar graph with a downward-trending arrow, suggesting a decline in data. The graph features bars in red, yellow, green, and blue, set against a clean white background. The composition is simple, yet conveys a clear message of financial or performance decrease. Decrease arrow chart illustrations Colorful Bar Graph with Declining Trend and Arrows, Business Concept. A vibrant, flat-design illustration depicts a bar graph with a downward-trending arrow, suggesting a decline in data. The graph features bars in red, yellow, green, and blue, set against a clean white background. The composition is simple, yet conveys a clear message of financial or performance decrease
Free with trial A 3D render of a pink globe with yellow continents and a red downward arrow piercing it. Isolated on a transparent background. Decrease arrow chart vectors Pink globe with yellow continents and red arrow isolated on a transparent background earth. A 3D render of a pink globe with yellow continents and a red downward arrow piercing it. Isolated on a transparent background
Free with trial An orange downward arrow illustrates a declining trend on a dark background, suitable for depicting economic downturn or negative progress. Decrease arrow chart illustrations Downward Arrow Declining Trend Decline Graphic. An orange downward arrow illustrates a declining trend on a dark background, suitable for depicting economic downturn or negative progress
Free with trial A shiny, three-dimensional red arrow is depicted, angled downwards. It is isolated against a pure white background, making it stand out clearly. Decrease arrow chart illustrations A glossy red arrow pointing downwards isolated on white background. A shiny, three-dimensional red arrow is depicted, angled downwards. It is isolated against a pure white background, making it stand out clearly
Free with trial A bar graph with descending blue, yellow, and red bars, accompanied by a downward-pointing arrow, symbolizes economic decline or negative trends on a clean white background. Decrease arrow chart illustrations Colorful Bar Graph with Downward Arrow Illustrating Economic Decline. A bar graph with descending blue, yellow, and red bars, accompanied by a downward-pointing arrow, symbolizes economic decline or negative trends on a clean white background
Free with trial Red stock market investment decline chart. Decrease arrow chart vectors Red stock market investment decline chart
Free with trial Red stock market investment decline chart. Decrease arrow chart vectors Red stock market investment decline chart
Free with trial A sharp, red zigzag arrow points downwards, indicating a decline or loss, isolated on a clean white background. Decrease arrow chart illustrations Red downward zigzag arrow isolated on white background. A sharp, red zigzag arrow points downwards, indicating a decline or loss, isolated on a clean white background
Free with trial A 3D rendered image of a red arrow pointing downwards, suggesting a negative trend or decline. The arrow has a feathered fletching and casts a shadow on a white background, emphasizing the downward direction. The image is clean and minimalist, perfect for illustrating concepts of loss, decline, or. Decrease arrow chart illustrations Red Arrow Downward Trend. A 3D rendered image of a red arrow pointing downwards, suggesting a negative trend or decline. The arrow has a feathered fletching and casts a shadow on a white background, emphasizing the downward direction. The image is clean and minimalist, perfect for illustrating concepts of loss, decline, or
Free with trial A digital illustration of a declining line graph with a large downward arrow and a coin at the bottom, representing financial decline or market loss, suitable for economic and business contexts. Decrease arrow chart illustrations Downward Trending Graph with Falling Line Chart and Coin Illustration. A digital illustration of a declining line graph with a large downward arrow and a coin at the bottom, representing financial decline or market loss, suitable for economic and business contexts
Free with trial A simple red line graph showing a sharp downward trend with an arrow indicating a significant decrease, symbolizing loss or decline in performance. Decrease arrow chart illustrations Red downward trending graph isolated on white background. A simple red line graph showing a sharp downward trend with an arrow indicating a significant decrease, symbolizing loss or decline in performance
Free with trial LNG Liquified Natural Gas price in global market going down decrease low international transaction trading commodity market vector. Decrease arrow chart vectors LNG Liquified Natural Gas price in global market going down decrease low international transaction trading commodity
Free with trial A futuristic digital infographic showcasing business strategy and growth. The scene features glowing charts, bar graphs, circular progress indicators with percentages, and stacks of gold coins, symbolizing financial success. A prominent neon arrow curves upwards, indicating a positive trend and progress. The dark, high-tech background enhances the visual impact, making it ideal for presentations on finance, business, technology, and data analysis. Decrease arrow chart illustrations Digital Growth Infographic with Financial Data and Upward Trend Arrow. A futuristic digital infographic showcasing business strategy and growth. The scene features glowing charts, bar graphs, circular progress indicators with percentages, and stacks of gold coins, symbolizing financial success. A prominent neon arrow curves upwards, indicating a positive trend and progress. The dark, high-tech background enhances the visual impact, making it ideal for presentations on finance, business, technology, and data analysis.
Free with trial Set Mobile stock trading, Dollar rate decrease, Broken piggy bank and icon. Vector. Decrease arrow chart illustrations Set Mobile stock trading, Dollar rate decrease, Broken piggy bank and icon. Vector
Free with trial Business bar graph with upward and downward arrow. Trend analysis icon vector. Decrease arrow chart vectors Business bar graph with upward and downward arrow. Trend analysis icon
Free with trial Growth vector icon. Graph or diagram with arrow going up and down. Vector illustration. Decrease arrow chart vectors Growth vector icon. Graph or diagram with arrow going up and down. Vector
Free with trial Business bar graph icon with upward and downward arrow. Trend analysis symbol vector in circular outline. Decrease arrow chart vectors Business bar graph icon with upward and downward arrow. Trend analysis symbol in circular outline
Free with trial Falling trend sketch of business finance graph with bar charts and arrow. Decrease arrow chart illustrations Falling trend sketch of business finance graph with bar charts and arrow
Free with trial A bar graph illustrates a decreasing trend in financial performance, indicated by a red arrow and a dollar symbol. Decrease arrow chart illustrations Bar chart showing financial decline with downward trend and dollar sign. A bar graph illustrates a decreasing trend in financial performance, indicated by a red arrow and a dollar symbol
Free with trial An illustration of a red downward trending arrow icon in a frame is set against a soft, pastel pink backdrop. Decrease arrow chart illustrations Downward Trend Arrow Icon on Pink Background Representing Financial Loss. An illustration of a red downward trending arrow icon in a frame is set against a soft, pastel pink backdrop.
Free with trial A businessman gestures towards a downward-trending red arrow on a graph, illustrating concepts of financial decline, market downturn, economic recession, investment loss, and business failure. The image is clean, using a white background, and ideal for presentations or articles related to financial crisis and negative trends, generated by AI. Decrease arrow chart illustrations Businessman showing decreasing red graph arrow down. A businessman gestures towards a downward-trending red arrow on a graph, illustrating concepts of financial decline, market downturn, economic recession, investment loss, and business failure. The image is clean, using a white background, and ideal for presentations or articles related to financial crisis and negative trends, generated by AI.
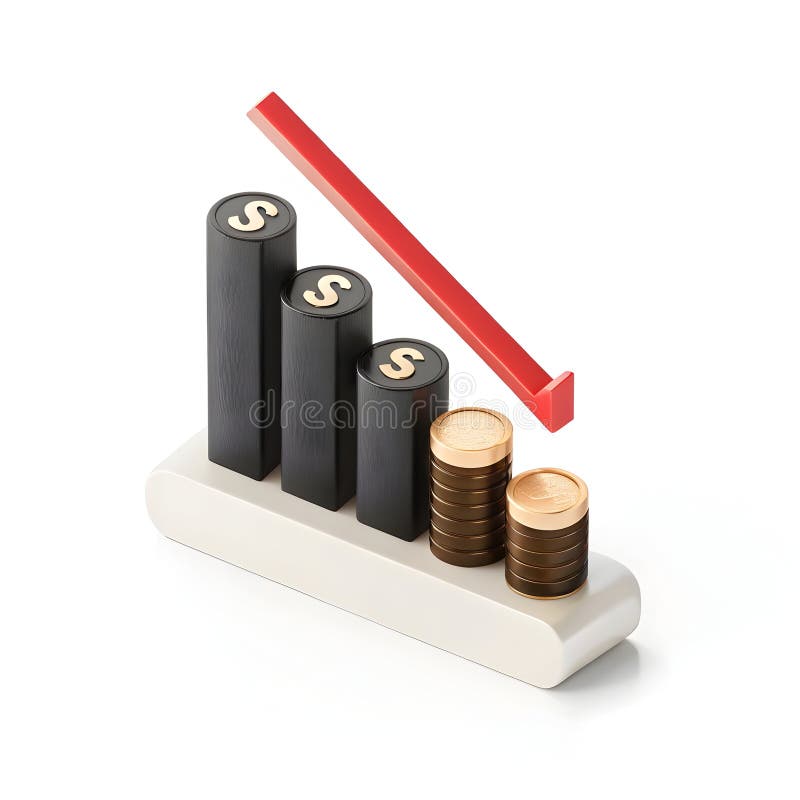
Free with trial A 3D illustration depicts a financial graph with a downward trend. Three black bars, each topped with a gold dollar sign, decrease in height from left to right. To the right of the bars, two stacks of gold coins are shown, also decreasing in height. A thick red arrow points downwards, crossing over the bars and coins, indicating a decline. The entire composition rests on a white base and is set. Decrease arrow chart illustrations Falling financial graph with stacked coins finance. A 3D illustration depicts a financial graph with a downward trend. Three black bars, each topped with a gold dollar sign, decrease in height from left to right. To the right of the bars, two stacks of gold coins are shown, also decreasing in height. A thick red arrow points downwards, crossing over the bars and coins, indicating a decline. The entire composition rests on a white base and is set
Free with trial Increase and Decrease Stroke icon collections. Containing Increase, Decrease, Growth, Fall, up, down icons. Editable Stroke icon collections. Decrease arrow chart vectors Increase and Decrease Stroke icon collections.
Free with trial A bright red, jagged arrow points downwards, indicating a sharp decline or negative trend, isolated on a white background. Decrease arrow chart illustrations Red jagged downward trend arrow isolated on white background. A bright red, jagged arrow points downwards, indicating a sharp decline or negative trend, isolated on a white background
Free with trial Flat lay colorful arrow sign symbol falling down on blue background copy space. Abstract economy crisis, stock market collapse, business, finance and investment loss concept. Decrease arrow chart illustrations Flat lay colorful arrow sign symbol falling down on blue background copy space.
Free with trial Conceptual graph with decrease report. Dark diagram with recession and bankruptcy progress. Business and finance vector illustration. Decrease arrow chart vectors Conceptual graph with decrease report. Dark diagram with recession and bankruptcy progress. Business and finance vector
Free with trial Red curved arrow pointing downwards on a white background. Decrease arrow chart vectors Red curved arrow pointing downwards
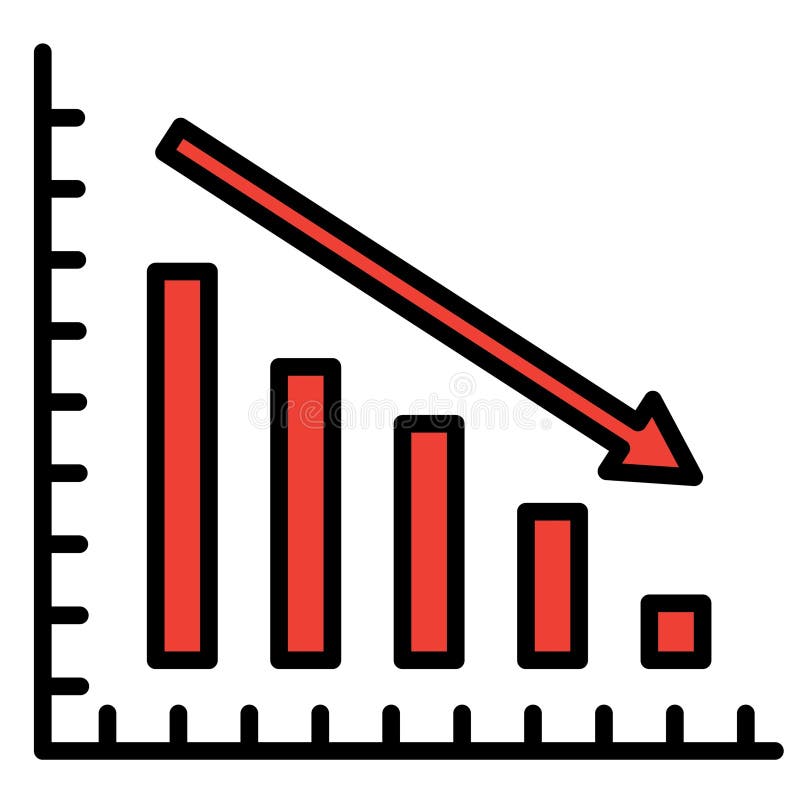
Free with trial A stark red bar graph illustrates a sharp downward trend with a prominent arrow, visually representing financial decline, economic recession, or business failure. Decrease arrow chart illustrations Red bar graph with downward arrow isolated on white background. A stark red bar graph illustrates a sharp downward trend with a prominent arrow, visually representing financial decline, economic recession, or business failure
Free with trial Black And White Vector Illustrations. Stock Price Fall. Arrow On Chart Pointing Down. Bear Head. Stock Market Concept. Decrease arrow chart vectors Bear Market Icons. Black And White Vector Illustrations. Stock Price Fall. Arrow On Chart Pointing Down. Bear Head. Stock Market Concept
Free with trial Diagram with recession and bankruptcy. Graph with decrease report. Business and finance vector illustration. Decrease arrow chart vectors Diagram with recession and bankruptcy. Graph with decrease report. Business and finance vector
Free with trial People are stressed by a financial chart with falling indicators, showing a loss of money and investments due to a market downturn. Decrease arrow chart vectors People stressed by a financial chart with falling indicators. people are stressed by a financial chart with falling indicators, showing a loss of money and investments due to a market downturn.
Free with trial Cost reduction icon price lower arrow. Vector low cost money crisis line icon. Decrease arrow chart vectors Cost reduction icon price lower arrow. Vector low cost money crisis line icon
Free with trial A glossy red arrow curves downwards, symbolizing a decrease or negative progression. This striking visual effectively communicates concepts of falling, loss, or a downward trend in a clear and impactful manner. Decrease arrow chart illustrations Dynamic red arrow points downward indicating decline loss or negative trend. A glossy red arrow curves downwards, symbolizing a decrease or negative progression. This striking visual effectively communicates concepts of falling, loss, or a downward trend in a clear and impactful manner
Free with trial A shiny red arrow curves downwards, indicating a downward trend or negative growth. This image visually represents concepts like financial decline market crash or falling stock prices. Decrease arrow chart illustrations Red arrow points downward showing decline trend and negative growth concept. A shiny red arrow curves downwards, indicating a downward trend or negative growth. This image visually represents concepts like financial decline market crash or falling stock prices
Free with trial A sharp, transparent glass arrow pointing downwards, surrounded by glistening water droplets, signifying a downward trend or decline in a conceptual manner. Decrease arrow chart illustrations Transparent arrow pointing downwards, isolated on white background background copy space. A sharp, transparent glass arrow pointing downwards, surrounded by glistening water droplets, signifying a downward trend or decline in a conceptual manner.
Free with trial The image depicts a bar graph displayed on an easel, illustrating a downward trend over time. The bars start high on the left and progressively decrease in height towards the right, with a red arrow emphasizing the decline. The graph's y-axis appears to measure an unspecified metric, while the x-axis represents a timeline. Decrease arrow chart illustrations Graph showing decline over time. The image depicts a bar graph displayed on an easel, illustrating a downward trend over time. The bars start high on the left and progressively decrease in height towards the right, with a red arrow emphasizing the decline. The graph's y-axis appears to measure an unspecified metric, while the x-axis represents a timeline
Free with trial Visual representation of a financial downturn. A bar chart shows a sharp decline, accompanied by a warning sign and a gold dollar coin, symbolizing economic trouble and risk. Decrease arrow chart illustrations Financial crisis alert decreasing bar chart with dollar coin and warning sign. Visual representation of a financial downturn. A bar chart shows a sharp decline, accompanied by a warning sign and a gold dollar coin, symbolizing economic trouble and risk.
Free with trial A striking red arrow curves downward, representing economic downturn, financial loss, or a negative trend. This visual metaphor is perfect for presentations on market changes or business performance. Decrease arrow chart illustrations Red downward arrow symbolizing decline and negative trend in business and finance. A striking red arrow curves downward, representing economic downturn, financial loss, or a negative trend. This visual metaphor is perfect for presentations on market changes or business performance
Free with trial Falling financial chart with a sharp decline. Space for text. Decrease arrow chart illustrations Falling financial chart with a sharp decline. Space for text.
Free with trial A dramatic business concept image showing a person in a business suit holding a glowing red line graph that is trending downwards with an arrow. The background is a blurred view of stock market ticker screens, clearly linking the downward trend to a financial market crash, recession, or investment loss. Generative AI. Decrease arrow chart illustrations A person in a suit holding a plunging red arrow graph in front of stock market screens. A dramatic business concept image showing a person in a business suit holding a glowing red line graph that is trending downwards with an arrow. The background is a blurred view of stock market ticker screens, clearly linking the downward trend to a financial market crash, recession, or investment loss. Generative AI.
Free with trial Horizontal chart line icon. Neumorphic, Flat shadow, 3d buttons. Column graph sign. Market analytics symbol. Line horizontal chart icon. Social media icons. Vector. Decrease arrow chart illustrations Horizontal chart line icon. Column graph sign. Neumorphic buttons. Vector. Horizontal chart line icon. Neumorphic, Flat shadow, 3d buttons. Column graph sign. Market analytics symbol. Line horizontal chart icon. Social media icons. Vector
Free with trial Diagram chart line icon. Neumorphic, Flat shadow, 3d buttons. Column 3d graph sign. Market analytics symbol. Line 3d chart icon. Social media icons. Vector. Decrease arrow chart vectors Diagram chart line icon. Column 3d graph sign. Neumorphic buttons. Vector. Diagram chart line icon. Neumorphic, Flat shadow, 3d buttons. Column 3d graph sign. Market analytics symbol. Line 3d chart icon. Social media icons. Vector
Free with trial A neon glowing graph with blue bars and pink zigzag arrow showing fluctuating growth on black background. Generative AI. Decrease arrow chart illustrations Neon glowing graph with blue bars and pink zigzag arrow showing fluctuating growth on black background