Free with trial Business decline icon with downward arrow. Loss, failure, or economic crisis symbol vector. Decrease arrow chart vectors Business decline icon with downward arrow. Loss, failure, or economic crisis symbol
Free with trial Fuel Pump Nozzle With Glowing Gasoline Drop and Market Chart. Decrease arrow chart illustrations Fuel Pump Nozzle With Glowing Gasoline Drop and Market Chart
Free with trial Stock and economic crisis graph background. Trade exchange, financial decrease, bed business strategy, digital asset, loss investment fund, online broker, stock collapse and crisis concept. Decrease arrow chart illustrations Stock and economic crisis graph background. Trade exchange, financial decrease
Free with trial A bold red zigzag arrow descends sharply, symbolizing a steep drop or negative trend, isolated on a clean white background. Decrease arrow chart illustrations A sharp red zigzag arrow pointing downwards indicating a significant decline isolated on white background. A bold red zigzag arrow descends sharply, symbolizing a steep drop or negative trend, isolated on a clean white background
Free with trial Black oil barrel with sharp red downward arrow, symbolizing declining oil prices, market downturn, economic losses, and energy sector instability. Generative AI. Decrease arrow chart illustrations Falling Oil Prices With Barrel And Downward Arrow. Black oil barrel with sharp red downward arrow, symbolizing declining oil prices, market downturn, economic losses, and energy sector instability. Generative AI
Free with trial A simple flat icon vector illustration of two hands adjusting a simple chart with a downturn arrow, symbolizing risk mitigation in a business setting. The simple chart with a downturn arrow is orange with dark gray elements, indicating loss control. White background. Minimalist style with sharp edges and no shadows. Orange and Gray color palette. Vector graphics with rounded corners. High. Decrease arrow chart illustrations Hands Protect Financial Growth Chart Decline, Business Crisis Management. A simple flat icon vector illustration of two hands adjusting a simple chart with a downturn arrow, symbolizing risk mitigation in a business setting. The simple chart with a downturn arrow is orange with dark gray elements, indicating loss control. White background. Minimalist style with sharp edges and no shadows. Orange and Gray color palette. Vector graphics with rounded corners. High
Free with trial Diagram chart line icon. Halftone dotted pattern. Gradient icon with grain shadow. Column 3d graph sign. Market analytics symbol. Line 3d chart icon. Various designs. Vector. Decrease arrow chart vectors Diagram chart line icon. Column 3d graph sign. Halftone dotted pattern. Vector. Diagram chart line icon. Halftone dotted pattern. Gradient icon with grain shadow. Column 3d graph sign. Market analytics symbol. Line 3d chart icon. Various designs. Vector
Free with trial Eco concept flatlay with green tea cup, leaf, chart, and text on green background,. Decrease arrow chart illustrations Eco concept flatlay with green tea cup, leaf, chart, and text on green background
Free with trial A bold red zigzag arrow points downwards, signifying a significant drop. Decrease arrow chart illustrations Sharp red zigzag arrow symbolizing financial decline and market downturn. A bold red zigzag arrow points downwards, signifying a significant drop
Free with trial A flat-style illustration depicting a falling bar graph, combined with a sad face emoji and recovery arrow for financial analysis. Decrease arrow chart vectors Decreasing bar graph with sad face emoji and upwards arrow showing potential recovery. A flat-style illustration depicting a falling bar graph, combined with a sad face emoji and recovery arrow for financial analysis.
Free with trial A bar chart showing a downward trend is painted on an artist's canvas, symbolizing an economic downturn. The red arrow emphasizes the decline. Decrease arrow chart illustrations Economic downturn depicted on artist\'s canvas. A bar chart showing a downward trend is painted on an artist's canvas, symbolizing an economic downturn. The red arrow emphasizes the decline
Free with trial Illustration shows a stock market decline with candlestick charts and downward trending arrow. The design features a light blue background and a simple layout. Useful for financial articles, reports, or any material illustrating loss, recession, or negative trends in commercial sector. Decrease arrow chart illustrations Falling stock market chart showing economic downturn and financial loss. Illustration shows a stock market decline with candlestick charts and downward trending arrow. The design features a light blue background and a simple layout. Useful for financial articles, reports, or any material illustrating loss, recession, or negative trends in commercial sector
Free with trial Declining chart icon. Negative trend graphic. Falling bar symbol. Vector diagram shape. EPS 10. Decrease arrow chart vectors Declining chart icon. Negative trend graphic. Falling bar symbol. Vector diagram shape.
Free with trial Cute cartoon clouds form a falling arrow against a vibrant blue and green paint splatter background. Decrease arrow chart illustrations Cartoon Clouds Falling Down Arrow on Colorful Splatter Background weather. Cute cartoon clouds form a falling arrow against a vibrant blue and green paint splatter background
Free with trial Hand is pointing towards a descending bar chart with bars in shades of red, orange, and yellow on a white background. Decrease arrow chart illustrations The hand points to the bar chart showing a downtrend. hand is pointing towards a descending bar chart with bars in shades of red, orange, and yellow on a white background.
Free with trial Finger Pressing Red Down Arrow Market Indicator. Decrease arrow chart illustrations Finger Pressing Red Down Arrow Market Indicator
Free with trial Illustration of a growing budget efficiency with a simple money bag closing tightly, a stylized downward-pointing cost arrow, and a stream of saved coins. Vector flat icon design on a white background for a cost control illustration --chaos 30 --ar 16:9 --v 7 Job ID: 35adf769-e45b-43cf-a8e7-0b2af69479b3. Decrease arrow chart illustrations Money Bag Downward Arrow, Financial Crisis, Economic Downturn, Falling Value. Illustration of a growing budget efficiency with a simple money bag closing tightly, a stylized downward-pointing cost arrow, and a stream of saved coins. Vector flat icon design on a white background for a cost control illustration --chaos 30 --ar 16:9 --v 7 Job ID: 35adf769-e45b-43cf-a8e7-0b2af69479b3
Free with trial A blue arrow pointing upwards next to a bar graph, some bars are broken, symbolizing growth and decline in a business or market. Decrease arrow chart illustrations Blue Arrow and Bar Graph Showing Growth and Decline. A blue arrow pointing upwards next to a bar graph, some bars are broken, symbolizing growth and decline in a business or market
Free with trial A blue 3D coin with a downward-pointing arrow is positioned next to ascending green bars. The coin and bars are arranged on a white background, with the bars increasing in height from left to right, representing growth or progress. The combination of elements might symbolize financial or economic trends, with the blue coin indicating a decrease and the green bars suggesting upward momentum or improvement. Decrease arrow chart illustrations Blue coin with down arrow and green growth bars. A blue 3D coin with a downward-pointing arrow is positioned next to ascending green bars. The coin and bars are arranged on a white background, with the bars increasing in height from left to right, representing growth or progress. The combination of elements might symbolize financial or economic trends, with the blue coin indicating a decrease and the green bars suggesting upward momentum or improvement.
Free with trial A bright green 3D arrow icon is depicted against a clean white background. The arrow is stylized with a thick outline and a slightly angled perspective, clearly indicating a downward direction. The object casts a subtle shadow, adding depth and dimension to the graphic. Decrease arrow chart illustrations 3D Green Arrow Icon Pointing Downward on White Background direction symbol. A bright green 3D arrow icon is depicted against a clean white background. The arrow is stylized with a thick outline and a slightly angled perspective, clearly indicating a downward direction. The object casts a subtle shadow, adding depth and dimension to the graphic
Free with trial A large red arrow points downward on a grid background with a spotlight shining down. the arrow is reflected on the surface below. Decrease arrow chart illustrations A red arrow pointing downward on a grid background. a large red arrow points downward on a grid background with a spotlight shining down. the arrow is reflected on the surface below
Free with trial Financial-themed illustration featuring bar and line graphs with upward trends, a red percentage symbol, and a pie chart with dollar signs. A laptop displays an arrow with coins, suggesting growth. Circular icons with arrows indicate increase and decrease, emphasizing data fluctuation. The background is light blue. Decrease arrow chart vectors Charts and diagram icon set. Charts and graphs. Pie , Line , Candlestick Chart. Planning and visualization of statistics. Financial-themed illustration featuring bar and line graphs with upward trends, a red percentage symbol, and a pie chart with dollar signs. A laptop displays an arrow with coins, suggesting growth. Circular icons with arrows indicate increase and decrease, emphasizing data fluctuation. The background is light blue.
Free with trial Stacks of coins decrease in height from left to right, with a red arrow indicating a downward trend, symbolizing financial loss or recession. Decrease arrow chart illustrations Financial decline illustrated by falling coin stacks and red arrow. Stacks of coins decrease in height from left to right, with a red arrow indicating a downward trend, symbolizing financial loss or recession
Free with trial A visual representation of financial downturn, showing decreasing stacks of coins and a prominent red downward trending arrow. Decrease arrow chart illustrations Financial decline illustrated by falling coin stacks and red arrow. A visual representation of financial downturn, showing decreasing stacks of coins and a prominent red downward trending arrow
Free with trial A shiny, transparent blue glass arrow curves downwards, pointing towards the bottom right of the frame. The arrow has a smooth, reflective surface and is rendered in 3D. It is presented on a clean white background, casting a subtle shadow. Decrease arrow chart illustrations Blue Glass Arrow Symbol Pointing Downward on White Background transparent. A shiny, transparent blue glass arrow curves downwards, pointing towards the bottom right of the frame. The arrow has a smooth, reflective surface and is rendered in 3D. It is presented on a clean white background, casting a subtle shadow
Free with trial A vibrant blue, transparent, three-dimensional arrow curves and points downward against a clean white background. The arrow has a glossy, smooth finish, and a subtle shadow is visible beneath it, suggesting depth. This graphic element clearly indicates a downward direction or trend. Decrease arrow chart illustrations Blue Transparent Arrow Pointing Downward on a White Background image photo. A vibrant blue, transparent, three-dimensional arrow curves and points downward against a clean white background. The arrow has a glossy, smooth finish, and a subtle shadow is visible beneath it, suggesting depth. This graphic element clearly indicates a downward direction or trend
Free with trial Financial business graph with bars decreasing and red arrow pointing down. Concept for economic recession or stock market decline. Decrease arrow chart vectors Financial graph showing downward trend with arrow. Financial business graph with bars decreasing and red arrow pointing down. Concept for economic recession or stock market decline
Free with trial A red arrow pointing downwards with three circles on a white background. Decrease arrow chart illustrations A red arrow pointing downwards with three circles
Free with trial Bar graph with blue arrow pointing down 3D illustration isolated on transparent background. Decrease arrow chart illustrations Bar graph with blue arrow pointing down 3D
Free with trial Illustrating economic crisis with a red chart breaking, showing decreasing financial stability. Perfect for themes of crisis, finance, business, and market fluctuations. The image is generated with the use of an AI. Decrease arrow chart illustrations Red chart showing falling and breaking bars. Illustrating economic crisis with a red chart breaking, showing decreasing financial stability. Perfect for themes of crisis, finance, business, and market fluctuations. The image is generated with the use of an AI
Free with trial A 3d graph with a purple arrow pointing down and a yellow warning sign on top, indicating a decrease or warning in the data being represented. Decrease arrow chart illustrations A colorful graph with a purple arrow pointing down. a 3d graph with a purple arrow pointing down and a yellow warning sign on top, indicating a decrease or warning in the data being represented
Free with trial An illustrative icon depicting a strong blue shield encompassing a red segment of a pie chart and a prominent white downward-pointing arrow. This visual metaphor represents financial protection, risk management, and safeguarding against economic decline or market downturns. It symbolizes strategies to mitigate losses, secure investments, and manage negative trends in business or finance. Ideal for conveying concepts of security, crisis management, and data analysis related to falling statistics or decreasing performance in corporate presentations, reports, and financial articles. Decrease arrow chart vectors Financial Protection Against Economic Decline Icon. An illustrative icon depicting a strong blue shield encompassing a red segment of a pie chart and a prominent white downward-pointing arrow. This visual metaphor represents financial protection, risk management, and safeguarding against economic decline or market downturns. It symbolizes strategies to mitigate losses, secure investments, and manage negative trends in business or finance. Ideal for conveying concepts of security, crisis management, and data analysis related to falling statistics or decreasing performance in corporate presentations, reports, and financial articles.
Free with trial A glossy, transparent blue arrow is depicted against a white background. The arrow is curved, pointing downwards and to the right, suggesting a direction or a decline. The 3D rendering gives it a solid, glass-like appearance with subtle reflections. Decrease arrow chart illustrations Blue Transparent Arrow Pointing Down and to the Right on a White Background down arrow. A glossy, transparent blue arrow is depicted against a white background. The arrow is curved, pointing downwards and to the right, suggesting a direction or a decline. The 3D rendering gives it a solid, glass-like appearance with subtle reflections
Free with trial Dramatic red arrow pointing down symbolizes financial loss, market downturn, or economic recession. Perfect for illustrating concepts of decline, risk, and negative trends in business or finance. Ideal for presentations on economics, investments, and market analysis. Decrease arrow chart vectors Red downward arrow indicating financial decline or economic downturn concept. Dramatic red arrow pointing down symbolizes financial loss, market downturn, or economic recession. Perfect for illustrating concepts of decline, risk, and negative trends in business or finance. Ideal for presentations on economics, investments, and market analysis
Free with trial A clean, flat design illustration of a bar graph depicting a significant downward trend, highlighted by a bold blue arrow pointing downwards. Decrease arrow chart illustrations A bar graph showing a downward trend with a blue arrow. A clean, flat design illustration of a bar graph depicting a significant downward trend, highlighted by a bold blue arrow pointing downwards
Free with trial This graphic depicts a bar chart showing a progressive decline in values. Four vertical bars, rendered in shades of blue, decrease in height from left to right, symbolizing a reduction. Each bar is accompanied by a dark grey downward-pointing arrow, reinforcing the concept of a negative trend or decrease. The clean, minimalist composition on a white background provides a clear and easily. Decrease arrow chart vectors A bar chart illustrates a clear downward trend with multiple decreasing values. This graphic depicts a bar chart showing a progressive decline in values. Four. This graphic depicts a bar chart showing a progressive decline in values. Four vertical bars, rendered in shades of blue, decrease in height from left to right, symbolizing a reduction. Each bar is accompanied by a dark grey downward-pointing arrow, reinforcing the concept of a negative trend or decrease. The clean, minimalist composition on a white background provides a clear and easily
Free with trial A gleaming golden arrow is depicted in a 3D render, angled downwards and to the right. The arrow has a hollow, geometric design with sharp edges, reflecting light and appearing highly polished. It casts a subtle shadow on the clean white background, emphasizing its three-dimensional form and isolation. Decrease arrow chart illustrations Shiny Golden Arrow Pointing Downwards on a White Background direction decline. A gleaming golden arrow is depicted in a 3D render, angled downwards and to the right. The arrow has a hollow, geometric design with sharp edges, reflecting light and appearing highly polished. It casts a subtle shadow on the clean white background, emphasizing its three-dimensional form and isolation
Free with trial Set of black icons showing a digital clock, triangular shape within a square, bar chart with line graph overlay, atomic model, upward arrows, and a ruler with a downward arrow. Generative AI. Decrease arrow chart vectors Black digital clock triangle chart atom arrows and ruler icons. Set of black icons showing a digital clock, triangular shape within a square, bar chart with line graph overlay, atomic model, upward arrows, and a ruler with a downward arrow. Generative AI
Free with trial Up and down arrow icon vector in simple style. Decrease arrow chart vectors Up and down arrow icon in simple style. Up and down arrow icon vector in simple style
Free with trial Financial decline downward arrow trend business target. Decrease arrow chart vectors RED Financial decline downward arrow trend business icon. Financial decline downward arrow trend business target
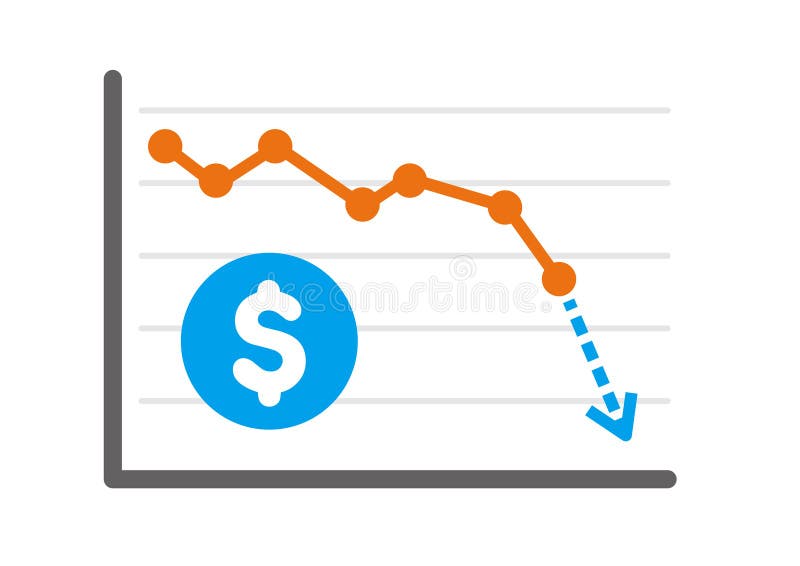
Free with trial US Dollar Exchange Chart Illustration Falling. Decrease arrow chart illustrations US Dollar Exchange Chart Illustration Falling
Free with trial A red zigzag arrow points downwards, descending a staircase made of beige blocks against a light blue background , image generative using ai tools. Decrease arrow chart illustrations Red downward trending arrow on a staircase of blocks. A red zigzag arrow points downwards, descending a staircase made of beige blocks against a light blue background , image generative using ai tools
Free with trial A visual representation of economic downturn shows a declining graph, a downward arrow, and a falling coin, conveying a sense of loss and financial instability perfect for illustrating business reports or financial articles. Decrease arrow chart vectors Financial decline graph with downward arrow and coin. A visual representation of economic downturn shows a declining graph, a downward arrow, and a falling coin, conveying a sense of loss and financial instability perfect for illustrating business reports or financial articles
Free with trial Economic crisis line icon of real estate value down or property depreciation, vector outline symbol. Real estate value decrease with arrow down icon for global economic crisis and financial downturn. Decrease arrow chart vectors Economic crisis line icon, real estate value down. Economic crisis line icon of real estate value down or property depreciation, vector outline symbol. Real estate value decrease with arrow down icon for global economic crisis and financial downturn
Free with trial A stark red downward arrow dominates this compelling graphic, set against a pristine white background. This impactful 3D render visualizes a decreasing trend, effectively representing economic downturns and financial losses. The image's concise nature makes it ideal for illustrating negative market performance, business losses, or budget reduction. Use this conceptual illustration to depict. Decrease arrow chart illustrations Declining trend represented by a red arrow on a white background depicting economic downturn or financial losses. A stark red downward arrow dominates this compelling graphic, set against a pristine white background. This impactful 3D render visualizes a decreasing trend, effectively representing economic downturns and financial losses. The image's concise nature makes it ideal for illustrating negative market performance, business losses, or budget reduction. Use this conceptual illustration to depict
Free with trial A 3D rendered icon depicting a downward trend graph is presented on a black circular background with a polished gold rim. The graph features golden bars of decreasing height and a golden line graph with a downward-pointing arrow, clearly illustrating a decline. The entire icon is isolated on a white background, emphasizing its metallic gold and black elements. Decrease arrow chart illustrations Gold Downward Trend Graph Icon on Black Circle with Gold Rim on White Background chart. A 3D rendered icon depicting a downward trend graph is presented on a black circular background with a polished gold rim. The graph features golden bars of decreasing height and a golden line graph with a downward-pointing arrow, clearly illustrating a decline. The entire icon is isolated on a white background, emphasizing its metallic gold and black elements
Free with trial A bar graph illustrating a decline in values with an orange downward arrow indicating loss. Decrease arrow chart illustrations Graph showing decline and loss with orange bars and arrow. A bar graph illustrating a decline in values with an orange downward arrow indicating loss
Free with trial A sharp red arrow zigzags downwards, indicating a significant decline or loss, isolated on a plain white background. Decrease arrow chart illustrations Red downward trend arrow isolated on white background. A sharp red arrow zigzags downwards, indicating a significant decline or loss, isolated on a plain white background
Free with trial A sharp red zigzag arrow points downwards, indicating a decline or fall, isolated on a white background. Decrease arrow chart illustrations Red downward trend arrow isolated on white background. A sharp red zigzag arrow points downwards, indicating a decline or fall, isolated on a white background
Free with trial Three blue apple icons are depicted. The top apple stands alone, and the two below have arrows beside them. The left apple has a downward arrow, indicating a decrease, while the right apple is paired with an upward arrow, suggesting an increase. Each apple is solid blue with a small leaf, symbolizing fruit-related data or trends. The arrangement is simple and symmetrical on a white background, with the icons representing changes in quantity or direction. Decrease arrow chart vectors Apples with up and down arrows with fruit icon with directional arrows. Three blue apple icons are depicted. The top apple stands alone, and the two below have arrows beside them. The left apple has a downward arrow, indicating a decrease, while the right apple is paired with an upward arrow, suggesting an increase. Each apple is solid blue with a small leaf, symbolizing fruit-related data or trends. The arrangement is simple and symmetrical on a white background, with the icons representing changes in quantity or direction.
Free with trial A minimalist black outline arrow pointing directly downwards, set against a clean white background. This simple graphic element is ideal for indicating direction, flow, download, reduction, or a downward trend. Its clean design makes it versatile for various digital and print applications, including user interfaces, presentations, infographics, and instructional materials. The clear, uncluttered composition ensures easy integration into any project. Generated by AI. Decrease arrow chart illustrations Vertical Downward Arrow Line Icon on White Background. A minimalist black outline arrow pointing directly downwards, set against a clean white background. This simple graphic element is ideal for indicating direction, flow, download, reduction, or a downward trend. Its clean design makes it versatile for various digital and print applications, including user interfaces, presentations, infographics, and instructional materials. The clear, uncluttered composition ensures easy integration into any project. Generated by AI
Free with trial Red arrow pointing downwards over decreasing stacks of gold coins on a white background. Concept of financial loss, decline. 3D Rendering. Decrease arrow chart illustrations Red arrow descending over stacks of coins on white background. 3D Rendering. Red arrow pointing downwards over decreasing stacks of gold coins on a white background. Concept of financial loss, decline. 3D Rendering
Free with trial 3D graphic depicts a steeply declining bar graph in red hues, showing economic loss. A downward-sloping arrow extends over the bars, illustrating the negative trend. The text reads "-40% PROFIT," emphasizing financial decline. The bars decrease in height from left to right, indicating progressive loss. The background is a dark grid, enhancing the focus on the graph. The visual conveys the concept of significant profit reduction and economic downturn. Decrease arrow chart illustrations 3D Financial Concept of Profit Loss and Economic Decline. 3D graphic depicts a steeply declining bar graph in red hues, showing economic loss. A downward-sloping arrow extends over the bars, illustrating the negative trend. The text reads "-40% PROFIT," emphasizing financial decline. The bars decrease in height from left to right, indicating progressive loss. The background is a dark grid, enhancing the focus on the graph. The visual conveys the concept of significant profit reduction and economic downturn.
Free with trial Prepare for economic downfall, Considerate businessman with skateboard getting ready to race down a financial chart. Decrease arrow chart vectors Prepare for economic downfall, Considerate businessman with skateboard getting ready to race down a financial chart
Free with trial Sharp downward sloping line graph red arrow pointing down background red Suitable for digital platforms. Decrease arrow chart illustrations Sharp downward sloping line graph, red arrow pointing down, background, red. Sharp downward sloping line graph red arrow pointing down background red Suitable for digital platforms
Free with trial A vivid red zig-zag arrow illustrates a downward trend, symbolizing financial decline, market volatility, or negative progress. This versatile graphic is perfect for business and finance presentations. Decrease arrow chart vectors Red zig zag arrow isolated on transparent background transparent background. A vivid red zig-zag arrow illustrates a downward trend, symbolizing financial decline, market volatility, or negative progress. This versatile graphic is perfect for business and finance presentations
Free with trial A red arrow graphic with a jagged line that initially points upward then turns to point downward. Decrease arrow chart illustrations A red arrow pointing downward with an upward trend. a red arrow graphic with a jagged line that initially points upward then turns to point downward
Free with trial The image features a large black Euro currency symbol with a green upward arrow and a red downward arrow, set against a white background. The green arrow suggests growth or increase, while the red arrow indicates decline or decrease. This visual representation can be used to illustrate financial concepts such as fluctuating currency values, economic trends, or market performance. Decrease arrow chart vectors Euro currency symbol with green up and red down arrows. The image features a large black Euro currency symbol with a green upward arrow and a red downward arrow, set against a white background. The green arrow suggests growth or increase, while the red arrow indicates decline or decrease. This visual representation can be used to illustrate financial concepts such as fluctuating currency values, economic trends, or market performance.
Free with trial Two identical green 3D arrows are positioned vertically on a white background. Both arrows are pointing directly downwards. The top arrow is positioned above the bottom arrow, creating a sense of sequence or progression. The arrows have a smooth, rounded appearance and cast subtle shadows. Decrease arrow chart illustrations Two Green 3D Arrows Pointing Downward on a White Background down arrow direction. Two identical green 3D arrows are positioned vertically on a white background. Both arrows are pointing directly downwards. The top arrow is positioned above the bottom arrow, creating a sense of sequence or progression. The arrows have a smooth, rounded appearance and cast subtle shadows
Free with trial Visualize the bear market with this striking 3D cartoon bear illustration. A prominent red downward arrow emphasizes the bearish sentiment, representing a decline in financial trends. This powerful concept visualizes falling stock market values, showcasing the potential for loss and failure in investment. This image is ideal for illustrating articles on economy, finance, and trading, particularly. Decrease arrow chart illustrations Bear market concept depicted by a brown cartoon bear with a red downward arrow representing declining financial trends. Visualize the bear market with this striking 3D cartoon bear illustration. A prominent red downward arrow emphasizes the bearish sentiment, representing a decline in financial trends. This powerful concept visualizes falling stock market values, showcasing the potential for loss and failure in investment. This image is ideal for illustrating articles on economy, finance, and trading, particularly
Free with trial Currency Devaluation Concept with Stock Market Chart and Green Note. Decrease arrow chart illustrations Currency Devaluation Concept with Stock Market Chart and Green Note
Free with trial A 3D illustration shows a red arrow graph descending sharply over a series of stacked white coins. The coins are arranged in decreasing height, visually representing a financial decline or loss. The composition is set against a clean white background. Decrease arrow chart illustrations A red arrow graph showing a downward trend over stacked white coins on a white background. A 3D illustration shows a red arrow graph descending sharply over a series of stacked white coins. The coins are arranged in decreasing height, visually representing a financial decline or loss. The composition is set against a clean white background
Free with trial Stock market graph with red candlesticks and downward arrow, displayed on a light background. Concept of economic decline. 3D Rendering. Decrease arrow chart illustrations Financial stock market graph with downward trend and arrow on light background. 3D Rendering. Stock market graph with red candlesticks and downward arrow, displayed on a light background. Concept of economic decline. 3D Rendering
Free with trial The image depicts a bar graph on an easel with a prominent red downward arrow overlaying it. The bars in the graph show a decreasing trend from left to right, indicating a decline in values. The background is plain and gray, focusing attention on the graph and the red arrow. Decrease arrow chart illustrations Downward trend in bar graph with a prominent red arrow. The image depicts a bar graph on an easel with a prominent red downward arrow overlaying it. The bars in the graph show a decreasing trend from left to right, indicating a decline in values. The background is plain and gray, focusing attention on the graph and the red arrow
Free with trial The image depicts a red zigzag arrow pointing downwards, indicating a sharp decline or downward trend. The arrow is composed of a series of peaks and troughs, emphasizing the volatility or fluctuations in the decline. Decrease arrow chart illustrations A sharp downward trend represented by a red zigzag arrow. The image depicts a red zigzag arrow pointing downwards, indicating a sharp decline or downward trend. The arrow is composed of a series of peaks and troughs, emphasizing the volatility or fluctuations in the decline
Free with trial Business finance chart illustrating decline. Red arrow points down, indicating loss or recession. Dollar symbol beside bars. Decrease arrow chart vectors Financial graph showing downward trend with dollar sign. Business finance chart illustrating decline. Red arrow points down, indicating loss or recession. Dollar symbol beside bars
Free with trial A 3D rendered image of a solid, light purple arrow pointing directly downwards. The arrow has a smooth, matte finish and is positioned on a plain, light purple background. The lighting creates a subtle shadow beneath the arrow, giving it a sense of depth. Decrease arrow chart illustrations 3D rendered light purple arrow pointing downwards on a plain background direction. A 3D rendered image of a solid, light purple arrow pointing directly downwards. The arrow has a smooth, matte finish and is positioned on a plain, light purple background. The lighting creates a subtle shadow beneath the arrow, giving it a sense of depth
Free with trial A golden icon depicting a downward trending bar graph with a sharp arrow indicating a decline. The graph and arrow are set against a black circular background, which is framed by a polished gold rim. The icon is presented in a 3D perspective on a white background. Decrease arrow chart illustrations Golden Downward Trend Graph Icon with Arrow on Black Circular Background with Gold Rim. A golden icon depicting a downward trending bar graph with a sharp arrow indicating a decline. The graph and arrow are set against a black circular background, which is framed by a polished gold rim. The icon is presented in a 3D perspective on a white background
Free with trial A bold, sketchy arrow rendered in black and white, indicating a downward direction with dynamic lines and shading. Decrease arrow chart illustrations Hand-drawn arrow pointing downwards and to the left with a sketchy, energetic style. A bold, sketchy arrow rendered in black and white, indicating a downward direction with dynamic lines and shading
Free with trial A hand holds a red pen and sketches a downwardpointing arrow on a white paper this represents financial decline, market downturns, or business losses illustrating a concept of economic recession or investment failure , dreamy and soft background gradient. Decrease arrow chart illustrations Hand drawing downward red arrow on white paper using pen for business and finance concepts. a hand holds a red pen and sketches a downwardpointing arrow on a white paper this represents financial decline, market downturns, or business losses illustrating a concept of economic recession or investment failure , dreamy and soft background gradient
Free with trial A dynamic 3D visualization of financial data, featuring an upward trending blue arrow graph, a series of white and blue bar graphs, and two pie charts. The composition is set against a dark blue, grid-like background, symbolizing data analysis, business growth, and financial success. This image is ideal for presentations, reports, and websites related to finance, economics, and market trends. Decrease arrow chart illustrations 3D Financial Growth Chart with Pie Charts and Bar Graph. A dynamic 3D visualization of financial data, featuring an upward trending blue arrow graph, a series of white and blue bar graphs, and two pie charts. The composition is set against a dark blue, grid-like background, symbolizing data analysis, business growth, and financial success. This image is ideal for presentations, reports, and websites related to finance, economics, and market trends.
Free with trial Chart icon and graph for statistic line or bar diagram with growth pie and graphic data. Use for analysis trend and pictogram by profit algorithm report. Business infographic title. Vector. Decrease arrow chart vectors Chart icon and graph for statistic line or bar diagram with growth pie and graphic data. Use for analysis trend and
Free with trial A vibrant 3D arrow with a smooth gradient of pink, yellow, and blue, pointing diagonally downwards on a white background. Decrease arrow chart illustrations Colorful 3d arrow pointing downward with gradient colors. A vibrant 3D arrow with a smooth gradient of pink, yellow, and blue, pointing diagonally downwards on a white background
Free with trial Flat style illustration of going up red arrow icon isolated with background. Decrease arrow chart illustrations Arrow indicated the direction symbol. Red arrow left icon symbol. Flat style illustration of going up red arrow icon isolated with background.
Free with trial Computer monitor displays a declining stock market with a prominent downward arrow, indicating financial losses for investment or trading concepts. Decrease arrow chart illustrations Declining Stock Market Shown on Computer Screen with Downward Arrow. Computer monitor displays a declining stock market with a prominent downward arrow, indicating financial losses for investment or trading concepts
Free with trial Falling arrow financial crisis stock market crash economic downturn business loss dramatic impact risk negative trend, Generative AI. Decrease arrow chart illustrations Falling arrow financial crisis stock market crash economic downturn business loss dramatic impact risk negative trend
Free with trial Japanese Yen Exchange Chart Illustration Falling. Decrease arrow chart illustrations Japanese Yen Exchange Chart Illustration Falling
Free with trial Conceptual illustration showing a stock market crash. Red arrows pointing down against a chart background, symbolizing financial loss, economic downturn, and investment risk. Recession and crisis. Decrease arrow chart illustrations Stock market crash financial crisis recession investment loss economic downturn red arrows downward trend chart. Conceptual illustration showing a stock market crash. Red arrows pointing down against a chart background, symbolizing financial loss, economic downturn, and investment risk. Recession and crisis.
Free with trial Financial chart arrows. Colored trend lines. Market direction indicators. Vector graph elements. EPS 10. Decrease arrow chart vectors Financial chart arrows. Colored trend lines. Market direction indicators. Vector graph elements