Free with trial Red wooden arrow pointing down on yellow background. Business, market decline or economic challenges concept. Flat lay. Top view. Close-up. Decrease arrow chart illustrations Red wooden arrow pointing down on yellow background. Business, market decline or economic
Free with trial Filled outline Financial growth decrease icon isolated on white background. Increasing revenue. Vector. Decrease arrow chart vectors Filled outline Financial growth decrease icon isolated on white background. Increasing revenue. Vector
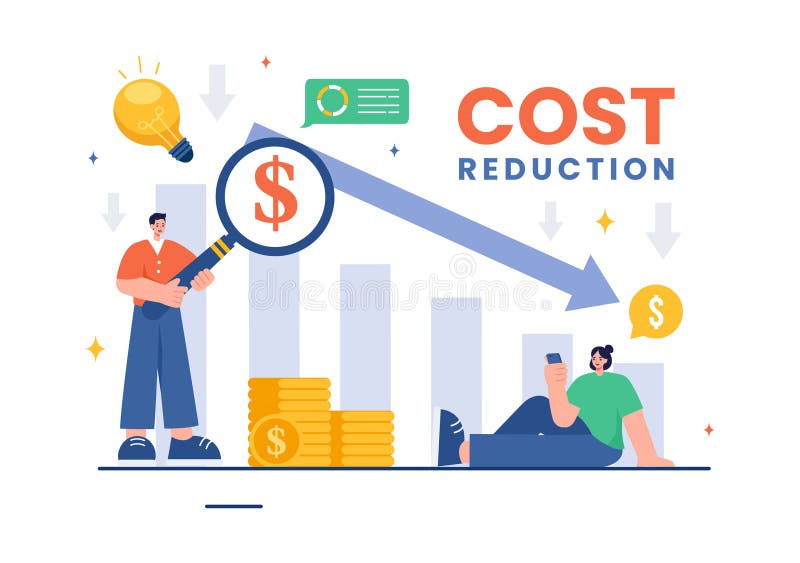
Free with trial Cost Reduction Vector Illustration depicting Decrease, Price Minimization, or Falling Profit Rates in Business, in a Flat Style Cartoon Background. Decrease arrow chart vectors Cost Reduction Vector Illustration depicting Decrease, Price Minimization, or Falling Profit Rates in Business, in a Flat Style
Free with trial Red wooden arrow pointing down on yellow background. Business, market decline or economic challenges concept. Flat lay. Top view. Close-up. Decrease arrow chart illustrations Red wooden arrow pointing down on yellow background. Business, market decline or economic
Free with trial Red wooden arrow pointing down on yellow background. Business, market decline or economic challenges concept. Flat lay. Top view. Close-up. Decrease arrow chart illustrations Red wooden arrow pointing down on yellow background. Business, market decline or economic
Free with trial Red wooden arrow pointing down on yellow background. Business, market decline or economic challenges concept. Flat lay. Top view. Close-up. Decrease arrow chart illustrations Red wooden arrow pointing down on yellow background. Business, market decline or economic
Free with trial Red wooden arrow pointing down on yellow background. Business, market decline or economic challenges concept. Flat lay. Top view. Close-up. Decrease arrow chart illustrations Red wooden arrow pointing down on yellow background. Business, market decline or economic
Free with trial Red wooden arrow pointing down on yellow background. Business, market decline or economic challenges concept. Flat lay. Top view. Close-up. Decrease arrow chart illustrations Red wooden arrow pointing down on yellow background. Business, market decline or economic
Free with trial Set Isometric Falling property prices, Drop crude oil, Global economic crisis and Dollar rate decrease icon. Vector. Decrease arrow chart vectors Set Isometric Falling property prices, Drop crude oil, Global economic crisis and Dollar rate decrease icon. Vector
Free with trial Red wooden arrow points downwards on black background. Image suggests market decline economic crisis. Closeup view shows details of arrow. Potential themes include business loss. Decrease arrow chart illustrations Red wooden arrow points downwards on black background. Image suggests market decline economic crisis. Closeup view shows details
Free with trial Cost reduction chart displayed on a mobile phone held by a person in a suit shows a downward trend representing financial analysis business strategy and investment planning for economic forecasting d. Decrease arrow chart illustrations Cost reduction chart financial analysis business strategy investment planning market trend economic forecast data. Cost reduction chart displayed on a mobile phone held by a person in a suit shows a downward trend representing financial analysis business strategy and investment planning for economic forecasting d
Free with trial Cost reduction chart displayed on a mobile device held by a hand shows a declining trend representing financial analysis business strategy and investment planning indicating potential market downturn. Decrease arrow chart illustrations Cost reduction chart financial analysis business strategy investment planning market trend economic forecast data. Cost reduction chart displayed on a mobile device held by a hand shows a declining trend representing financial analysis business strategy and investment planning indicating potential market downturn
Free with trial White wooden arrow pointing down on black background. Business, market decline or economic. Close-up. Decrease arrow chart illustrations White wooden arrow pointing down on black background. Business, market decline or economic
Free with trial Trend to go down chart line icon, world sanction concept. Vector graphics. Dollar currency graph, market pressure sign on white background, style mobile or design. Decrease arrow chart vectors Trend to go down chart line icon, world sanction concept. Vector graphics. Dollar currency graph, market pressure sign
Free with trial Trend to go down chart thin line icon, world sanction concept. Vector graphics. Dollar currency graph, market pressure sign on white background, style mobile or design. Decrease arrow chart vectors Trend to go down chart thin line icon, world sanction concept. Vector graphics. Dollar currency graph, market pressure
Free with trial White wooden arrow pointing down on yellow background. Business, market decline or economic. Close-up. Decrease arrow chart illustrations White wooden arrow pointing down on yellow background. Business, market decline or economic
Free with trial White wooden arrow pointing down on yellow background. Business, market decline or economic. Close-up. Decrease arrow chart illustrations White wooden arrow pointing down on yellow background. Business, market decline or economic
Free with trial White wooden arrow pointing down on yellow background. Business, market decline or economic. Close-up. Decrease arrow chart illustrations White wooden arrow pointing down on yellow background. Business, market decline or economic
Free with trial White wooden arrow pointing down on yellow background. Business, market decline or economic. Close-up. Decrease arrow chart illustrations White wooden arrow pointing down on yellow background. Business, market decline or economic
Free with trial Flat Design Illustration of NPL Risk Analysis with Declining Bar Chart, Highlighting Financial Trends and Risks. Ideal. Decrease arrow chart illustrations Flat Design Illustration of NPL Risk Analysis with Declining Bar Chart, Highlighting Financial Trends and Risks. Ideal
Free with trial Set Dollar rate decrease, Drop in crude oil price, Debt ball chained to coin and icon. Vector. Decrease arrow chart vectors Set Dollar rate decrease, Drop in crude oil price, Debt ball chained to coin and icon. Vector
Free with trial Set line Pie chart infographic Global economic crisis and Drop crude oil price icon. Vector. Decrease arrow chart vectors Set line Pie chart infographic, Global economic crisis and Drop crude oil price icon. Vector
Free with trial Colorful Financial growth decrease icon isolated on white background. Increasing revenue. Minimalism concept. 3D render illustration. Decrease arrow chart illustrations Colorful Financial growth decrease icon isolated on white background. Increasing revenue. Minimalism concept. 3D render
Free with trial Glowing neon line Financial growth decrease icon isolated on black background. Increasing revenue. Vector. Decrease arrow chart illustrations Glowing neon line Financial growth decrease icon isolated on black background. Increasing revenue. Vector
Free with trial Glowing neon line Financial growth decrease icon isolated on black background. Increasing revenue. Vector. Decrease arrow chart vectors Glowing neon line Financial growth decrease icon isolated on black background. Increasing revenue. Vector
Free with trial A businessman holds a coin, runs on stack of money bar chart with green graph up. Extend investment in Bull Economy, economic success, financial management, capital market performance, and profit. Decrease arrow chart vectors A businessman holds a coin, runs on stack of money bar chart with green graph up. Extend investment in Bull Economy, economic
Free with trial Set line Dollar rate decrease Global economic crisis and Drop in crude oil price icon. Vector. Decrease arrow chart illustrations Set line Dollar rate decrease, Global economic crisis and Drop in crude oil price icon. Vector
Free with trial Black Financial growth decrease icon isolated on yellow background. Increasing revenue. Warning sign. Vector. Decrease arrow chart vectors Black Financial growth decrease icon isolated on yellow background. Increasing revenue. Warning sign. Vector
Free with trial Animation with values of currency exchange rate chart. Motion. Moving stylish chart of bank currencies on stock exchange. Chart with currency values and changing line indicators. Decrease arrow chart illustrations Animation with values of currency exchange rate chart. Motion. Moving stylish chart of bank currencies on stock exchange
Free with trial A glowing red zigzag arrow points downward, representing a decline on a digital financial chart. The surface is gridded and dark, highlighting the red of the arrow. The arrow has a neon-like appearance and reflects off the glossy surface, signaling a decrease in value. The surrounding chart includes descending graphical elements indicating fluctuating data, conveying a downturn in financial performance or market trends. Decrease arrow chart illustrations A large red arrow points downwards over a gridded financial chart showing a sharp decline in value. A glowing red zigzag arrow points downward, representing a decline on a digital financial chart. The surface is gridded and dark, highlighting the red of the arrow. The arrow has a neon-like appearance and reflects off the glossy surface, signaling a decrease in value. The surrounding chart includes descending graphical elements indicating fluctuating data, conveying a downturn in financial performance or market trends.
Free with trial A glowing red zigzag arrow points downward, representing a decline on a digital financial chart. The surface is gridded and dark, highlighting the red of the arrow. The arrow has a neon-like appearance and reflects off the glossy surface, signaling a decrease in value. The surrounding chart includes descending graphical elements indicating fluctuating data, conveying a downturn in financial performance or market trends. Decrease arrow chart illustrations A large red arrow points downwards over a gridded financial chart showing a sharp decline in value. A glowing red zigzag arrow points downward, representing a decline on a digital financial chart. The surface is gridded and dark, highlighting the red of the arrow. The arrow has a neon-like appearance and reflects off the glossy surface, signaling a decrease in value. The surrounding chart includes descending graphical elements indicating fluctuating data, conveying a downturn in financial performance or market trends.
Free with trial Set line Financial growth decrease icon isolated on white background. Increasing revenue. Vector. Decrease arrow chart illustrations Set line Financial growth decrease icon isolated on white background. Increasing revenue. Vector
Free with trial A glowing red zigzag arrow points downward, representing a decline on a digital financial chart. The surface is gridded and dark, highlighting the red of the arrow. The arrow has a neon-like appearance and reflects off the glossy surface, signaling a decrease in value. The surrounding chart includes descending graphical elements indicating fluctuating data, conveying a downturn in financial performance or market trends. Decrease arrow chart illustrations A large red arrow points downwards over a gridded financial chart showing a sharp decline in value. A glowing red zigzag arrow points downward, representing a decline on a digital financial chart. The surface is gridded and dark, highlighting the red of the arrow. The arrow has a neon-like appearance and reflects off the glossy surface, signaling a decrease in value. The surrounding chart includes descending graphical elements indicating fluctuating data, conveying a downturn in financial performance or market trends.
Free with trial A glowing red zigzag arrow points downward, representing a decline on a digital financial chart. The surface is gridded and dark, highlighting the red of the arrow. The arrow has a neon-like appearance and reflects off the glossy surface, signaling a decrease in value. The surrounding chart includes descending graphical elements indicating fluctuating data, conveying a downturn in financial performance or market trends. Decrease arrow chart illustrations A large red arrow points downwards over a gridded financial chart showing a sharp decline in value. A glowing red zigzag arrow points downward, representing a decline on a digital financial chart. The surface is gridded and dark, highlighting the red of the arrow. The arrow has a neon-like appearance and reflects off the glossy surface, signaling a decrease in value. The surrounding chart includes descending graphical elements indicating fluctuating data, conveying a downturn in financial performance or market trends.
Free with trial A glowing red zigzag arrow points downward, representing a decline on a digital financial chart. The surface is gridded and dark, highlighting the red of the arrow. The arrow has a neon-like appearance and reflects off the glossy surface, signaling a decrease in value. The surrounding chart includes descending graphical elements indicating fluctuating data, conveying a downturn in financial performance or market trends. Decrease arrow chart illustrations A large red arrow points downwards over a gridded financial chart showing a sharp decline in value. A glowing red zigzag arrow points downward, representing a decline on a digital financial chart. The surface is gridded and dark, highlighting the red of the arrow. The arrow has a neon-like appearance and reflects off the glossy surface, signaling a decrease in value. The surrounding chart includes descending graphical elements indicating fluctuating data, conveying a downturn in financial performance or market trends.
Free with trial Set line Dollar rate decrease, , Drop in crude oil price and Glass money jar with coin icon. Vector. Decrease arrow chart illustrations Set line Dollar rate decrease, , Drop in crude oil price and Glass money jar with coin icon. Vector
Free with trial White line Financial growth decrease icon isolated on blue background. Increasing revenue. Vector. Decrease arrow chart vectors White line Financial growth decrease icon isolated on blue background. Increasing revenue. Vector
Free with trial A businessman holds banknotes, runs on stack of money bar chart with green graph up. Extend investment in Bull Economy, economic success, financial management, capital market performance, and profit. Decrease arrow chart vectors A businessman holds banknotes, runs on stack of money bar chart with green graph up. Extend investment in Bull Economy, economic
Free with trial Set line Financial growth decrease icon isolated on white background. Increasing revenue. Set icons colorful. Vector. Decrease arrow chart vectors Set line Financial growth decrease icon isolated on white background. Increasing revenue. Set icons colorful. Vector
Free with trial Set line Financial growth decrease icon isolated on white background. Increasing revenue. Set icons colorful. Vector. Decrease arrow chart vectors Set line Financial growth decrease icon isolated on white background. Increasing revenue. Set icons colorful. Vector
Free with trial Red arrow pointing downward on a financial spreadsheet, magnifying glass focusing on economic decline. Concept for recession, market crash, business loss, and negative financial trends. Decrease arrow chart illustrations Red arrow pointing downward on a financial spreadsheet, magnifying glass focusing on economic decline.
Free with trial Red arrow pointing downward on a financial spreadsheet, magnifying glass focusing on economic decline. Concept for recession, market crash, business loss, and negative financial trends. Decrease arrow chart illustrations Red arrow pointing downward on a financial spreadsheet, magnifying glass focusing on economic decline.
Free with trial Red arrow pointing downward on a financial spreadsheet, magnifying glass focusing on economic decline. Concept for recession, market crash, business loss, and negative financial trends. Decrease arrow chart illustrations Red arrow pointing downward on a financial spreadsheet, magnifying glass focusing on economic decline.
Free with trial Red arrow pointing downward on a financial spreadsheet, magnifying glass focusing on economic decline. Concept for recession, market crash, business loss, and negative financial trends. Decrease arrow chart illustrations Red arrow pointing downward on a financial spreadsheet, magnifying glass focusing on economic decline.
Free with trial Red arrow pointing downward on a financial spreadsheet, magnifying glass focusing on economic decline. Concept for recession, market crash, business loss, and negative financial trends. Decrease arrow chart illustrations Red arrow pointing downward on a financial spreadsheet, magnifying glass focusing on economic decline.
Free with trial Red arrow pointing downward on a financial spreadsheet, magnifying glass focusing on economic decline. Concept for recession, market crash, business loss, and negative financial trends. Decrease arrow chart illustrations Red arrow pointing downward on a financial spreadsheet, magnifying glass focusing on economic decline.
Free with trial Red arrow pointing downward on a financial spreadsheet, magnifying glass focusing on economic decline. Concept for recession, market crash, business loss, and negative financial trends. Decrease arrow chart illustrations Red arrow pointing downward on a financial spreadsheet, magnifying glass focusing on economic decline.
Free with trial Red arrow pointing downward on a financial spreadsheet, magnifying glass focusing on economic decline. Concept for recession, market crash, business loss, and negative financial trends. Decrease arrow chart illustrations Red arrow pointing downward on a financial spreadsheet, magnifying glass focusing on economic decline.
Free with trial Red arrow pointing downward on a financial spreadsheet, magnifying glass focusing on economic decline. Concept for recession, market crash, business loss, and negative financial trends. Decrease arrow chart illustrations Red arrow pointing downward on a financial spreadsheet, magnifying glass focusing on economic decline.
Free with trial Red arrow pointing downward on a financial spreadsheet, magnifying glass focusing on economic decline. Concept for recession, market crash, business loss, and negative financial trends. Decrease arrow chart illustrations Red arrow pointing downward on a financial spreadsheet, magnifying glass focusing on economic decline.
Free with trial Colorful Financial growth decrease icon isolated on white background. Increasing revenue. Circle button. 3D render illustration. Decrease arrow chart illustrations Colorful Financial growth decrease icon isolated on white background. Increasing revenue. Circle button. 3D render
Free with trial Filled outline Financial growth decrease icon isolated on blue background. Increasing revenue. Vector. Decrease arrow chart vectors Filled outline Financial growth decrease icon isolated on blue background. Increasing revenue. Vector
Free with trial Filled outline Financial growth decrease icon isolated on blue background. Increasing revenue. Vector. Decrease arrow chart illustrations Filled outline Financial growth decrease icon isolated on blue background. Increasing revenue. Vector
Free with trial Set line Digital speed meter Arrow Financial growth Dollar symbol Mountains with flag and Intersection point icon. Vector. Decrease arrow chart vectors Set line Digital speed meter, Arrow, Financial growth, Dollar symbol, Mountains with flag, and Intersection point icon
Free with trial Glowing neon Financial growth decrease icon isolated on brick wall background. Increasing revenue. Vector. Decrease arrow chart vectors Glowing neon Financial growth decrease icon isolated on brick wall background. Increasing revenue. Vector
Free with trial Colorful Financial growth decrease icon isolated on white background. Increasing revenue. Minimalism concept. 3D render illustration. Decrease arrow chart illustrations Colorful Financial growth decrease icon isolated on white background. Increasing revenue. Minimalism concept. 3D render
Free with trial Illustrates a stock market crash with declining graphs and red arrows. Represents economic downturn, financial crisis, and recession. Symbolizes loss, risk, and negative trends in business. Decrease arrow chart illustrations Stock market crash financial crisis recession economic downturn red arrow graph chart diagram decline 2024. Illustrates a stock market crash with declining graphs and red arrows. Represents economic downturn, financial crisis, and recession. Symbolizes loss, risk, and negative trends in business.
Free with trial Reduction chart icon isolated on white background. Eps 10. Decrease arrow chart vectors Reduction Chart Icon Set. Downward graph vector symbol in a black filled and outlined style. Decline Trend Sign. Reduction chart icon isolated on white background. Eps 10
Free with trial Businessman lifting up percentage sign. concept of Inflation or interest rate falling down, decrease, profit fall in economic recession. Decrease arrow chart vectors Businessman lifting up percentage sign. concept of Inflation or interest rate falling down, decrease, profit fall in economic
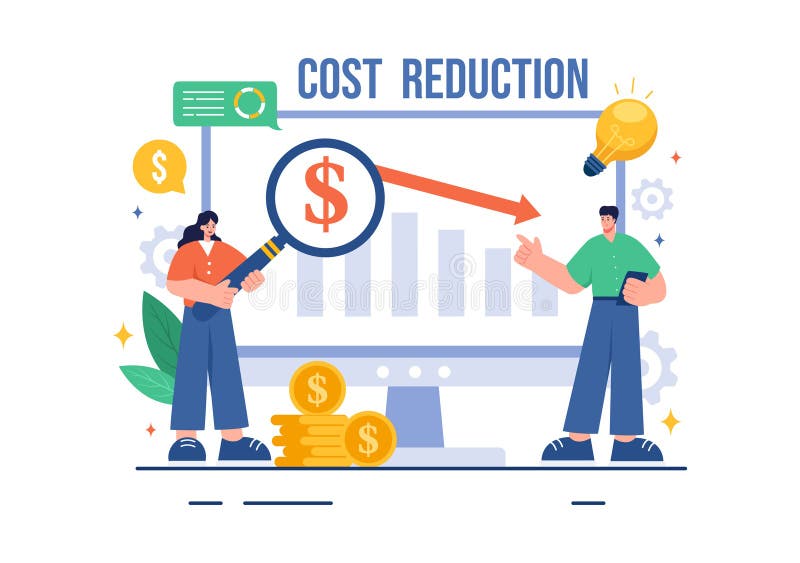
Free with trial Cost Reduction Vector Illustration depicting Decrease, Price Minimization, or Falling Profit Rates in Business, in a Flat Style Cartoon Background. Decrease arrow chart vectors Cost Reduction Vector Illustration depicting Decrease, Price Minimization, or Falling Profit Rates in Business, in a Flat Style
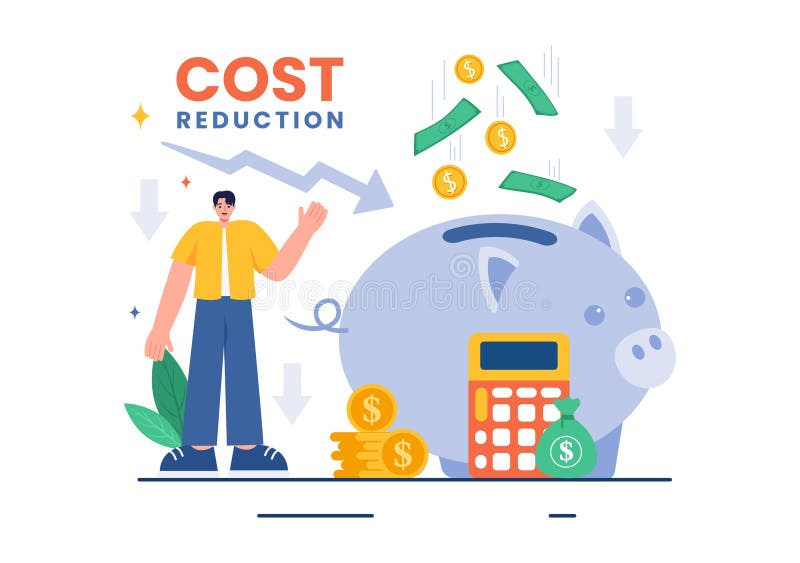
Free with trial Cost Reduction Vector Illustration depicting Decrease, Price Minimization, or Falling Profit Rates in Business, in a Flat Style Cartoon Background. Decrease arrow chart vectors Cost Reduction Vector Illustration depicting Decrease, Price Minimization, or Falling Profit Rates in Business, in a Flat Style
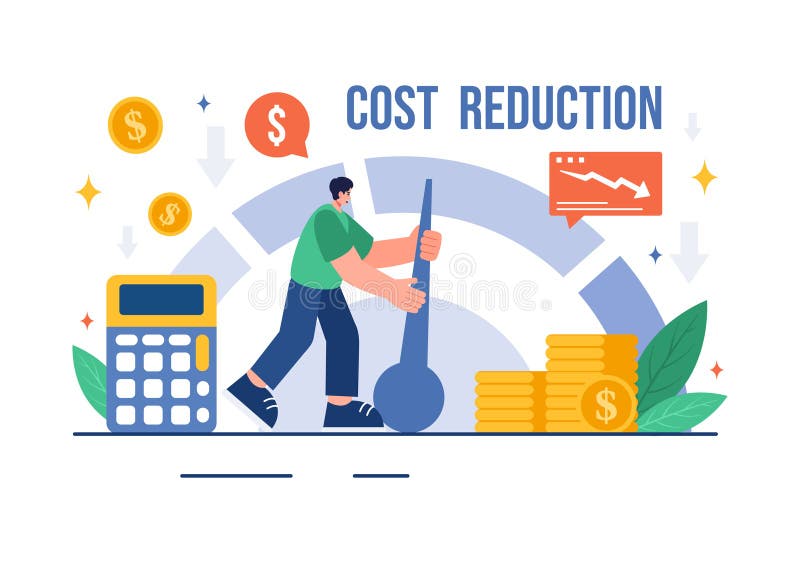
Free with trial Cost Reduction Vector Illustration depicting Decrease, Price Minimization, or Falling Profit Rates in Business, in a Flat Style Cartoon Background. Decrease arrow chart vectors Cost Reduction Vector Illustration depicting Decrease, Price Minimization, or Falling Profit Rates in Business, in a Flat Style
Free with trial Cost Reduction Vector Illustration depicting Decrease, Price Minimization, or Falling Profit Rates in Business, in a Flat Style Cartoon Background. Decrease arrow chart vectors Cost Reduction Vector Illustration depicting Decrease, Price Minimization, or Falling Profit Rates in Business, in a Flat Style
Free with trial Cost Reduction Vector Illustration depicting Decrease, Price Minimization, or Falling Profit Rates in Business, in a Flat Style Cartoon Background. Decrease arrow chart vectors Cost Reduction Vector Illustration depicting Decrease, Price Minimization, or Falling Profit Rates in Business, in a Flat Style
Free with trial Cost Reduction Vector Illustration depicting Decrease, Price Minimization, or Falling Profit Rates in Business, in a Flat Style Cartoon Background. Decrease arrow chart vectors Cost Reduction Vector Illustration depicting Decrease, Price Minimization, or Falling Profit Rates in Business, in a Flat Style
Free with trial Cost Reduction Vector Illustration depicting Decrease, Price Minimization, or Falling Profit Rates in Business, in a Flat Style Cartoon Background. Decrease arrow chart vectors Cost Reduction Vector Illustration depicting Decrease, Price Minimization, or Falling Profit Rates in Business, in a Flat Style
Free with trial Cost Reduction Vector Illustration depicting Decrease, Price Minimization, or Falling Profit Rates in Business, in a Flat Style Cartoon Background. Decrease arrow chart vectors Cost Reduction Vector Illustration depicting Decrease, Price Minimization, or Falling Profit Rates in Business, in a Flat Style
Free with trial Cost Reduction Vector Illustration depicting Decrease, Price Minimization, or Falling Profit Rates in Business, in a Flat Style Cartoon Background. Decrease arrow chart vectors Cost Reduction Vector Illustration depicting Decrease, Price Minimization, or Falling Profit Rates in Business, in a Flat Style
Free with trial Cost Reduction Vector Illustration depicting Decrease, Price Minimization, or Falling Profit Rates in Business, in a Flat Style Cartoon Background. Decrease arrow chart vectors Cost Reduction Vector Illustration depicting Decrease, Price Minimization, or Falling Profit Rates in Business, in a Flat Style
Free with trial Cost Reduction Vector Illustration depicting Decrease, Price Minimization, or Falling Profit Rates in Business, in a Flat Style Cartoon Background. Decrease arrow chart vectors Cost Reduction Vector Illustration depicting Decrease, Price Minimization, or Falling Profit Rates in Business, in a Flat Style
Free with trial Cost Reduction Vector Illustration depicting Decrease, Price Minimization, or Falling Profit Rates in Business, in a Flat Style Cartoon Background. Decrease arrow chart vectors Cost Reduction Vector Illustration depicting Decrease, Price Minimization, or Falling Profit Rates in Business, in a Flat Style
Free with trial Visualizing stock market decline and economic recession with a red chart and downward arrows, showing financial loss and investment risk in a dark background. A sign of economic downturn. Decrease arrow chart illustrations Stock market crash recession financial crisis investment loss economic downturn chart analysis data fall 2024. visualizing stock market decline and economic recession with a red chart and downward arrows, showing financial loss and investment risk in a dark background. A sign of economic downturn.
Free with trial Decline prices in 2024. Falling chart. Graph drop. Reduction money. Lower finance. Vector illustration flat design. Isolated on white background. Decrease arrow chart vectors Decline prices in 2024. Falling chart. Graph drop. Reduction money.
Free with trial Concept of economic collapse by falling graph, chart, highlighting global recession fueled by inflation, stock market crash, financial crisis, falling income, GDP decline, capital reduction. Decrease arrow chart illustrations Concept of economic collapse by falling graph, chart, highlighting global recession fueled by inflation, stock market crash
Free with trial Green up and red down 3d arrow graph showing rising, descending trend, business result, profit or loss symbol symbol. Business arrow, goals concept. 3d world money symbols. Financial growth vector isolated. Decrease arrow chart vectors Green up and red down 3d arrow graph showing rising, descending trend, business result, profit. world money symbols. Green up and red down 3d arrow graph showing rising, descending trend, business result, profit or loss symbol symbol. Business arrow, goals concept. 3d world money symbols. Financial growth vector isolated
Free with trial Green up and red down 3d arrow graph showing rising, descending trend, business result, profit or loss symbol symbol. Business arrow, goals concept. 3d world money symbols. Financial growth vector isolated. Decrease arrow chart vectors Green up and red down 3d arrow graph showing rising, descending trend, business result, profit. world money symbols. Green up and red down 3d arrow graph showing rising, descending trend, business result, profit or loss symbol symbol. Business arrow, goals concept. 3d world money symbols. Financial growth vector isolated
Free with trial Green up and red down 3d arrow graph showing rising, descending trend, business result, profit or loss symbol symbol. Business arrow, goals concept. 3d world money symbols. Financial growth vector isolated. Decrease arrow chart vectors Green up and red down 3d arrow graph showing rising, descending trend, business result, profit. world money symbols. Green up and red down 3d arrow graph showing rising, descending trend, business result, profit or loss symbol symbol. Business arrow, goals concept. 3d world money symbols. Financial growth vector isolated
Free with trial Green up and red down 3d arrow graph showing rising, descending trend, business result, profit or loss symbol symbol. Business arrow, goals concept. 3d world money symbols. Financial growth vector isolated. Decrease arrow chart vectors Green up and red down 3d arrow graph showing rising, descending trend, business result, profit. world money symbols. Green up and red down 3d arrow graph. Green up and red down 3d arrow graph showing rising, descending trend, business result, profit or loss symbol symbol. Business arrow, goals concept. 3d world money symbols. Financial growth vector isolated
Free with trial Green up and red down 3d arrow graph showing rising, descending trend, business result, profit or loss symbol symbol. Business arrow, goals concept. 3d world money symbols. Financial growth vector isolated. Decrease arrow chart vectors Green up and red down 3d arrow graph showing rising, descending trend, business result, profit. world money symbols. Green up and red down 3d arrow graph showing rising, descending trend, business result, profit or loss symbol symbol. Business arrow, goals concept. 3d world money symbols. Financial growth vector isolated
Free with trial Green up and red down 3d arrow graph showing rising, descending trend, business result, profit or loss symbol symbol. Business arrow, goals concept. 3d world money symbols. Financial growth vector isolated. Decrease arrow chart vectors Green up and red down 3d arrow graph showing rising, descending trend, business result, profit. world money symbols. Green up and red down 3d arrow graph showing rising, descending trend, business result, profit or loss symbol symbol. Business arrow, goals concept. 3d world money symbols. Financial growth vector isolated