Free with trial The image shows a rusty, metallic graph depicting a downward trend. the graph is set against a dark, blurred background, possibly an industrial setting, with a reflective surface underneath. the arrow at the end of the graph points downwards, emphasizing the concept of decline or loss. the rust on the metal adds a sense of decay and age, further reinforcing the negative connotation. the lighting highlights the graph, making it the focal point of the image. Decrease arrow chart illustrations Rusty decline: a visual representation of loss. the image shows a rusty, metallic graph depicting a downward trend. the graph is set against a dark, blurred background, possibly an industrial setting, with a reflective surface underneath. the arrow at the end of the graph points downwards, emphasizing the concept of decline or loss. the rust on the metal adds a sense of decay and age, further reinforcing the negative connotation. the lighting highlights the graph, making it the focal point of the image.
Free with trial A minimalist icon illustrating the concept of a housing market downturn. Decrease arrow chart vectors Property Value Decrease Graphic Icon. A minimalist icon illustrating the concept of a housing market downturn
Free with trial A colorful bar graph with a downward trend, showing a decrease in values from left to right, with a large orange arrow pointing downwards. Decrease arrow chart illustrations A colorful bar graph with a downward trend
Free with trial The image displays a financial trend chart superimposed on a modern office setting. the chart depicts a declining trend, indicated by a downward-sloping line with an arrow pointing downwards. the background features a blurred office environment with windows, a plant, and furniture, creating a sense of realism and context for the financial data. the overall composition suggests a reflection or projection of financial performance within a contemporary workspace. Decrease arrow chart illustrations Financial decline chart in modern office space. the image displays a financial trend chart superimposed on a modern office setting. the chart depicts a declining trend, indicated by a downward-sloping line with an arrow pointing downwards. the background features a blurred office environment with windows, a plant, and furniture, creating a sense of realism and context for the financial data. the overall composition suggests a reflection or projection of financial performance within a contemporary workspace.
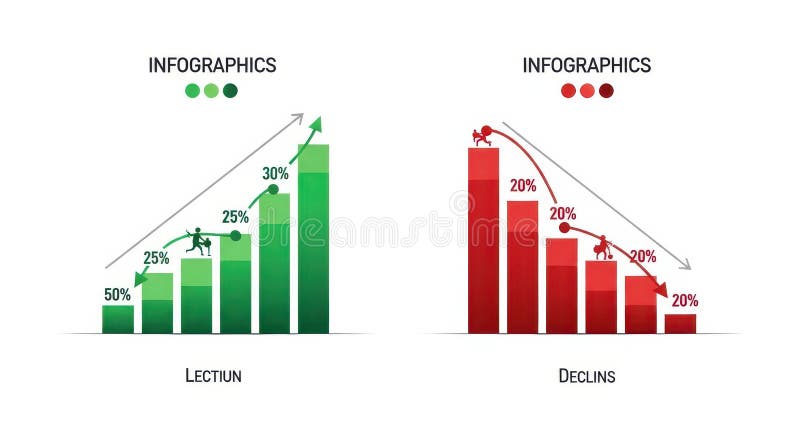
Free with trial The image displays two infographics side by side. the left infographic, titled "lection," depicts a green bar graph showing growth, starting at 50% and increasing to 30% with a figure climbing the bars. an upward-pointing arrow indicates positive growth. the right infographic, titled "declins," shows a red bar graph illustrating decline, starting at 20% and decreasing to 20% with a figure falling down the bars. a downward-pointing arrow indicates negative growth. Decrease arrow chart illustrations Infographics showing growth and decline charts. the image displays two infographics side by side. the left infographic, titled "lection," depicts a green bar graph showing growth, starting at 50% and increasing to 30% with a figure climbing the bars. an upward-pointing arrow indicates positive growth. the right infographic, titled "declins," shows a red bar graph illustrating decline, starting at 20% and decreasing to 20% with a figure falling down the bars. a downward-pointing arrow indicates negative growth.
Free with trial A conceptual image representing financial loss, economic downturn, or business failure. A person's hands are holding and seemingly guiding a glowing red line graph that is pointing sharply downwards. The arrow at the end confirms the negative trend. The neutral background keeps the focus on this clear symbol of decline. Generative AI. Decrease arrow chart illustrations Two hands holding a glowing red line graph that is trending downwards. A conceptual image representing financial loss, economic downturn, or business failure. A person's hands are holding and seemingly guiding a glowing red line graph that is pointing sharply downwards. The arrow at the end confirms the negative trend. The neutral background keeps the focus on this clear symbol of decline. Generative AI.
Free with trial A visual representation of contrasting directions using prominent green and red arrows, symbolizing growth and decline, increase and decrease, essential for data and trend analysis. Decrease arrow chart illustrations Green and red arrows facing each other on isolated on white background. A visual representation of contrasting directions using prominent green and red arrows, symbolizing growth and decline, increase and decrease, essential for data and trend analysis
Free with trial A red line graph with data points illustrating a downward trend over time, suggesting a decrease in measured values. Decrease arrow chart illustrations Declining Trend in Data Analysis Representation. a red line graph with data points illustrating a downward trend over time, suggesting a decrease in measured values
Free with trial This infographic shows business data with both an increasing chart with 20% growth and a decreasing chart with 10% decline, which can be used to illustrate business concepts. Decrease arrow chart illustrations Infographic Showing Business Growth and Decline. This infographic shows business data with both an increasing chart with 20% growth and a decreasing chart with 10% decline, which can be used to illustrate business concepts
Free with trial A simple red line graph showing a sharp downward trend, indicating a significant decrease or loss in value, isolated against a clean white background for clarity. Decrease arrow chart illustrations Red downward trending graph isolated on white background. A simple red line graph showing a sharp downward trend, indicating a significant decrease or loss in value, isolated against a clean white background for clarity
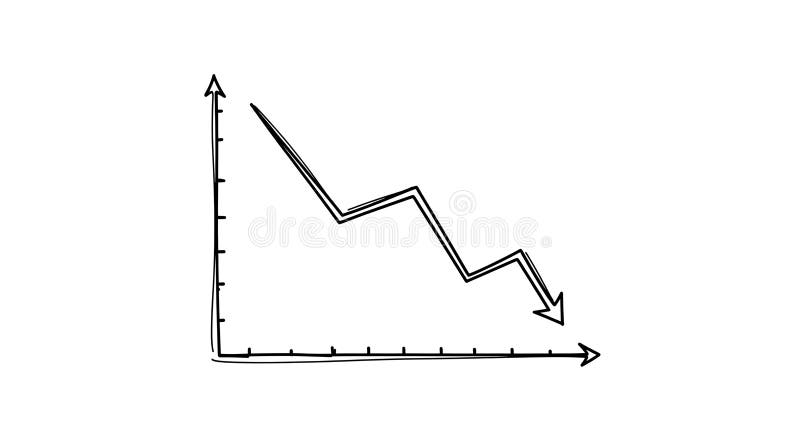
Free with trial Simple hand drawn black and white illustration of a declining graph on a white background, indicating loss, decrease, or economic downturn and representing a negative trend in business or finance. Decrease arrow chart vectors Hand Drawn Declining Graph Illustration on White Background Stock Image. Simple hand drawn black and white illustration of a declining graph on a white background, indicating loss, decrease, or economic downturn and representing a negative trend in business or finance.
Free with trial Illustration displays a black graph showing a downward trend indicated by a graph, arrow, and clock symbol on a stark white background, implying a sense of failure and loss. Decrease arrow chart vectors Black Symbol Graph Downtrend with Time on White Backdrop Shows Decline. Illustration displays a black graph showing a downward trend indicated by a graph, arrow, and clock symbol on a stark white background, implying a sense of failure and loss.
Free with trial A visual representation of opposing forces, illustrating concepts such as growth versus decline, positive versus negative trends, or upward and downward movement in various contexts like finance or pe. Decrease arrow chart illustrations Red down arrow and green up arrow isolated on white background. A visual representation of opposing forces, illustrating concepts such as growth versus decline, positive versus negative trends, or upward and downward movement in various contexts like finance or pe
Free with trial Dramatic red arrow shows oil price drop due to an embargo effect on charts and oil barrels Perfect for financial news and global trade articles. Decrease arrow chart illustrations Illustration of an oil embargo against a backdrop of declining market graphs. Dramatic red arrow shows oil price drop due to an embargo effect on charts and oil barrels Perfect for financial news and global trade articles
Free with trial A line graph illustrates a steady decline in values, featuring a blue line dropping toward a bright red arrow indicating a significant downward trend over time. Decrease arrow chart illustrations Declining trend in data representation shows significant decrease over time. A line graph illustrates a steady decline in values, featuring a blue line dropping toward a bright red arrow indicating a significant downward trend over time.
Free with trial An icon representing financial downturn, featuring a stack of coins and a line graph with a downward arrow, indicating a decrease in value or performance. This visual signifies economic hardship or in. Decrease arrow chart vectors Graph showing financial decline with coins isolated on transparent background. An icon representing financial downturn, featuring a stack of coins and a line graph with a downward arrow, indicating a decrease in value or performance. This visual signifies economic hardship or in
Free with trial Large red falling stock chart on screen in modern conference room with cityscape background, symbolizing business crash and financial collapse. 3D Rendering. Decrease arrow chart illustrations Red downward stock market graph on large screen in modern corporate office meeting room with city view, symbolizing global. Large red falling stock chart on screen in modern conference room with cityscape background, symbolizing business crash and financial collapse. 3D Rendering
Free with trial A clean, minimalist icon depicting upward and downward arrows. Perfect for representing upload download, increase decrease, or input output in digital interfaces. Decrease arrow chart vectors Double Sided Up and Down Direction Icon. A clean, minimalist icon depicting upward and downward arrows. Perfect for representing upload download, increase decrease, or input output in digital interfaces
Free with trial Four black arrows, all pointing downwards, are evenly spaced and aligned diagonally across a white background. Each arrow consists of a long, straight shaft and a triangular arrowhead. The simplistic and bold design suggests movement or direction. Decrease arrow chart vectors The four black arrows directed down isolated on white background. Four black arrows, all pointing downwards, are evenly spaced and aligned diagonally across a white background. Each arrow consists of a long, straight shaft and a triangular arrowhead. The simplistic and bold design suggests movement or direction.
Free with trial This image shows two bar graphs. One shows an upward trend with an arrow pointing up. The other shows a downward trend with an arrow pointing down. Black and white. Decrease arrow chart illustrations Black and white illustration showing upward and downward trending bar graphs with arrows pointing up down. This image shows two bar graphs. One shows an upward trend with an arrow pointing up. The other shows a downward trend with an arrow pointing down. Black and white.
Free with trial Graphic element displays contrasting financial indicators featuring a jagged green arrow pointing up signifying growth alongside a similar red arrow pointing sharply down representing decline or market correction. Decrease arrow chart vectors Graphic representation contrasting upward trending market growth with sharp downward trending financial decline. Graphic element displays contrasting financial indicators featuring a jagged green arrow pointing up signifying growth alongside a similar red arrow pointing sharply down representing decline or market correction
Free with trial A vibrant image featuring a thick, textured green arrow pointing upwards, symbolizing growth, success, and progress. Contrasting this, a bold red arrow points downwards, representing decline, loss, and failure. Both arrows are rendered with a painterly style, suggesting a hand-drawn or artistic representation of financial or market trends. The clean white background isolates the arrows, emphasizing their symbolic meaning. This visual is ideal for illustrating concepts like stock market fluctuations, business performance, positive and negative trends, or decision-making. Decrease arrow chart illustrations Up and Down Arrows: Growth vs. Decline. A vibrant image featuring a thick, textured green arrow pointing upwards, symbolizing growth, success, and progress. Contrasting this, a bold red arrow points downwards, representing decline, loss, and failure. Both arrows are rendered with a painterly style, suggesting a hand-drawn or artistic representation of financial or market trends. The clean white background isolates the arrows, emphasizing their symbolic meaning. This visual is ideal for illustrating concepts like stock market fluctuations, business performance, positive and negative trends, or decision-making.
Free with trial A 3D rendered image depicts a teal bar graph with a sharply downward trending red arrow. Gold coins with dollar signs are scattered around the graph, some appearing to fall. A large gold dollar sign rests near the base of the graph. The background is a blurred cityscape at night. The overall mood is one of financial downturn or crisis. The style is realistic 3D rendering with a focus on metallic. Decrease arrow chart illustrations 3 D Render Falling Stock Market Graph Teal Red Gold Coins. A 3D rendered image depicts a teal bar graph with a sharply downward trending red arrow. Gold coins with dollar signs are scattered around the graph, some appearing to fall. A large gold dollar sign rests near the base of the graph. The background is a blurred cityscape at night. The overall mood is one of financial downturn or crisis. The style is realistic 3D rendering with a focus on metallic
Free with trial A glowing neon blue line graph depicts a steep downward trend with an arrow indicating a significant fall. Decrease arrow chart illustrations Neon blue graph illustrating a sharp decline and downward trend on a dark background. A glowing neon blue line graph depicts a steep downward trend with an arrow indicating a significant fall
Free with trial Dollar icon crossed out with arrow moving away from a digital dashboard featuring charts, graphs, and media content. Ideal for finance, budget management, loss analysis, expense tracking, resource. Decrease arrow chart vectors Money flowing away from online analytics dashboard indicating financial loss or expense tracking. Dollar icon crossed out with arrow moving away from a digital dashboard featuring charts, graphs, and media content. Ideal for finance, budget management, loss analysis, expense tracking, resource
Free with trial Simple line graph illustrating a negative trend, representing a decrease or decline in data. Perfect for presentations, reports, or website design. Decrease arrow chart vectors Downward Trending Line Graph, Showing Negative Growth or Decline. Simple line graph illustrating a negative trend, representing a decrease or decline in data. Perfect for presentations, reports, or website design.
Free with trial People drive the stock market and that is the theme of this illustration of people on an up and down stock market chart. Decrease arrow chart illustrations People drive the stock market
Free with trial Pointer with downward arrow on the gray mirror background. Eps 10 vector file. Decrease arrow chart vectors Stock Market Crash Red Button. Pointer with downward arrow on the gray mirror background. Eps 10 vector file
Free with trial Illustration depicting a financial downturn, featuring stacks of gold coins, a blue bar graph showing a decline, and a red arrow pointing downwards, all set against a white background. Decrease arrow chart illustrations Financial decline with gold coins and bar graph. Illustration depicting a financial downturn, featuring stacks of gold coins, a blue bar graph showing a decline, and a red arrow pointing downwards, all set against a white background
Free with trial Isolated on transparent background downward arrow made of scattered red blocks. Decrease arrow chart illustrations Graphic illustration showing downward trend with falling blocks design. Isolated on transparent background downward arrow made of scattered red blocks
Free with trial This image represents a financial crisis with a downward trend and a broken surface. Decrease arrow chart illustrations Economic downturn concept with a red graph and a blue arrow pointing down. This image represents a financial crisis with a downward trend and a broken surface
Free with trial This image shows a downward-trending red arrow graph, generated by AI, illustrating a significant decline. The visual representation is clear and effective in communicating a negative trend, potentially in stock prices, sales figures, or other quantifiable data. Decrease arrow chart illustrations Downward Trending Graph. This image shows a downward-trending red arrow graph, generated by AI, illustrating a significant decline. The visual representation is clear and effective in communicating a negative trend, potentially in stock prices, sales figures, or other quantifiable data.
Free with trial Two percentage symbols with one green upward arrow and one red downward arrow isolated on transparent background. Decrease arrow chart illustrations Percentage symbol with upward and downward arrows indicating growth and decline. Two percentage symbols with one green upward arrow and one red downward arrow isolated on transparent background
Free with trial A visual representation of negative financial performance and economic downturn. This graphic depicts a sharp decline, indicating losses and a downward trend in market or business metrics. Decrease arrow chart vectors Red downward trending graph with arrow signifying financial decline and economic recession concept. A visual representation of negative financial performance and economic downturn. This graphic depicts a sharp decline, indicating losses and a downward trend in market or business metrics
Free with trial A set of black icons representing percentage changes, including arrows and circular symbols. The icons depict various concepts such as decrease, increase, and rotation, all incorporating percentage signs. The simple design makes them versatile for use in financial, statistical, or educational materials. Decrease arrow chart illustrations Black percentage icons set. A set of black icons representing percentage changes, including arrows and circular symbols. The icons depict various concepts such as decrease, increase, and rotation, all incorporating percentage signs. The simple design makes them versatile for use in financial, statistical, or educational materials.
Free with trial The image depicts a bar graph with three vertical bars of decreasing height, accompanied by a red downward arrow. The tallest bar is dark blue, the middle bar is light blue, and the shortest bar is light cyan. The red arrow signifies a downward trend or decline in performance or data. Decrease arrow chart illustrations Decline in performance graph. The image depicts a bar graph with three vertical bars of decreasing height, accompanied by a red downward arrow. The tallest bar is dark blue, the middle bar is light blue, and the shortest bar is light cyan. The red arrow signifies a downward trend or decline in performance or data
Free with trial Digital red graph with falling stock price on large screen in bright corporate office, concept of financial crisis and economic collapse, 3D Rendering. Decrease arrow chart illustrations Red downward financial chart on screen in modern office showing market crash, economic recession, and global investment crisis. Digital red graph with falling stock price on large screen in bright corporate office, concept of financial crisis and economic collapse, 3D Rendering
Free with trial Digital red graph with falling stock price on large screen in bright corporate office, concept of financial crisis and economic collapse, 3D Rendering. Decrease arrow chart illustrations Red downward financial chart on screen in modern office showing market crash, economic recession, and global investment crisis. Digital red graph with falling stock price on large screen in bright corporate office, concept of financial crisis and economic collapse, 3D Rendering
Free with trial A vibrant and playful collection of hand-drawn financial and business icons. The set includes a bar graph, gold bars, a downward arrow, calculators, a smiley face, and cartoon dollar bills. These icons are perfect for illustrating concepts related to finance, economics, investment, and business growth. The simple and cheerful design makes them ideal for educational materials, presentations, and websites. Decrease arrow chart vectors Finance and Business Icons Set. A vibrant and playful collection of hand-drawn financial and business icons. The set includes a bar graph, gold bars, a downward arrow, calculators, a smiley face, and cartoon dollar bills. These icons are perfect for illustrating concepts related to finance, economics, investment, and business growth. The simple and cheerful design makes them ideal for educational materials, presentations, and websites.
Free with trial This impactful illustration depicts the challenging realities of business downsizing. A digital tablet screen showcases a downward trending graph and decreasing staff icons, visually representing staff reduction and layoffs. The image poignantly conveys concepts of unemployment, financial decline, and economic loss. Ideal for presentations on finance, economy, or discussions surrounding job cuts,. Decrease arrow chart illustrations Business downsizing phase depicted on a digital tablet screen with decreasing staff and arrow. This impactful illustration depicts the challenging realities of business downsizing. A digital tablet screen showcases a downward trending graph and decreasing staff icons, visually representing staff reduction and layoffs. The image poignantly conveys concepts of unemployment, financial decline, and economic loss. Ideal for presentations on finance, economy, or discussions surrounding job cuts,
Free with trial This image represents a decrease in house prices, symbolizing market downturns, economic challenges, and potential investment opportunities in real estate. Decrease arrow chart vectors Vector art of house with downward arrows and dollar sign. This image represents a decrease in house prices, symbolizing market downturns, economic challenges, and potential investment opportunities in real estate
Free with trial This image depicts a financial downturn concept, featuring a candlestick chart with downward-pointing arrows. The dark blue background emphasizes the negative trend and market decline. Perfect for illustrating financial reports, economic analysis, or business presentations about market volatility and investment risks. Decrease arrow chart illustrations Financial Downturn Concept Stock Market Crash with Arrows and Candles on Dark Blue Background. This image depicts a financial downturn concept, featuring a candlestick chart with downward-pointing arrows. The dark blue background emphasizes the negative trend and market decline. Perfect for illustrating financial reports, economic analysis, or business presentations about market volatility and investment risks.
Free with trial This flat vector illustration depicts a rectangular screen displaying a red line graph with a downward pointing arrow. The design uses a clean, minimalist aesthetic with soft pastel background tones and bold outlines. It represents concepts of financial decline, market loss, or negative economic performance in a professional business context. Decrease arrow chart vectors A digital icon showing a red downward trend arrow on a screen. This flat vector illustration depicts a rectangular screen displaying a red line graph with a. This flat vector illustration depicts a rectangular screen displaying a red line graph with a downward pointing arrow. The design uses a clean, minimalist aesthetic with soft pastel background tones and bold outlines. It represents concepts of financial decline, market loss, or negative economic performance in a professional business context
Free with trial A businessman in a suit is pointing at a digital screen displaying a graph. The graph illustrates the concept of quality improvement and cost reduction. An upward-pointing arrow signifies the increas. Decrease arrow chart illustrations Businessman pointing at a graph showing quality improvement and cost reduction on a digital screen. A businessman in a suit is pointing at a digital screen displaying a graph. The graph illustrates the concept of quality improvement and cost reduction. An upward-pointing arrow signifies the increas
Free with trial A set of four black and white icons illustrating volume control. Two icons depict increasing volume with a speaker symbol and an upward arrow alongside a rising bar graph. The other two icons represent decreasing volume with a speaker symbol and a downward arrow next to a falling bar graph. These clean, minimalist graphics are ideal for user interfaces, apps, and digital media. Decrease arrow chart vectors Volume Control Icons: Up and Down. A set of four black and white icons illustrating volume control. Two icons depict increasing volume with a speaker symbol and an upward arrow alongside a rising bar graph. The other two icons represent decreasing volume with a speaker symbol and a downward arrow next to a falling bar graph. These clean, minimalist graphics are ideal for user interfaces, apps, and digital media.
Free with trial A flat design illustration featuring a golden euro coin prominently displayed against a white background. Two gray arrows flank the coin: one pointing upwards, symbolizing growth or increase, and another pointing downwards, representing decline or decrease. This graphic effectively visualizes concepts related to currency fluctuations, financial markets, and economic trends of the Euro. Decrease arrow chart vectors Euro Coin with Up and Down Arrows. A flat design illustration featuring a golden euro coin prominently displayed against a white background. Two gray arrows flank the coin: one pointing upwards, symbolizing growth or increase, and another pointing downwards, representing decline or decrease. This graphic effectively visualizes concepts related to currency fluctuations, financial markets, and economic trends of the Euro.
Free with trial Businessman looking at a stock market chart showing financial crisis and falling profits. Decrease arrow chart illustrations Businessman thinking about business decline and financial loss. Businessman looking at a stock market chart showing financial crisis and falling profits
Free with trial This minimalist graphic illustration features a bold red line chart indicating a significant decline. The visual composition uses a clean white background to emphasize the downward trajectory of the data points. The aesthetic is professional and modern, suitable for business presentations or financial reports. Decrease arrow chart vectors A red line graph showing a downward trend on a white background. This minimalist graphic illustration features a bold red line chart indicating a significant decline. The visual composition uses a clean white background to emphasize the downward trajectory of the data points. The aesthetic is professional and modern, suitable for business presentations or financial reports
Free with trial A grid of black and white icons depicting financial charts with rising and falling trends, magnifying glasses with download arrows, and dollar signs. Decrease arrow chart vectors Collection of black and white icons representing financial charts and data analysis graph bar chart. A grid of black and white icons depicting financial charts with rising and falling trends, magnifying glasses with download arrows, and dollar signs
Free with trial A visual representation of financial data showing a decline in performance, with red bars and arrows indicating a downward trend in the market. Decrease arrow chart illustrations Bar chart with downward trend isolated on white background. A visual representation of financial data showing a decline in performance, with red bars and arrows indicating a downward trend in the market
Free with trial Hand-drawn illustration of a bar graph with bars and a prominent arrow showcasing a downward trend. Concepts of decline, loss, or negative growth in various business and educational settings. Decrease arrow chart vectors Hand-Drawn Decreasing Bar Graph Illustration. hand-drawn illustration of a bar graph with bars and a prominent arrow showcasing a downward trend. Concepts of decline, loss, or negative growth in various business and educational settings
Free with trial A hand is shown placing a wooden block with a downward trending graph and percentage symbol onto a surface. This block is positioned next to four other wooden blocks that spell out the word "COST". The image visually represents the concept of cost reduction or decreasing expenses. Decrease arrow chart illustrations Hand placing wooden block with down arrow and percentage symbol. A hand is shown placing a wooden block with a downward trending graph and percentage symbol onto a surface. This block is positioned next to four other wooden blocks that spell out the word "COST". The image visually represents the concept of cost reduction or decreasing expenses
Free with trial A neon orange graph on a black background shows a sharp decline, symbolizing financial loss or a negative trend. Decrease arrow chart illustrations Neon orange downward trending graph with arrow indicating financial decline on a black background. A neon orange graph on a black background shows a sharp decline, symbolizing financial loss or a negative trend
Free with trial Set of 16 black and white graph icons in a 4x4 grid. Each icon depicts variations of bar charts with upward and downward arrows, suggesting growth or decline. Some include additional elements like magnifying glasses, checkmarks, and data points connected by lines. Icons vary slightly in design, representing different data trends with simple, bold lines on a white background, ideal for business and statistical representation. Decrease arrow chart vectors Graph icon set. Increase and decrease graph icon. Growth icon. Graph chart icons. Icon set. 16 icons. Set of 16 black and white graph icons in a 4x4 grid. Each icon depicts variations of bar charts with upward and downward arrows, suggesting growth or decline. Some include additional elements like magnifying glasses, checkmarks, and data points connected by lines. Icons vary slightly in design, representing different data trends with simple, bold lines on a white background, ideal for business and statistical representation.
Free with trial A single ripe yellow banana is positioned on a white surface. A colorful, downward-trending graph with a zigzag pattern is depicted behind and partially over the banana. The graph transitions from gray to green, yellow, orange, and finally a red arrow pointing downwards, symbolizing a negative trend or decline. Decrease arrow chart illustrations Banana with Downward Trend Graph on White Background fruit food. A single ripe yellow banana is positioned on a white surface. A colorful, downward-trending graph with a zigzag pattern is depicted behind and partially over the banana. The graph transitions from gray to green, yellow, orange, and finally a red arrow pointing downwards, symbolizing a negative trend or decline
Free with trial Illustration depicting india's economy facing a downturn, with a graph showing a downward trend. This image represents a financial crisis, stock market crash, or economic recession in india. 200. Decrease arrow chart illustrations India economy crisis financial market stock market crash recession economic downturn graph chart down 100. illustration depicting india's economy facing a downturn, with a graph showing a downward trend. This image represents a financial crisis, stock market crash, or economic recession in india. 200
Free with trial This minimalist vector illustration depicts a financial chart with a bold red arrow pointing downwards, symbolizing a significant decline or loss. The graphic features clean lines and a simple aesthetic, emphasizing the negative movement of the data points. The stark contrast between the red elements and the plain background makes it an effective visual for concepts related to economic downturns,. Decrease arrow chart vectors A red line graph showing a sharp downward trend on a white background. This minimalist vector illustration depicts a financial chart with a bold red arrow pointing downwards, symbolizing a significant decline or loss. The graphic features clean lines and a simple aesthetic, emphasizing the negative movement of the data points. The stark contrast between the red elements and the plain background makes it an effective visual for concepts related to economic downturns,
Free with trial This minimalist vector illustration depicts a financial chart with a prominent red arrow pointing downwards, symbolizing a significant decline in value or performance. The graphic features clean lines and a simple color palette, emphasizing the negative trend against a neutral backdrop. Below the chart, numerical data points are displayed in a rectangular box, highlighting the extent of the loss. Decrease arrow chart vectors A red line graph showing a sharp downward trend on a white background. This minimalist vector illustration depicts a financial chart with a prominent red arrow pointing downwards, symbolizing a significant decline in value or performance. The graphic features clean lines and a simple color palette, emphasizing the negative trend against a neutral backdrop. Below the chart, numerical data points are displayed in a rectangular box, highlighting the extent of the loss.
Free with trial Confident businesswoman concept. Corporate executive holding a large arrow pointing down. Market decline, performance review, direction change. Vector illustration. Decrease arrow chart vectors Businesswoman. Flat Vector Illustration. Confident businesswoman concept. Corporate executive holding a large arrow pointing down. Market decline, performance review, direction change. Vector illustration.
Free with trial A simple line graph showing a downward trend. The graph features a single black line that starts high on the left and ends low on the right, with a jagged pattern in between. The line ends with a large arrow pointing downwards, emphasizing the decline. The graph is set against a white background with a black border, making it a clear and concise visual representation of a decreasing trend. Decrease arrow chart vectors Downward Trend Graph. A simple line graph showing a downward trend. The graph features a single black line that starts high on the left and ends low on the right, with a jagged pattern in between. The line ends with a large arrow pointing downwards, emphasizing the decline. The graph is set against a white background with a black border, making it a clear and concise visual representation of a decreasing trend.
Free with trial A simple line graph showing a downward trend. The graph features a single black line that starts high on the left and descends to the right, ending in a downward-pointing arrow. The background is white, providing a clean and neutral contrast to the black line. Decrease arrow chart vectors Downward Trend Graph. A simple line graph showing a downward trend. The graph features a single black line that starts high on the left and descends to the right, ending in a downward-pointing arrow. The background is white, providing a clean and neutral contrast to the black line.
Free with trial Visualize financial downturns and market instability with this striking graph. Perfect for presentations on economic challenges, business losses, or strategic planning. Decrease arrow chart vectors Business decline represented by a downward trending graph and arrow. Visualize financial downturns and market instability with this striking graph. Perfect for presentations on economic challenges, business losses, or strategic planning
Free with trial A black and white image of a downward trend, represented by a jagged line with an arrow pointing to the right, set against a white background. Decrease arrow chart vectors A black and white image of a downward trend
Free with trial Simple vector illustration showing upward and downward trend arrows with smooth curves, perfect for financial or business presentations. Decrease arrow chart illustrations Trend arrow showing positive and negative. Simple vector illustration showing upward and downward trend arrows with smooth curves, perfect for financial or business presentations
Free with trial A modern, hand-drawn illustration symbolizing a bear market. This creative doodle features a stylized purple bear, the financial metaphor for a declining market, surrounded by downward arrows, volatile stock chart lines, and a warning sign. The abstract, pastel-colored design effectively visualizes concepts of economic downturn, recession, financial crisis, and investment risk. This vector graphic is perfect for articles, blogs, presentations, and infographics related to finance, trading, economics, and stock market analysis. Isolated on a white background for versatile use. Decrease arrow chart vectors Bear Market Financial Concept Illustration. A modern, hand-drawn illustration symbolizing a bear market. This creative doodle features a stylized purple bear, the financial metaphor for a declining market, surrounded by downward arrows, volatile stock chart lines, and a warning sign. The abstract, pastel-colored design effectively visualizes concepts of economic downturn, recession, financial crisis, and investment risk. This vector graphic is perfect for articles, blogs, presentations, and infographics related to finance, trading, economics, and stock market analysis. Isolated on a white background for versatile use.
Free with trial The image shows a computer screen displaying a stock market chart with a downward trend. The chart features a red line with arrows indicating a decline, and various percentage values are marked along the graph. Decrease arrow chart illustrations Stock market downtrend displayed on screen. The image shows a computer screen displaying a stock market chart with a downward trend. The chart features a red line with arrows indicating a decline, and various percentage values are marked along the graph
Free with trial Three vibrant green arrows point downwards, each adorned with a white percentage symbol, visually representing a decline in rates or financial losses. Evokes concepts of sales, discounts, and market trends. Decrease arrow chart illustrations Green downward arrows symbolizing percentage decrease and financial loss isolated on white background. Three vibrant green arrows point downwards, each adorned with a white percentage symbol, visually representing a decline in rates or financial losses. Evokes concepts of sales, discounts, and market trends
Free with trial Declining stock market graph on smartphone screen indicates financial loss or crisis. Decrease arrow chart illustrations Smartphone screen displays declining stock market graph with red arrow. Declining stock market graph on smartphone screen indicates financial loss or crisis
Free with trial A computer screen displaying stock market notifications for three stocks: Stock A with a 5% increase, Stock B with a 3% decrease, and Stock C that has reached its target. The image features a dark grey computer screen with a light blue background and colorful notification bubbles. Decrease arrow chart illustrations Stock market notifications on a computer screen. A computer screen displaying stock market notifications for three stocks: Stock A with a 5% increase, Stock B with a 3% decrease, and Stock C that has reached its target. The image features a dark grey computer screen with a light blue background and colorful notification bubbles.
Free with trial Oil barrel beside downward green arrow with dollar, euro, and yen symbols, symbolizing falling oil prices, currency impact, and global energy market decline. Generative AI. Decrease arrow chart illustrations Falling Oil Prices and Currency Decline Concept. Oil barrel beside downward green arrow with dollar, euro, and yen symbols, symbolizing falling oil prices, currency impact, and global energy market decline. Generative AI
Free with trial This vibrant 3D bar graph features various colorful bars with an upward arrow, symbolizing growth and success in financial and business metrics Generative Ai. Decrease arrow chart illustrations Colorful 3D Bar Graph Showing Growth with Upward Arrow Design. This vibrant 3D bar graph features various colorful bars with an upward arrow, symbolizing growth and success in financial and business metrics Generative Ai
Free with trial Economic crisis line icon of graph going down, economy downturn and bankruptcy vector symbol. Stock exchange or economical index decrease linear icon of financial crisis and global economy recession. Decrease arrow chart vectors Economic crisis icon of economy graph going down. Economic crisis line icon of graph going down, economy downturn and bankruptcy vector symbol. Stock exchange or economical index decrease linear icon of financial crisis and global economy recession
Free with trial A graphic element featuring three solid black, block-style arrows pointing towards the right. The arrows are arranged diagonally from top-left to bottom-right, and each subsequent arrow is visibly smaller, illustrating concepts of decrease, progression, or movement in scale. The element is isolated on a white background. Decrease arrow chart illustrations Three Decreasing Black Arrows Pointing Right. A graphic element featuring three solid black, block-style arrows pointing towards the right. The arrows are arranged diagonally from top-left to bottom-right, and each subsequent arrow is visibly smaller, illustrating concepts of decrease, progression, or movement in scale. The element is isolated on a white background.
Free with trial This vibrant vector illustration showcases a collection of red and orange gradient arrows, all pointing downwards. The set includes both straight and dynamically curved arrows, effectively symbolizing various forms of decline, decrease, or negative trends. Perfect for use in business presentations, financial reports, infographics, or any design requiring a clear visual representation of falling statistics, market drops, recession, loss, or a general downward movement. The clean, modern flat design ensures versatility and impact. Decrease arrow chart vectors Downward Trend Red Gradient Arrows Vector Set. This vibrant vector illustration showcases a collection of red and orange gradient arrows, all pointing downwards. The set includes both straight and dynamically curved arrows, effectively symbolizing various forms of decline, decrease, or negative trends. Perfect for use in business presentations, financial reports, infographics, or any design requiring a clear visual representation of falling statistics, market drops, recession, loss, or a general downward movement. The clean, modern flat design ensures versatility and impact.
Free with trial A red line with a jagged pattern trending downward, indicating a decrease or decline, with a large arrowhead at the end pointing downwards. Decrease arrow chart illustrations A red downward trend line with a jagged pattern. a red line with a jagged pattern trending downward, indicating a decrease or decline, with a large arrowhead at the end pointing downwards
Free with trial This minimalist graphic features a bold red line forming a downward-pointing arrow shape. The design is clean and flat, set against a solid white background to emphasize the negative trend. It serves as a clear visual representation of financial loss, market decline, or decreasing performance metrics. Decrease arrow chart vectors A simple red line graph icon showing a downward trend on a white background. This minimalist graphic features a bold red line forming a downward-pointing arrow shape. The design is clean and flat, set against a solid white background to emphasize the negative trend. It serves as a clear visual representation of financial loss, market decline, or decreasing performance metrics
Free with trial A 3d bar graph with rainbow colors and an orange arrow pointing downwards to indicate a decline or decrease in trend. the bars are arranged in a descending order with the tallest bar on the left and the shortest on the right. the background is plain white. Decrease arrow chart illustrations A colorful bar graph showing a decline in trend. a 3d bar graph with rainbow colors and an orange arrow pointing downwards to indicate a decline or decrease in trend. the bars are arranged in a descending order with the tallest bar on the left and the shortest on the right. the background is plain white
Free with trial Depreciation of savings line icon with color broken piggy bank, money and down arrow graph. Vector finance, business and economy crisis, money loss and bankruptcy isolated outline symbol. Decrease arrow chart vectors Depreciation of savings line icon of piggy bank. Depreciation of savings line icon with color broken piggy bank, money and down arrow graph. Vector finance, business and economy crisis, money loss and bankruptcy isolated outline symbol
Free with trial A bar graph with yellow bars and a red line shows a downward trend over time. the red line connects the tops of the bars and has an arrow at the end pointing down. Decrease arrow chart illustrations A bar graph shows a downward trend over time. a bar graph with yellow bars and a red line shows a downward trend over time. the red line connects the tops of the bars and has an arrow at the end pointing down
Free with trial The image depicts a bar graph with a downward trend. The bars start tall on the left and progressively decrease in height towards the right. A yellow arrow at the top of the graph points downward, emphasizing the decline. Decrease arrow chart illustrations Decreasing bar graph. The image depicts a bar graph with a downward trend. The bars start tall on the left and progressively decrease in height towards the right. A yellow arrow at the top of the graph points downward, emphasizing the decline