Free with trial A collection of five distinct black and white graphic representations of data. From left to right, the first is a line graph with dots, showing fluctuations. The second is a zig-zag line graph with dots and an upward arrow. The third is a series of ascending vertical bars. The fourth is a bar chart with a single dot above one of the bars. The fifth is a pie chart divided into four sections, with. Decrease arrow chart vectors Collection of black and white business and data charts and graphs statistics analytics. A collection of five distinct black and white graphic representations of data. From left to right, the first is a line graph with dots, showing fluctuations. The second is a zig-zag line graph with dots and an upward arrow. The third is a series of ascending vertical bars. The fourth is a bar chart with a single dot above one of the bars. The fifth is a pie chart divided into four sections, with
Free with trial A 3D rendering shows a financial graph with a decreasing rate. The pink arrow points downwards, indicating a loss. The bars represent data points in a business or economic context. Decrease arrow chart illustrations Decreasing rate financial graph on white background. A 3D rendering shows a financial graph with a decreasing rate. The pink arrow points downwards, indicating a loss. The bars represent data points in a business or economic context
Free with trial Black down arrows and horizontal bars arranged vertically on a white background. Clear details and vibrant col. Decrease arrow chart illustrations Black down arrows and horizontal bars on white background descending decrease. Black down arrows and horizontal bars arranged vertically on a white background. Clear details and vibrant col
Free with trial Economic crisis icon of price low down or stock market depreciation, vector line symbol. Global economy and business downturn with financial crisis and prices decrease or percent down low. Decrease arrow chart illustrations Economic crisis icon, price low down, stock market. Economic crisis icon of price low down or stock market depreciation, vector line symbol. Global economy and business downturn with financial crisis and prices decrease or percent down low
Free with trial Worried Businesswoman Holding Downward Arrow Showing Financial Loss and Market Decline. Flat Vector Character. Decrease arrow chart illustrations Worried Businesswoman Holding Downward Arrow Showing Financial Loss and Market Decline
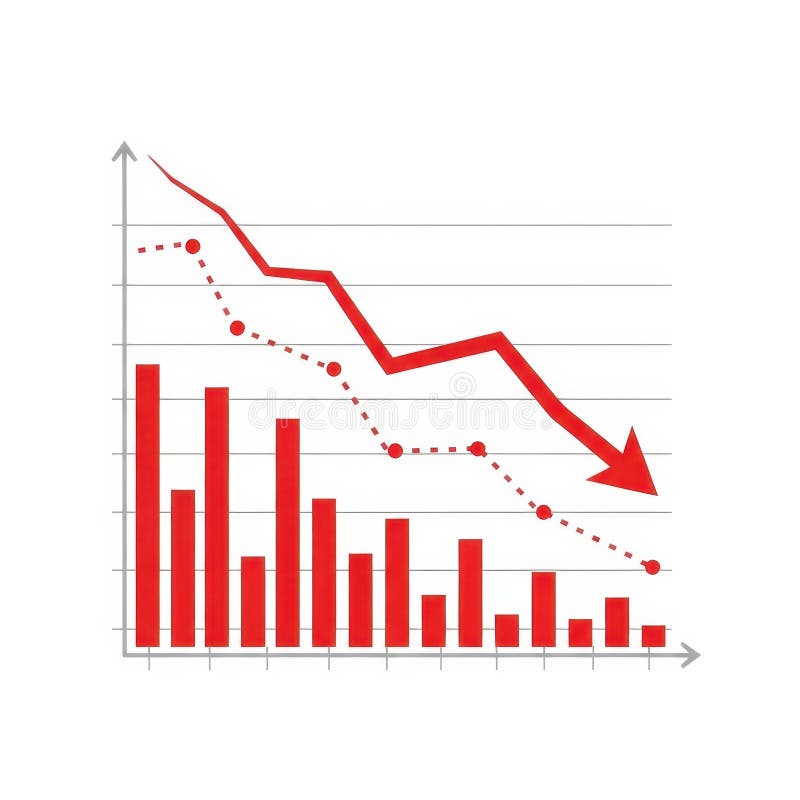
Free with trial A bar graph with a red downward arrow illustrates a decline in data over time. Decrease arrow chart illustrations Decline in bar graph indicates downward trend. A bar graph with a red downward arrow illustrates a decline in data over time
Free with trial Economic crisis or investing risk, volatility and Stock market fluctuation concept, businessman investor rodeo riding uncertainty decline red arrow graph. Decrease arrow chart vectors Economic crisis or investing risk
Free with trial A comprehensive collection of flat line design icons representing key concepts in business, finance, and data analytics. The set includes various charts (bar, line, pie), a speedometer, a magnifying glass with a graph, financial documents with checkmarks, a target with an arrow, a dollar sign, a percentage symbol, and directional arrows for growth and decline. These versatile vector elements are ideal for presentations, reports, websites, and applications focused on statistics, performance, strategy, and financial insights. Decrease arrow chart illustrations Business and Data Analytics Flat Line Icons Set. A comprehensive collection of flat line design icons representing key concepts in business, finance, and data analytics. The set includes various charts (bar, line, pie), a speedometer, a magnifying glass with a graph, financial documents with checkmarks, a target with an arrow, a dollar sign, a percentage symbol, and directional arrows for growth and decline. These versatile vector elements are ideal for presentations, reports, websites, and applications focused on statistics, performance, strategy, and financial insights.
Free with trial A 3D-rendered image depicts a red arrow pointing downwards, symbolizing a market decline or economic downturn. The arrow rests on a dark, textured surface, enhancing the visual representation of hardship. This image, generated by AI, is ideal for illustrating articles or presentations concerning fin. Decrease arrow chart illustrations Downward Trend. A 3D-rendered image depicts a red arrow pointing downwards, symbolizing a market decline or economic downturn. The arrow rests on a dark, textured surface, enhancing the visual representation of hardship. This image, generated by AI, is ideal for illustrating articles or presentations concerning fin
Free with trial Gear symbol illustrating a mechanical process with an arrow pointing down, representing decreasing output, declining performance, or a reduction in industrial operations. Decrease arrow chart vectors Gear icon indicating declining production process. Gear symbol illustrating a mechanical process with an arrow pointing down, representing decreasing output, declining performance, or a reduction in industrial operations
Free with trial An illustration depicts a sad or depressed businessman in a dark suit and red tie, sitting dejectedly on a stool. A prominent red arrow points sharply downwards from the top left to the bottom right, visually symbolizing financial decline, economic downturn, or business loss. The man's slumped posture and sorrowful expression convey feelings of failure, stress, and despair. This image is ideal for illustrating concepts related to recession, market crash, bankruptcy, job loss, or personal financial struggles. Decrease arrow chart vectors Businessman Experiencing Financial Decline and Stress. An illustration depicts a sad or depressed businessman in a dark suit and red tie, sitting dejectedly on a stool. A prominent red arrow points sharply downwards from the top left to the bottom right, visually symbolizing financial decline, economic downturn, or business loss. The man's slumped posture and sorrowful expression convey feelings of failure, stress, and despair. This image is ideal for illustrating concepts related to recession, market crash, bankruptcy, job loss, or personal financial struggles.
Free with trial A collection of nine flat vector icons for data visualization including bar graphs, line charts, pie charts, and performance meters isolated on a white background. Decrease arrow chart vectors Simple black data analysis and business chart icon set. A collection of nine flat vector icons for data visualization including bar graphs, line charts, pie charts, and performance meters isolated on a white background
Free with trial 3D rendering of a business infographic chart showing a progressive decline over four periods. Red color on the 3D bar graph chart with an arrow on it. Decrease arrow chart illustrations 3D render of a business data in decline. 3D rendering of a business infographic chart showing a progressive decline over four periods. Red color on the 3D bar graph chart with an arrow on it.
Free with trial A 3D illustration depicting a series of stacks of gold coins decreasing in height from left to right, accompanied by a red arrow trending downwards, symbolizing financial loss, economic downturn, or decreasing wealth. Decrease arrow chart vectors Financial Decline: Stacks of Gold Coins with Downward Trend. A 3D illustration depicting a series of stacks of gold coins decreasing in height from left to right, accompanied by a red arrow trending downwards, symbolizing financial loss, economic downturn, or decreasing wealth.
Free with trial Conceptual line art depicting a decrease in gold prices. Decrease arrow chart illustrations Gold Price Drop Magnifying Glass Showing Decreasing Value. Conceptual line art depicting a decrease in gold prices.
Free with trial A simple line drawing depicts a declining bar graph with an arrow pointing downwards, all viewed through a magnifying. Decrease arrow chart illustrations Declining Graph Under Magnifying Glass Loss Analysis Icon. A simple line drawing depicts a declining bar graph with an arrow pointing downwards, all viewed through a magnifying.
Free with trial A 3D cartoon illustration depicts a stylized hand with a black suit cuff pointing a finger downwards towards a red bar graph. The graph shows a clear downward trend with bars decreasing in height from left to right, colored green, yellow, orange, and red. A red arrow reinforces the concept of decline. The image is set against a white background. Decrease arrow chart illustrations 3D Cartoon Hand Pointing Down at a Declining Bar Graph on White Background business. A 3D cartoon illustration depicts a stylized hand with a black suit cuff pointing a finger downwards towards a red bar graph. The graph shows a clear downward trend with bars decreasing in height from left to right, colored green, yellow, orange, and red. A red arrow reinforces the concept of decline. The image is set against a white background
Free with trial An empty corporate conference room featuring a large wooden table, office chairs, and a whiteboard displaying a hand-drawn graph indicating a downward trend in performance. Decrease arrow chart illustrations Modern Office Conference Room Showing Financial Loss Chart. An empty corporate conference room featuring a large wooden table, office chairs, and a whiteboard displaying a hand-drawn graph indicating a downward trend in performance
Free with trial Two simple arrows on a white background. The red arrow points diagonally downward to the left, while the green arrow points diagonally upward to the right. Both arrows have a clean design with bold lines and sharp arrowheads, indicating contrast or opposing directions. Decrease arrow chart vectors Up and Down Growth Arrows - Stock Market Trend Vector Symbols. Two simple arrows on a white background. The red arrow points diagonally downward to the left, while the green arrow points diagonally upward to the right. Both arrows have a clean design with bold lines and sharp arrowheads, indicating contrast or opposing directions.
Free with trial The word 'TRENDS' is displayed prominently in blue, overlaid by a sharp, downward-pointing red arrow, visually communicating a negative trend or decline in data or performance. Decrease arrow chart illustrations Word trends with a downward red arrow. The word 'TRENDS' is displayed prominently in blue, overlaid by a sharp, downward-pointing red arrow, visually communicating a negative trend or decline in data or performance
Free with trial Outline vector graphic depicting a decline in business performance. Decrease arrow chart illustrations Declining Performance Gear, Man, Graph, Arrow. Business Downturn. Outline vector graphic depicting a decline in business performance.
Free with trial A clean, minimalist icon representing the stock market. The image features a bull and a bear, symbolizing market trends, with a rising green arrow indicating an upward trend. The design is enclosed in a circular frame, suitable for financial reports, investment presentations, or business infographics. The simple line art style makes it versatile for various applications. Decrease arrow chart illustrations Stock Market Bull and Bear Trend Icon. A clean, minimalist icon representing the stock market. The image features a bull and a bear, symbolizing market trends, with a rising green arrow indicating an upward trend. The design is enclosed in a circular frame, suitable for financial reports, investment presentations, or business infographics. The simple line art style makes it versatile for various applications.
Free with trial Collection of simple black vector icons representing financial charts, data analysis graphs, and business statistics. Includes trend arrows, magnifier, and settings symbols. Decrease arrow chart vectors Set of black business graph and chart icons for data analysis. Collection of simple black vector icons representing financial charts, data analysis graphs, and business statistics. Includes trend arrows, magnifier, and settings symbols
Free with trial This image features a 3D bar graph with a downward trend isolated on a white background. The graph consists of green bars that decrease in height from left to right, with a red arrow pointing downward to emphasize the declining trend. The image is clean and visually appealing, suitable for business and financial contexts. Decrease arrow chart illustrations 3d bar graph with downward trend isolated on white background. This image features a 3D bar graph with a downward trend isolated on a white background. The graph consists of green bars that decrease in height from left to right, with a red arrow pointing downward to emphasize the declining trend. The image is clean and visually appealing, suitable for business and financial contexts
Free with trial Two blue bar graphs are depicted against a white background. The left graph bars increasing in height with an upward curving arrow, indicating growth. The right graph bars decreasing in height. Decrease arrow chart vectors Blue bar graphs showing upward and downward trends with arrows. Two blue bar graphs are depicted against a white background. The left graph bars increasing in height with an upward curving arrow, indicating growth. The right graph bars decreasing in height
Free with trial A flat design vector illustration depicting a financial market data board or stock ticker. The black-bordered display features various stock symbols, numerical values like '$ ,80K', '$ ,22,50', and indicators of market performance. Prominently highlighted in red is the word 'LOSING', accompanied by a red downward arrow signifying a price drop, and a red downward triangle. Conversely, a green upward arrow indicates a price increase. This icon effectively visualizes concepts of financial loss, gain, market volatility, and investment trends, suitable for business, finance, and economic content. Decrease arrow chart illustrations Financial Market Data Board Icon with Loss and Gain Indicators. A flat design vector illustration depicting a financial market data board or stock ticker. The black-bordered display features various stock symbols, numerical values like '$ ,80K', '$ ,22,50', and indicators of market performance. Prominently highlighted in red is the word 'LOSING', accompanied by a red downward arrow signifying a price drop, and a red downward triangle. Conversely, a green upward arrow indicates a price increase. This icon effectively visualizes concepts of financial loss, gain, market volatility, and investment trends, suitable for business, finance, and economic content.
Free with trial A businessman presenting a concept of cost increase versus quality decrease with the help of visual arrows This is a good representation of business strategy financial challenges economic downturn and the need for effective resource management It shows a common corporate problem and a call for efficient solutions Focus is on the hand and arrows. Decrease arrow chart illustrations Business Strategy Showing Increased Cost and Decreased Quality Represented by Hand and Arrows. A businessman presenting a concept of cost increase versus quality decrease with the help of visual arrows This is a good representation of business strategy financial challenges economic downturn and the need for effective resource management It shows a common corporate problem and a call for efficient solutions Focus is on the hand and arrows
Free with trial Three red arrows, each featuring a white percentage sign, are depicted pointing downwards against a neutral grey background. The arrows are arranged in a staggered formation, suggesting a trend or movement. This visual metaphor strongly represents concepts such as financial loss, economic downturn, price reduction, or a decrease in value. The stark contrast between the red arrows and the white. Decrease arrow chart illustrations Red arrows pointing down with percentage signs symbolizing financial decline. Three red arrows, each featuring a white percentage sign, are depicted pointing downwards against a neutral grey background. The arrows are arranged in a staggered formation, suggesting a trend or movement. This visual metaphor strongly represents concepts such as financial loss, economic downturn, price reduction, or a decrease in value. The stark contrast between the red arrows and the white
Free with trial A dynamic image of a digital stock market ticker screen displaying financial data. The background is filled with red, downward-pointing arrows and negative numbers, symbolizing a bearish market, recession, or economic downturn. In stark contrast, a single, large, bright green arrow points upwards, representing growth, success, profit, and recovery. This powerful visual metaphor illustrates a single stock's success or a broader economic turnaround amidst widespread losses. It's perfect for concepts related to investment strategy, financial analysis, market volatility, and economic hope. Decrease arrow chart illustrations Stock Market Recovery and Growth Concept. A dynamic image of a digital stock market ticker screen displaying financial data. The background is filled with red, downward-pointing arrows and negative numbers, symbolizing a bearish market, recession, or economic downturn. In stark contrast, a single, large, bright green arrow points upwards, representing growth, success, profit, and recovery. This powerful visual metaphor illustrates a single stock's success or a broader economic turnaround amidst widespread losses. It's perfect for concepts related to investment strategy, financial analysis, market volatility, and economic hope.
Free with trial Businessman with downward graph indicating financial decline, recession, and negative growth. Ideal for economic analysis, loss reporting, and business downturn visuals. Decrease arrow chart vectors Business decline graph with downward arrow showing financial loss recession and negative growth concept. Businessman with downward graph indicating financial. Businessman with downward graph indicating financial decline, recession, and negative growth. Ideal for economic analysis, loss reporting, and business downturn visuals
Free with trial Digital Transformation in Real Estate Market with Laptop and House Icon Illustrating Decrease in Property Value Represented by Percent Symbol Sigmoid. Decrease arrow chart illustrations A modern workspace with a laptop and digital house icon, showcasing the decline in property value with a percent symbol. Digital Transformation in Real Estate Market with Laptop and House Icon Illustrating Decrease in Property Value Represented by Percent Symbol Sigmoid
Free with trial A set of four vibrant, glossy 3D arrows in red, orange, cyan, and green, all curved and pointing downwards to indicate a decrease, download or direction. Decrease arrow chart vectors Four Colorful 3D Curved Arrows Pointing Downwards. A set of four vibrant, glossy 3D arrows in red, orange, cyan, and green, all curved and pointing downwards to indicate a decrease, download or direction
Free with trial This image depicts a bar graph on an easel showing a clear downward trend. The bars are blue, and a large red arrow points downward, indicating a decline. Decrease arrow chart illustrations Decline in data represented by a descending bar graph on an easel. This image depicts a bar graph on an easel showing a clear downward trend. The bars are blue, and a large red arrow points downward, indicating a decline
Free with trial Black line graph showing upward and downward trends with arrows on a white background. Decrease arrow chart illustrations Black line graph with upward and downward trends and arrows chart data. Black line graph showing upward and downward trends with arrows on a white background
Free with trial Three stacks of coins decreasing in height, each topped with a wooden block featuring a black downward arrow, symbolizing financial decline, economic downturn, or decreasing profits against a blue background. Decrease arrow chart illustrations Financial Decline Concept with Stacks of Coins and Downward Arrows. Three stacks of coins decreasing in height, each topped with a wooden block featuring a black downward arrow, symbolizing financial decline, economic downturn, or decreasing profits against a blue background
Free with trial A flat depicting two distinct financial charts against a white background. The left chart a bar graph with bars in shades of green and blue, topped by a jagged blue line graph ascending towards a green percentage symbol and an upward arrow. The right chart a bar graph with bars in yellow, orange, and red, with a red line graph descending from a yellow dollar sign. Decrease arrow chart illustrations Upward and downward financial charts with percentage and dollar symbols. A flat depicting two distinct financial charts against a white background. The left chart a bar graph with bars in shades of green and blue, topped by a jagged blue line graph ascending towards a green percentage symbol and an upward arrow. The right chart a bar graph with bars in yellow, orange, and red, with a red line graph descending from a yellow dollar sign
Free with trial An illustration of a simple line graph showing a decline or decrease, accompanied by an exclamation mark inside a triangle, indicating a warning, danger or risk. Suitable for topics like financial loss, market crash, or economic downturn. Decrease arrow chart vectors Simple Line Decline Graph with Exclamation Mark Attention Icon Design. An illustration of a simple line graph showing a decline or decrease, accompanied by an exclamation mark inside a triangle, indicating a warning, danger or risk. Suitable for topics like financial loss, market crash, or economic downturn.
Free with trial Vector illustration showing oil price decrease with dollar sign drop barrel fuel pump and declining graph representing economic impact and market trends in black and white style calm. Generative AI. Decrease arrow chart vectors Oil price drop concept with dollar sign barrel pump and graph vector illustration. Vector illustration showing oil price decrease with dollar sign drop barrel fuel pump and declining graph representing economic impact and market trends in black and white style calm. Generative AI
Free with trial This image depicts a visual representation of financial or business growth and decline using a series of ascending and descending three-dimensional bar charts, where the left side shows smaller bars gradually increasing in height, transitioning through a central flat bar, and shifting to taller bars on the right side that progressively decrease, all set against a plain white background to. Decrease arrow chart illustrations Growth and progress concept with ascending and descending bar charts illustrating business success and financial improvement over. This image depicts a visual representation of financial or business growth and decline using a series of ascending and descending three-dimensional bar charts, where the left side shows smaller bars gradually increasing in height, transitioning through a central flat bar, and shifting to taller bars on the right side that progressively decrease, all set against a plain white background to
Free with trial Failed investor tries to avoid bankruptcy during financial crisis, and pulls economic chart up. Male investor panics due to start of recession and falling prices for stocks and government bonds. Decrease arrow chart vectors Failed investor tries to avoid bankruptcy during financial crisis, and pulls economic chart up
Free with trial Four colorful 3D arrows in red, orange, cyan, and green are pointing down, representing a decline, loss, or downward trend in a business or financial chart. Decrease arrow chart vectors Set of Four Glossy 3D Arrows Showing a Downward Trend. Four colorful 3D arrows in red, orange, cyan, and green are pointing down, representing a decline, loss, or downward trend in a business or financial chart
Free with trial A collection of nine simple, solid black icons on a white background, illustrating concepts of decline, loss, and negative trends using various charts like bar graphs, line graphs, and pie charts with downward pointing arrows. Decrease arrow chart vectors Set of black icons representing financial decrease and downward trends. A collection of nine simple, solid black icons on a white background, illustrating concepts of decline, loss, and negative trends using various charts like bar graphs, line graphs, and pie charts with downward pointing arrows
Free with trial Analyze the crash in the stock market crash. Learn from investment failure mistakes. Assess the damage from the business sector. Experts find the cause of the stock chart fall. Decrease arrow chart vectors Analyze the crash in the stock market crash. Learn from investment failure mistakes. Assess the damage from the business
Free with trial A minimalist and clean line art illustration of a graph depicting a downward trend, symbolizing economic decline, failure, or a recession in business. Decrease arrow chart vectors Simple Outline Falling Graph Line Chart Economic Recession Business Icon. A minimalist and clean line art illustration of a graph depicting a downward trend, symbolizing economic decline, failure, or a recession in business.
Free with trial Black bar graph with downward arrows indicating a decline or loss on a white background. Decrease arrow chart illustrations Falling bar graph with downward arrows indicating decline or loss chart. Black bar graph with downward arrows indicating a decline or loss on a white background
Free with trial A visual representation of financial decline, economic downturn, or falling percentages. Three green arrows, shaped like a ribbon, are shown descending, each marked with a percentage symbol. The background is a clean, neutral gray, emphasizing the downward trend. Decrease arrow chart illustrations Green arrows with percentage signs pointing downwards symbolizing a decrease in value. A visual representation of financial decline, economic downturn, or falling percentages. Three green arrows, shaped like a ribbon, are shown descending, each marked with a percentage symbol. The background is a clean, neutral gray, emphasizing the downward trend
Free with trial Stock market. The rise and fall of securities. Successful trading. Market trend up green and red down arrows, financial graphs. Business investment growth and loss arrow. Graph going up and down symbol vector illustration. Decrease arrow chart vectors Stock market. The rise and fall of securities. Successful trading. Market trend up green and red down arrows, financial graphs.
Free with trial Stock market. The rise and fall of securities. Successful trading. Market trend up green and red down arrows, financial graphs. Business investment growth and loss arrow. Graph going up and down symbol vector illustration. Decrease arrow chart vectors Stock market. The rise and fall of securities. Successful trading. Market trend up green and red down arrows, financial graphs.
Free with trial Stock market. The rise and fall of securities. Successful trading. Market trend up green and red down arrows, financial graphs. Business investment growth and loss arrow. Graph going up and down symbol vector illustration. Decrease arrow chart vectors Stock market. The rise and fall of securities. Successful trading. Market trend up green and red down arrows, financial graphs.
Free with trial Stock market. The rise and fall of securities. Successful trading. Market trend up green and red down arrows, financial graphs. Business investment growth and loss arrow. Graph going up and down symbol vector illustration. Decrease arrow chart vectors Stock market. The rise and fall of securities. Successful trading. Market trend up green and red down arrows, financial graphs.
Free with trial Stock market. The rise and fall of securities. Successful trading. Market trend up green and red down arrows, financial graphs. Business investment growth and loss arrow. Graph going up and down symbol vector illustration. Decrease arrow chart vectors Stock market. The rise and fall of securities. Successful trading. Market trend up green and red down arrows, financial graphs.
Free with trial Stock market. The rise and fall of securities. Successful trading. Market trend up green and red down arrows, financial graphs. Business investment growth and loss arrow. Graph going up and down symbol vector illustration. Decrease arrow chart vectors Stock market. The rise and fall of securities. Successful trading. Market trend up green and red down arrows, financial graphs.
Free with trial A downward trending graph line with arrow is featured against a dark night sky filled with stars, suggesting economic downturn. Decrease arrow chart illustrations Decreasing Graph in Night Sky. A downward trending graph line with arrow is featured against a dark night sky filled with stars, suggesting economic downturn
Free with trial Three stacks of coins, each topped with a wooden block featuring a downward-pointing arrow, illustrating a concept of financial loss, economic downturn, or decreasing value against a blue background. Decrease arrow chart illustrations Decreasing stacks of coins with down arrows symbolizing financial decline. Three stacks of coins, each topped with a wooden block featuring a downward-pointing arrow, illustrating a concept of financial loss, economic downturn, or decreasing value against a blue background
Free with trial A conceptual image featuring a series of ascending wooden blocks, with a green upward arrow on a lower block and a red downward arrow on a higher block, symbolizing the fluctuating nature of business, market trends, and financial performance. The image conveys concepts of success, failure, progress, and setback in a clear and concise manner. Decrease arrow chart illustrations Wooden Blocks with Up and Down Arrows Representing Business Growth and Decline. A conceptual image featuring a series of ascending wooden blocks, with a green upward arrow on a lower block and a red downward arrow on a higher block, symbolizing the fluctuating nature of business, market trends, and financial performance. The image conveys concepts of success, failure, progress, and setback in a clear and concise manner
Free with trial This striking image depicts a global oil market decline, featuring barrels and a red arrow, symbolizing economic downturn and financial crisis. Decrease arrow chart illustrations Global oil market decline represented by black barrels and red downward arrow over a world map in dark background. This striking image depicts a global oil market decline, featuring barrels and a red arrow, symbolizing economic downturn and financial crisis
Free with trial A digital illustration representing economic concepts of supply and demand. On the left, a blue arrow points upwards labeled "DEMAND" with a crowd of stylized figures. On the right, a red arrow points downwards labeled "SUPPLY" with another crowd and various business-related icons. The two sides are separated by a glowing energy effect on a dark, futuristic background. Decrease arrow chart illustrations Conceptual illustration of supply and demand with contrasting arrows and crowds. A digital illustration representing economic concepts of supply and demand. On the left, a blue arrow points upwards labeled "DEMAND" with a crowd of stylized figures. On the right, a red arrow points downwards labeled "SUPPLY" with another crowd and various business-related icons. The two sides are separated by a glowing energy effect on a dark, futuristic background
Free with trial Paper cutouts Upward red arrow, zigzag green arrow & downward red arrow on pastel background. Decrease arrow chart illustrations Red and green arrows up and. Paper cutouts Upward red arrow, zigzag green arrow & downward red arrow on pastel background
Free with trial Up and down sign with green and black arrows in flat style showing movement direction and sales change. Vector illustration of a sales bar chart icon used as an elevator symbol or universal pictogram. Decrease arrow chart vectors Up and down sign with green and black arrows in flat style showing movement direction
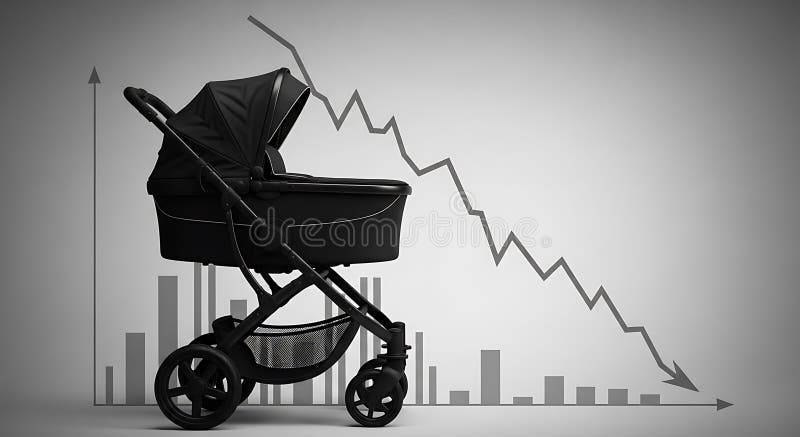
Free with trial A stark visual representation of demographic decline featuring a baby carriage silhouetted against a backdrop of a downward-trending graph and bar charts, symbolizing falling birth rates and. Decrease arrow chart illustrations Demographic Decline Baby Carriage with Downturn Graph and Population Decrease Concept. A stark visual representation of demographic decline featuring a baby carriage silhouetted against a backdrop of a downward-trending graph and bar charts, symbolizing falling birth rates and
Free with trial Three glossy green arrows, each featuring a white percentage symbol, are pointing downwards. The arrows are arranged side-by-side and have a slight 3D effect. They are presented against a black background, conveying a message of decrease, reduction, or a sale. Decrease arrow chart illustrations Three Green Arrows Pointing Down with Percentage Symbols. Three glossy green arrows, each featuring a white percentage symbol, are pointing downwards. The arrows are arranged side-by-side and have a slight 3D effect. They are presented against a black background, conveying a message of decrease, reduction, or a sale
Free with trial Several white and black arrows point upward at different angles on a light background. One black arrow in the upper right hand corner points downward. Decrease arrow chart illustrations Arrows Indicate Growth Upward, One Arrow Points Downward. Several white and black arrows point upward at different angles on a light background. One black arrow in the upper right hand corner points downward.
Free with trial Stacks of silver coins ascend with a red arrow graph line indicating growth, contrasted by a blue downward arrow and house outlines. Decrease arrow chart illustrations Stacks of coins with rising and falling graph lines and house outlines money finance. Stacks of silver coins ascend with a red arrow graph line indicating growth, contrasted by a blue downward arrow and house outlines
Free with trial A red and green arrow graph shows a downward trend. The image represents financial loss, economic decline, or a negative market trend. It is a visual representation of a decreasing value. Decrease arrow chart illustrations Red and green arrows pointing downwards on blue background. A red and green arrow graph shows a downward trend. The image represents financial loss, economic decline, or a negative market trend. It is a visual representation of a decreasing value
Free with trial A dynamic 3D visualization showcasing financial data. The scene features a rising bar chart with an upward trend arrow, symbolizing growth and success. Adjacent to it, a colorful pie chart represents data segmentation and distribution. The background is a dark, textured surface with subtle grid lines and abstract chart elements, creating a sophisticated and modern aesthetic. This imagery is ideal for presentations, reports, and digital content related to finance, business, economics, and data analysis. Decrease arrow chart illustrations 3D Financial Data Visualization: Growth Charts and Pie Graph. A dynamic 3D visualization showcasing financial data. The scene features a rising bar chart with an upward trend arrow, symbolizing growth and success. Adjacent to it, a colorful pie chart represents data segmentation and distribution. The background is a dark, textured surface with subtle grid lines and abstract chart elements, creating a sophisticated and modern aesthetic. This imagery is ideal for presentations, reports, and digital content related to finance, business, economics, and data analysis.
Free with trial A modern boardroom scene features a large table surrounded by white chairs, but the focus is on a chart displaying a sharp downward trend, generated by AI for illustrative purposes. This image could represent various financial or business challenges. Decrease arrow chart illustrations Boardroom Crisis. A modern boardroom scene features a large table surrounded by white chairs, but the focus is on a chart displaying a sharp downward trend, generated by AI for illustrative purposes. This image could represent various financial or business challenges.
Free with trial The background features blurred lights, creating a dramatic effect. financial markets. Decrease arrow chart illustrations A red downward arrow symbolizes a decline in financial markets. The background features blurred lights, creating a dramatic effect. financial markets
Free with trial Black line graph showing a downward trend on a white background with grid lines chart. Decrease arrow chart illustrations Black line graph showing a downward trend on a white background with grid lines chart
Free with trial A flat design illustration of two bar charts, one green and one red, both showing a downward trend with arrows, representing financial or business decline. Decrease arrow chart illustrations Bar chart showing declining trend isolated on white background. A flat design illustration of two bar charts, one green and one red, both showing a downward trend with arrows, representing financial or business decline
Free with trial Four icons depict rising and falling percentage values with arrows and curved lines on a white background. Decrease arrow chart illustrations Arrows indicating percentage increase and decrease in finance. Four icons depict rising and falling percentage values with arrows and curved lines on a white background
Free with trial The image depicts a downward trending line against a dark blue, starry background. the line itself is light blue and appears to be made of or surrounded by tiny particles, giving it a glowing effect. the line zigzags downwards, indicating a decline or loss, and ends with an arrow pointing further down. the overall impression is one of negative growth or a market downturn. Decrease arrow chart illustrations Falling trend line with starry background. the image depicts a downward trending line against a dark blue, starry background. the line itself is light blue and appears to be made of or surrounded by tiny particles, giving it a glowing effect. the line zigzags downwards, indicating a decline or loss, and ends with an arrow pointing further down. the overall impression is one of negative growth or a market downturn.
Free with trial Three funnel-shaped arrows�orange, red, and dark blue�decrease in size vertically, leading into a single blue arrow pointing right. Each funnel section tapers downward, representing a flow or process. The arrows contrast against a light background, emphasizing the transition from multiple inputs to a single output. Suitable for illustrating processes like sales funnels or data narrowing. Decrease arrow chart vectors Funnel flow chart template with three arrows. Three funnel-shaped arrows�orange, red, and dark blue�decrease in size vertically, leading into a single blue arrow pointing right. Each funnel section tapers downward, representing a flow or process. The arrows contrast against a light background, emphasizing the transition from multiple inputs to a single output. Suitable for illustrating processes like sales funnels or data narrowing.
Free with trial A visual representation of negative financial performance, illustrating a significant downward trend with a red arrow pointing downwards, indicating a loss or decline in value. Decrease arrow chart illustrations Red graph showing a downward trend isolated on white background. A visual representation of negative financial performance, illustrating a significant downward trend with a red arrow pointing downwards, indicating a loss or decline in value
Free with trial The image shows a rusty metal chart depicting a downward trend, placed on a wet, dark industrial floor. the chart is designed with sharp angles, forming a line graph that consistently declines, ending with an arrow pointing downwards. the floor reflects the chart, creating a mirrored image that enhances the sense of decline and loss. the background is blurred, suggesting an industrial setting with dim lighting and a sense of neglect. the overall atmosphere is somber, conveying a message of economic downturn or failure. Decrease arrow chart illustrations Rusty decline chart on wet industrial floor. the image shows a rusty metal chart depicting a downward trend, placed on a wet, dark industrial floor. the chart is designed with sharp angles, forming a line graph that consistently declines, ending with an arrow pointing downwards. the floor reflects the chart, creating a mirrored image that enhances the sense of decline and loss. the background is blurred, suggesting an industrial setting with dim lighting and a sense of neglect. the overall atmosphere is somber, conveying a message of economic downturn or failure.
Free with trial The image shows a line graph illustrating the decline of carbon emissions. there are two lines on the graph, a green line and a grey line, both trending downwards. the green line, representing "carbon inteetiual emissions," shows a steeper decline compared to the grey line. the graph is set against a grid background, providing a visual reference for the rate of decrease in emissions over time. the downward trend suggests a positive change in reducing carbon output. Decrease arrow chart illustrations Carbon emissions decline graph illustration. the image shows a line graph illustrating the decline of carbon emissions. there are two lines on the graph, a green line and a grey line, both trending downwards. the green line, representing "carbon inteetiual emissions," shows a steeper decline compared to the grey line. the graph is set against a grid background, providing a visual reference for the rate of decrease in emissions over time. the downward trend suggests a positive change in reducing carbon output.
Free with trial Bar graph showing decreasing values alongside arrows moving toward a minimal cloud. Ideal for data analysis, statistics, regression, performance tracking, economy, analytics, simple flat metaphor. Decrease arrow chart vectors Declining Bar Chart with Arrows and Cloud Representing Regression or Data Flow. Bar graph showing decreasing values alongside arrows moving toward a minimal cloud. Ideal for data analysis, statistics, regression, performance tracking, economy, analytics, simple flat metaphor
Free with trial A globe with a map of the world on it, sitting next to a set of orange bar graphs. Decrease arrow chart illustrations A globe sitting on top of a table next to a bar chart. A globe with a map of the world on it, sitting next to a set of orange bar graphs
Free with trial A paper cutout illustration of two arrows, one red, one green, indicating upward & downward trends. Decrease arrow chart illustrations Stock market growth red arrow outpacing. A paper cutout illustration of two arrows, one red, one green, indicating upward & downward trends
Free with trial The image depicts a red neon arrow pointing downwards against a dark background. the arrow is sleek and minimalist, emitting a bright red glow. below the arrow, a mirrored reflection is visible on a glossy surface, enhancing the visual impact. the overall composition is simple yet striking, creating a sense of depth and direction. the red color and downward pointing arrow often symbolize decline or loss in various contexts. the dark background emphasizes the brightness of the neon arrow. Decrease arrow chart illustrations Red neon arrow pointing down with reflection. the image depicts a red neon arrow pointing downwards against a dark background. the arrow is sleek and minimalist, emitting a bright red glow. below the arrow, a mirrored reflection is visible on a glossy surface, enhancing the visual impact. the overall composition is simple yet striking, creating a sense of depth and direction. the red color and downward pointing arrow often symbolize decline or loss in various contexts. the dark background emphasizes the brightness of the neon arrow.
Free with trial This image features a bar graph with red bars indicating a downward trend. The graph is isolated on a white background, making the red bars and the downward arrow clearly visible. The image is suitable for representing declining metrics or statistics. Decrease arrow chart illustrations Decreasing bar graph isolated on white background. This image features a bar graph with red bars indicating a downward trend. The graph is isolated on a white background, making the red bars and the downward arrow clearly visible. The image is suitable for representing declining metrics or statistics