Free with trial Businessman with thumb down over graph showing crisis, geometric pattern. Decrease arrow chart illustrations Falling down of economic activity, geometric pattern. Businessman with thumb down over graph showing crisis, geometric pattern
Free with trial Loan line icons. Interest rate, AI generate, Inflation icons. Set of Investment, Interest rate and Percentage diagram linear icons. Vector. Decrease arrow chart vectors Loan line icons. Set of Investment, Interest rate and Percentage diagram icons. App line icons. Vector. Loan line icons. Interest rate, AI generate, Inflation icons. Set of Investment, Interest rate and Percentage diagram linear icons. Vector
Free with trial This image showcases a large collection of minimalist, line-style icons representing various charts and graphs. These icons depict data visualization elements commonly used in business, analytics, and reporting. high-quality professional. Decrease arrow chart vectors Collection of diverse line style charts and graphs icons displayed neatly. This image showcases a large collection of minimalist, line-style icons representing various charts and graphs. These icons depict data visualization elements commonly used in business, analytics, and reporting. high-quality professional
Free with trial Businessman with thumb down over graph showing crisis, geometric pattern. Decrease arrow chart illustrations Falling down of economic activity, geometric pattern. Businessman with thumb down over graph showing crisis, geometric pattern
Free with trial Downward Bar Graph Line Icon, Decline or Loss Vector. Decrease arrow chart vectors Downward Bar Graph Line Icon
Free with trial Business Icons Set isolated on black background. Simple vector logo. Decrease arrow chart vectors Business Icons Set isolated on black background
Free with trial Financial Crisis, Dollar Fall Down. USD Inflation. Falling Currency Symbol With Neon Arrows Showing Economic Decline And Market Drop In Futuristic Style. Dynamic Finance Concept. Vector Illustration. Decrease arrow chart vectors Financial Crisis, Dollar Fall Down. USD Inflation. Falling Currency Symbol With Neon Arrows Showing Economic Decline And
Free with trial Financial Crisis, Dollar Fall Down. USD Inflation. Falling Currency Symbol With Neon Arrows Showing Economic Decline And Market Drop In Futuristic Style. Dynamic Finance Concept. Vector Illustration. Decrease arrow chart vectors Financial Crisis, Dollar Fall Down. USD Inflation. Falling Currency Symbol With Neon Arrows Showing Economic Decline And
Free with trial Business falling icon isolated on background vector illustration. Non AI Generate. Decrease arrow chart vectors Business falling icon isolated on background vector illustration.
Free with trial Low libido vector icon isolated on white background. Decrease arrow chart vectors Low libido vector icon
Free with trial Illustration of a business activities. Decrease arrow chart vectors Illustration of a business activities
Free with trial Illustration of a business activities. Decrease arrow chart vectors Illustration of a business activities
Free with trial Illustration of a business activities. Decrease arrow chart vectors Illustration of a business activities
Free with trial Business Down Icon - Percentage Rate Loss Icon sing symbol. Decrease arrow chart vectors Business Down Icon - Percentage Rate Loss Icon
Free with trial Cost reduction, cost efficiency, business concept. Decrease arrow chart illustrations Cost reduction, cost efficiency, business concept
Free with trial Downward arrows representing decline, calculator symbolizing calculations, and percentage sign for financial analysis. Ideal for business, finance, data analysis, interest rate, savings, growth. Decrease arrow chart vectors Decreasing Trends with Financial Calculation and Percentage Concept. Downward arrows representing decline, calculator symbolizing calculations, and percentage sign for financial analysis. Ideal for business, finance, data analysis, interest rate, savings, growth
Free with trial Black silhouette arrows illustrate financial growth and decline against a white background, perfect for business concepts. Flat design graphic. Decrease arrow chart vectors Multiple upward and downward trend arrows. Black silhouette arrows illustrate financial growth and decline against a white background, perfect for business concepts. Flat design graphic
Free with trial A clean flat design vector illustration featuring opposing arrows symbolizing growth and decline, perfect for financial or business concepts. Decrease arrow chart vectors Black zigzag arrows indicating market trends. A clean flat design vector illustration featuring opposing arrows symbolizing growth and decline, perfect for financial or business concepts
Free with trial Icon set depicting financial growth and decline with upward and downward arrows over bar charts, perfect for business analytics and presentations. Decrease arrow chart vectors Bar charts with curved arrows showing trends. Icon set depicting financial growth and decline with upward and downward arrows over bar charts, perfect for business analytics and presentations
Free with trial Percentage symbol inside a circular arrow illustrating financial performance, interest rates, tax calculations, market fluctuations, or economic cycles in a modern sketch style illustration. Decrease arrow chart illustrations Percentage symbol revolving looping business icon. Percentage symbol inside a circular arrow illustrating financial performance, interest rates, tax calculations, market fluctuations, or economic cycles in a modern sketch style illustration
Free with trial A professional collection of 16 business and financial icons featuring various bar charts and line graphs. Perfect for UI dashboards, corporate presentations, and data-heavy infographics showing market growth or decline. Decrease arrow chart vectors Business Growth Bar Charts and Financial Trend Line Graph Vector Icons Set. A professional collection of 16 business and financial icons featuring various bar charts and line graphs. Perfect for UI dashboards, corporate presentations, and data-heavy infographics showing market growth or decline.
Free with trial A professional collection of 16 business and financial icons featuring various bar charts and line graphs. Perfect for UI dashboards, corporate presentations, and data-heavy infographics showing market growth or decline. Decrease arrow chart vectors Business Growth Bar Charts and Financial Trend Line Graph Vector Icons Set. A professional collection of 16 business and financial icons featuring various bar charts and line graphs. Perfect for UI dashboards, corporate presentations, and data-heavy infographics showing market growth or decline.
Free with trial Bankruptcy concept in flat design business. design vector illustration. Decrease arrow chart vectors Bankruptcy concept in flat vector design business. bankruptcy concept in flat design business.design vector illustration
Free with trial Trend Down : Trend down indicates a decrease in financial performance, market value, or economic indicators over time. Decrease arrow chart vectors Trend Down
Free with trial Black arrows illustrating an upward and downward zigzag fluctuation, symbolizing a dynamic process of movement, change, and varying trends on a clean white background. Decrease arrow chart vectors Fluctuation movement with up and down zigzag arrows. Black arrows illustrating an upward and downward zigzag fluctuation, symbolizing a dynamic process of movement, change, and varying trends on a clean white background
Free with trial Stack of bitcoin coins. in background a graph showing decrease in value. Falling of cryptocurrency. Decrease arrow chart vectors Bitcoin, cryptocurrency falling graph, risk, crash, collapse of BTC. Stack of bitcoin coins. in background a graph showing decrease in value. Falling of cryptocurrency.
Free with trial Vector graphic showing business profit and loss statement with green upward trends, red declines, percentages, calculator, and money icons. Decrease arrow chart illustrations Illustrated Profit and Loss Financial Report with Charts and Graphs. Vector graphic showing business profit and loss statement with green upward trends, red declines, percentages, calculator, and money icons
Free with trial Illustration of a growing energy independence with a simple oil barrel with a decreasing sign, a solar panel receiving sun, and a stylized wind turbine. Vector flat icon design on a white background for a resource transition illustration --chaos 30 --ar 16:9 --v 7 Job ID: 592d63c7-ea9f-4b58-8aae-19f2fa4830a1. Decrease arrow chart illustrations Energy Transition Solar, Wind, Oil Barrel, and Falling Market Graph. Illustration of a growing energy independence with a simple oil barrel with a decreasing sign, a solar panel receiving sun, and a stylized wind turbine. Vector flat icon design on a white background for a resource transition illustration --chaos 30 --ar 16:9 --v 7 Job ID: 592d63c7-ea9f-4b58-8aae-19f2fa4830a1
Free with trial This minimalist illustration depicts a downward trending graph superimposed with two stylized power pylons. A vibrant green leaf is positioned near the end of the graph, symbolizing the shift towards renewable or sustainable energy sources. The composition suggests a decline in traditional energy infrastructure or consumption, with an implied transition to eco-friendly alternatives. Ideal for concepts related to energy policy, environmental impact, economic shifts in the power sector, and the future of electricity. Decrease arrow chart vectors Green Energy Transition and Power Grid Decline Graph. This minimalist illustration depicts a downward trending graph superimposed with two stylized power pylons. A vibrant green leaf is positioned near the end of the graph, symbolizing the shift towards renewable or sustainable energy sources. The composition suggests a decline in traditional energy infrastructure or consumption, with an implied transition to eco-friendly alternatives. Ideal for concepts related to energy policy, environmental impact, economic shifts in the power sector, and the future of electricity.
Free with trial Bankruptcy concept in flat design business. design vector illustration. Decrease arrow chart vectors Bankruptcy finance business concept flat vector design. bankruptcy concept in flat design business.design vector illustration
Free with trial Simple black icons representing financial growth and decline, perfect for business analytics and reporting. This scalable vector graphic is versatile for web and print. Decrease arrow chart vectors Bar charts with arrows indicating growth or decline. Simple black icons representing financial growth and decline, perfect for business analytics and reporting. This scalable vector graphic is versatile for web and print
Free with trial A stylized illustration of a descending bar graph within a website window, rendered in a flat, minimalist design. Decrease arrow chart vectors Decreasing bar graph inside a website window interface. A stylized illustration of a descending bar graph within a website window, rendered in a flat, minimalist design.
Free with trial Downward line graph with data points, red sad emoticon, error message box, and cloud. Ideal for business loss, mistakes, failure, analytics issues, disappointment error handling or recovery. Decrease arrow chart vectors Declining Trend with Error Message and Sad Emoticon Representing Failure or Loss. Downward line graph with data points, red sad emoticon, error message box, and cloud. Ideal for business loss, mistakes, failure, analytics issues, disappointment error handling or recovery
Free with trial Neon up and down arrows made of glowing particles, blue growth and pink decline indicators, abstract financial direction symbols for trading dashboards, stock market analytics and business infographics. Decrease arrow chart vectors Neon up and down arrows made of glowing particles, blue growth and pink decline indicators, abstract financial direction symbols
Free with trial Two simple icons representing financial market performance, one showing a downward trend and the other an upward trend, both with dollar symbols. Decrease arrow chart vectors Financial graph icons showing market trends up and down. Two simple icons representing financial market performance, one showing a downward trend and the other an upward trend, both with dollar symbols
Free with trial Flat style illustration depicts two dollar coins with green and red arrows, symbolizing financial fluctuations on black background. Decrease arrow chart vectors Up and down arrows with dollar coins on black background. Flat style illustration depicts two dollar coins with green and red arrows, symbolizing financial fluctuations on black background.
Free with trial A clean black and white set of nine vector icons showing growth, decline, stability, and financial trends for business presentations and reports. Decrease arrow chart vectors Economic trend icons set flat design vector illustration. A clean black and white set of nine vector icons showing growth, decline, stability, and financial trends for business presentations and reports.
Free with trial Flat vector illustration displaying a green dollar bill with down arrows signifying economic decline or loss of funds. Decrease arrow chart vectors Dollar bill with down arrows depicting money loss concept. Flat vector illustration displaying a green dollar bill with down arrows signifying economic decline or loss of funds.
Free with trial Modern black and white vector icons showing financial trends, growth, decline, and exchange for business presentations or reports. Decrease arrow chart vectors Financial trend icons set vector illustration flat design. Modern black and white vector icons showing financial trends, growth, decline, and exchange for business presentations or reports
Free with trial Web Browser sale graph down Tool flat icon design isolated on a white background. Decrease arrow chart vectors Web Browser sale graph down Tool flat icon design
Free with trial Interest rate falling down, businessman on percentage sign with falling down. Decrease arrow chart vectors Interest rate falling down, businessman on percentage sign with falling down
Free with trial A professional businessman analyzes private equity portfolio management data on a large screen, evaluating ebitda growth, revenue increase, and cost optimization charts while taking notes. Decrease arrow chart vectors Man Analyzing Financial Charts for Private Equity Portfolio. A professional businessman analyzes private equity portfolio management data on a large screen, evaluating ebitda growth, revenue increase, and cost optimization charts while taking notes
Free with trial Stacked Euro Coins Decline Icon Set: Financial Market Down vol 34476. Decrease arrow chart vectors Stacked Euro Coins Decline Icon Set: Financial Market Down
Free with trial Financial Loss Report Document Icon Set with Downward Trend vol 11427. Decrease arrow chart vectors Financial Loss Report Document Icon Set with Downward Trend
Free with trial Minimalist style gradient blue diagram showing downward trend line graph on black background representing economic decline or loss. Decrease arrow chart vectors Downward trend line graph on black background for infographic. Minimalist style gradient blue diagram showing downward trend line graph on black background representing economic decline or loss.
Free with trial A clean and simple seamless pattern featuring an array of black arrows uniformly pointing downwards on a crisp white background, ideal for various design projects. Decrease arrow chart illustrations Seamless pattern of black downward arrows on white background. A clean and simple seamless pattern featuring an array of black arrows uniformly pointing downwards on a crisp white background, ideal for various design projects.
Free with trial Someone is taking notes, the graph looks down. Decrease arrow chart illustrations Is recording a downward graph. someone is taking notes, the graph looks down
Free with trial A line graph showing a downward trend with two colored lines on a grid background. The graph represents data analysis and statistics. Decrease arrow chart illustrations Downward Trend Line Graph. A line graph showing a downward trend with two colored lines on a grid background. The graph represents data analysis and statistics.
Free with trial Set of icons representing data decline and financial loss business charts graphs arrows isolated. Decrease arrow chart vectors Modern data decline visualization icons with colorful gradient. Set of icons representing data decline and financial loss business charts graphs arrows isolated
Free with trial Financial crisis. Economic collapse. Bankruptcy, economic downturn. Stressed people analyze the financial downturn. Decrease arrow chart vectors Financial crisis. Economic collapse. Bankruptcy, economic downturn. Stressed people analyze the financial downturn
Free with trial Stylized graphic depicts a deceased emoticon with downward-pointing indicators. Flat design against a black background suggesting financial downturn or failure. Decrease arrow chart vectors Deceased Emoticon with Downward Indicators on a Black Background. Stylized graphic depicts a deceased emoticon with downward-pointing indicators. Flat design against a black background suggesting financial downturn or failure.
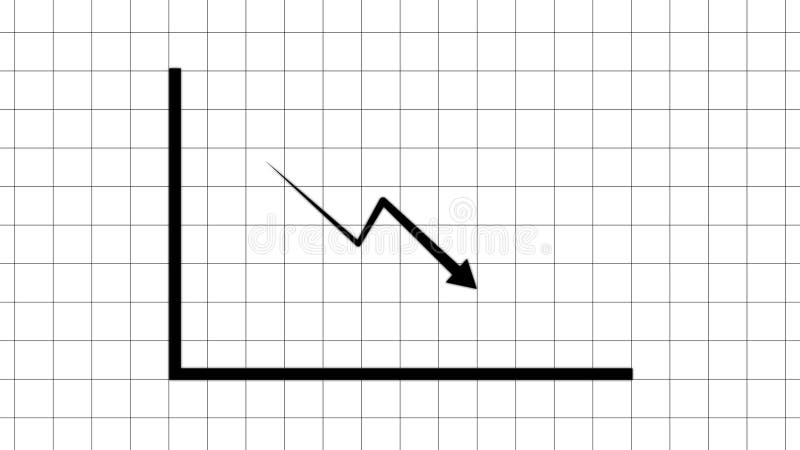
Free with trial A minimalist line graph depicts a significant downward trend with a sharp, jagged line indicating a decline. Decrease arrow chart illustrations Simple line graph illustrating a sharp downward trend and decline. A minimalist line graph depicts a significant downward trend with a sharp, jagged line indicating a decline
Free with trial Economic crisis icon of stock market crash and global financial downturn, line vector. Stock exchange market index fall down with money inflation and devaluation in economic crisis and trade recession. Decrease arrow chart vectors Economic crisis line icon of stock market crash. Economic crisis icon of stock market crash and global financial downturn, line vector. Stock exchange market index fall down with money inflation and devaluation in economic crisis and trade recession
Free with trial Set of sketched icons showing mutual fund nav increases and decreases with indian rupee signs on an alpha transparent base. Decrease arrow chart vectors Mutual fund nav trend sketch icons with rupee symbol alpha transparent. Set of sketched icons showing mutual fund nav increases and decreases with indian rupee signs on an alpha transparent base.
Free with trial Business finance and growth icons illustrating statistics charts trends progress and success. Decrease arrow chart vectors Finance and growth icons showing progress and business performance blue navy. Business finance and growth icons illustrating statistics charts trends progress and success
Free with trial Stairway symbol to reach achievement. Staircase vector icon isolated on white background. The step up to be successful of business. Decrease arrow chart vectors Stairway symbol to reach achievement. Staircase vector icon isolated on white background
Free with trial This image features a collection of various financial and business growth icons. It includes symbols representing money, graphs, charts, and other financial metrics. The icons are colorful and designed to illustrate concepts such as investment, profit, growth, and financial planning. Decrease arrow chart illustrations Financial and business growth icons
Free with trial A bold black line charts a significant downward trajectory, indicating a sharp decline, against a subtle grid. Decrease arrow chart illustrations A jagged downward trend line illustrates a sharp decline on a grid background. A bold black line charts a significant downward trajectory, indicating a sharp decline, against a subtle grid
Free with trial Cost minimising icon isolated on background vector illustration. Decrease arrow chart vectors Cost minimising icon isolated on background
Free with trial A versatile collection of flat vector icons representing key concepts in finance, economics, and security. This comprehensive set includes symbols for market growth, decline, and trends, various currency representations like the Euro and Korean Won, and essential security elements such as open and closed padlocks. Designed with a clean, modern aesthetic, these icons are perfect for enhancing business presentations, financial reports, websites, mobile applications, and infographics, effectively illustrating concepts like investment, market analysis, currency exchange, and data protection. Decrease arrow chart vectors Financial and Security Vector Icon Set. A versatile collection of flat vector icons representing key concepts in finance, economics, and security. This comprehensive set includes symbols for market growth, decline, and trends, various currency representations like the Euro and Korean Won, and essential security elements such as open and closed padlocks. Designed with a clean, modern aesthetic, these icons are perfect for enhancing business presentations, financial reports, websites, mobile applications, and infographics, effectively illustrating concepts like investment, market analysis, currency exchange, and data protection.
Free with trial 3d render of stand holding tablet showing bright red descending graph, isolated on a transparent background. Decrease arrow chart vectors 3d render of stand holding tablet showing bright red descending graph
Free with trial Tech blue and white arrows pointing downward with paper cutout effect and shadow. Abstract vector background. Decrease arrow chart vectors Tech blue and white arrows pointing downward, abstract background. Tech blue and white arrows pointing downward with paper cutout effect and shadow. Abstract vector background
Free with trial Bankruptcy and inflation business, man in depression. Vector of crisis finance bankruptcy, business economy inflation illustration. Decrease arrow chart vectors Bankruptcy and inflation business, man in depression
Free with trial Minimalist icon illustrating decline or downturn in business and finance with contrasting light and dark themes for versatile use. Decrease arrow chart vectors Decline concept with two speech bubbles in light and dark mode minimal design. Minimalist icon illustrating decline or downturn in business and finance with contrasting light and dark themes for versatile use
Free with trial Business balance, opportunity and development concept. Young businessman cartoon character standing and balancing in bar charts vector illustration. Decrease arrow chart vectors Business balance, opportunity and development concept
Free with trial Global RAM Shortage Crisis Impacting Computer Hardware Market and Semiconductor Supply Chain with Declining Performance Trend. Decrease arrow chart vectors Global RAM Shortage Crisis Impacting Computer Hardware Market and Semiconductor Supply Chain
Free with trial Global RAM Shortage Crisis Impacting Computer Hardware Market and Semiconductor Supply Chain with Declining Performance Trend. Decrease arrow chart vectors Global RAM Shortage Crisis Impacting Computer Hardware Market and Semiconductor Supply Chain
Free with trial This abstract illustration depicts the dynamic nature of financial markets, showcasing both significant volatility and an overall upward growth trend. A prominent red line graph indicates positive development, while underlying grey jagged lines and vertical bars represent frequent fluctuations and market uncertainty. To the right, orange up and down arrows symbolize the opposing forces and constant changes within the market. This visual is ideal for conveying concepts related to stock market performance, economic indicators, investment risks, and business analysis. Decrease arrow chart vectors Financial Market Volatility and Growth Trend. This abstract illustration depicts the dynamic nature of financial markets, showcasing both significant volatility and an overall upward growth trend. A prominent red line graph indicates positive development, while underlying grey jagged lines and vertical bars represent frequent fluctuations and market uncertainty. To the right, orange up and down arrows symbolize the opposing forces and constant changes within the market. This visual is ideal for conveying concepts related to stock market performance, economic indicators, investment risks, and business analysis.
Free with trial A comprehensive collection of 12 modern, abstract vector icons designed for business, finance, and data analytics themes. This vibrant set features geometric shapes, upward-trending bar charts, risk indicators, decision-making prompts like "YES" and "NO," and numerical data representations. Perfect for enhancing presentations, reports, websites, mobile applications, and infographics, these versatile symbols convey concepts of growth, strategy, risk management, market analysis, and progress with a clean, contemporary aesthetic. Decrease arrow chart vectors Business and Data Analytics Abstract Icon Set. A comprehensive collection of 12 modern, abstract vector icons designed for business, finance, and data analytics themes. This vibrant set features geometric shapes, upward-trending bar charts, risk indicators, decision-making prompts like "YES" and "NO," and numerical data representations. Perfect for enhancing presentations, reports, websites, mobile applications, and infographics, these versatile symbols convey concepts of growth, strategy, risk management, market analysis, and progress with a clean, contemporary aesthetic.
Free with trial Economy crisis flat composition with human hands holding big coin financial charts symbols and sad people vector illustration. Decrease arrow chart vectors Flat Economy Crisis Composition. Economy crisis flat composition with human hands holding big coin financial charts symbols and sad people vector illustration
Free with trial Dollar Coins with Upward Arrows Representing Financial Growth in Minimalist Flat Style. Decrease arrow chart vectors Dollar Coins with Upward Arrows Representing Financial Growth in Minimalist Flat Style
Free with trial Professional Vector Logo Design High-Resolution & Fully Editable This high-quality vector logo is designed with precision and creativity making it ideal for modern businesses, startups, and creative professionals The design is clean, scalable, and easy to customize�perfect for branding marketing materials, websites, and print applications. Key Features:100% Vector format (AI EPS SVG)Fully editable (colors, text, and shapes)High resolution � perfect for both web and print Modern, professional, and versatile design Ready for branding and promotional use Elevate your brand with this premium quality logo!. Decrease arrow chart vectors Dementia icon editable stock vector logo design. Professional Vector Logo Design High-Resolution & Fully Editable This high-quality vector logo is designed with precision and creativity making it ideal for modern businesses, startups, and creative professionals The design is clean, scalable, and easy to customize�perfect for branding marketing materials, websites, and print applications. Key Features:100% Vector format (AI EPS SVG)Fully editable (colors, text, and shapes)High resolution � perfect for both web and print Modern, professional, and versatile design Ready for branding and promotional use Elevate your brand with this premium quality logo!
Free with trial A comprehensive vector icon set depicting various aspects of online video content creation and social media analytics. This collection includes symbols for growth charts, play buttons, speech bubbles representing comments or chat, subscriber counts, watch time indicators, and percentage-based progress arrows. Ideal for illustrating concepts related to video platforms, digital marketing, content creator dashboards, performance reports, and online engagement strategies. The modern flat design makes it suitable for websites, mobile applications, and presentations. Decrease arrow chart vectors Video Content and Social Media Analytics Icon Set. A comprehensive vector icon set depicting various aspects of online video content creation and social media analytics. This collection includes symbols for growth charts, play buttons, speech bubbles representing comments or chat, subscriber counts, watch time indicators, and percentage-based progress arrows. Ideal for illustrating concepts related to video platforms, digital marketing, content creator dashboards, performance reports, and online engagement strategies. The modern flat design makes it suitable for websites, mobile applications, and presentations.
Free with trial Dollar currency icons set with arrows for financial growth, money loss, exchange and transactions. Vector illustration of money symbols. Decrease arrow chart vectors Dollar currency icons set with arrows for financial growth, money loss, exchange and transactions
Free with trial A stark white line graph depicts a significant downward trend with sharp fluctuations against a dark grid. Decrease arrow chart illustrations Sharp downward trend illustrated by a jagged white line graph on a black grid background. A stark white line graph depicts a significant downward trend with sharp fluctuations against a dark grid
Free with trial Red zigzag line graph with broken arrows pointing up and down. Business metaphor for market volatility and financial crisis. Handdrawn zig zag arrows. Decrease arrow chart vectors Red zigzag line graph with broken arrows pointing up and down. Market volatility and financial crisis. Zig zag arrows. Red zigzag line graph with broken arrows pointing up and down. Business metaphor for market volatility and financial crisis. Handdrawn zig zag arrows
Free with trial This comprehensive vector icon set illustrates various financial market trends, economic indicators, and potential crises. Featuring line graphs, bar charts, pie charts, dollar signs, piggy banks, and warning sirens, the collection uses a striking red and black color palette to depict both growth and decline. Concepts like stock market volatility, investment risks, economic downturns, and business analytics are visually represented. Ideal for financial reports, business presentations, economic news, investment platforms, and educational materials requiring clear and impactful visual communication of market dynamics. Decrease arrow chart vectors Financial Market Trends and Crisis Vector Icons Set. This comprehensive vector icon set illustrates various financial market trends, economic indicators, and potential crises. Featuring line graphs, bar charts, pie charts, dollar signs, piggy banks, and warning sirens, the collection uses a striking red and black color palette to depict both growth and decline. Concepts like stock market volatility, investment risks, economic downturns, and business analytics are visually represented. Ideal for financial reports, business presentations, economic news, investment platforms, and educational materials requiring clear and impactful visual communication of market dynamics.
Free with trial A comprehensive vector icon set featuring essential symbols for business, finance, and data analysis. This collection includes various arrows for indicating growth and decline, wavy lines representing market trends, checkmarks for success or approval, X marks for errors or rejection, stopwatches for time management and efficiency, and stacks of coins with dollar signs for financial concepts. Ideal for presentations, infographics, web design, and reports to visually communicate progress, status, and economic indicators. Decrease arrow chart vectors Business, Finance, and Data Analytics Vector Icon Set. A comprehensive vector icon set featuring essential symbols for business, finance, and data analysis. This collection includes various arrows for indicating growth and decline, wavy lines representing market trends, checkmarks for success or approval, X marks for errors or rejection, stopwatches for time management and efficiency, and stacks of coins with dollar signs for financial concepts. Ideal for presentations, infographics, web design, and reports to visually communicate progress, status, and economic indicators.