Free with trial Metal barrels of oil with green and red arrows. Showing rise and fall of gasoline prices. Fuel costs. Stock market investment. Economy growth or crisis recession. Diesel gallon trade. Vector concept. Decrease arrow chart vectors Metal barrels of oil with green and red arrows. Showing rise and fall of gasoline prices. Stock market investment. Economy growth. Metal barrels of oil with green and red arrows. Showing rise and fall of gasoline prices. Fuel costs. Stock market investment. Economy growth or crisis recession. Diesel gallon trade. Vector concept
Free with trial Set line Falling property prices, Shutdown of factory, Drop crude oil and Global economic crisis news icon. Vector. Decrease arrow chart illustrations Set line Falling property prices, Shutdown of factory, Drop crude oil and Global economic crisis news icon. Vector
Free with trial Illustration of a business activities. Decrease arrow chart vectors Illustration of a business activities
Free with trial A detailed red financial graph illustrates a sharp downward trend in stock prices. Candlestick bars and a wavy line graph show a significant decline, with red arrows reinforcing the negative movement. The dark background features a grid, and a bright light emanates from the left side of the image. Decrease arrow chart illustrations Red Financial Graph with Falling Stock Prices stock market. A detailed red financial graph illustrates a sharp downward trend in stock prices. Candlestick bars and a wavy line graph show a significant decline, with red arrows reinforcing the negative movement. The dark background features a grid, and a bright light emanates from the left side of the image
Free with trial 3D descending sort icon in ocean blue gradient color showing downward order or filter arrangement. Represents data sorting or list sequence. Decrease arrow chart illustrations 3D Ocean Blue Descending Sort Icon on white Background. 3D descending sort icon in ocean blue gradient color showing downward order or filter arrangement. Represents data sorting or list sequence
Free with trial This graphic depicts supply and demand curves balanced by a scale, illustrating economic principles and market equilibrium. It's suitable for business presentations and educational materials. Decrease arrow chart vectors Supply and demand graph with balance scale illustration. This graphic depicts supply and demand curves balanced by a scale, illustrating economic principles and market equilibrium. It's suitable for business presentations and educational materials
Free with trial Colorful vector icons showing graphs charts arrows lightbulb target briefcase for analytics strategy and success. Decrease arrow chart illustrations Illustrated Business Data Analysis and Growth Concepts. Colorful vector icons showing graphs charts arrows lightbulb target briefcase for analytics strategy and success
Free with trial A clean line drawing showcases a magnifying glass focusing on a hand holding a declining bar graph with a downward. Decrease arrow chart illustrations Declining Market Analysis Magnifying Glass on Loss Trend. A clean line drawing showcases a magnifying glass focusing on a hand holding a declining bar graph with a downward.
Free with trial A visual representation of economic downturn, featuring eight identical red arrows, each adorned with a percentage symbol. The arrows are arranged in two rows of four, all directed downwards, suggesting a negative trend in financial markets, sales, or other quantifiable metrics. The gradient on the arrows adds a sense of depth and visual interest to the graphic. Decrease arrow chart illustrations Eight red arrows pointing down with percentage signs symbolizing financial decline. A visual representation of economic downturn, featuring eight identical red arrows, each adorned with a percentage symbol. The arrows are arranged in two rows of four, all directed downwards, suggesting a negative trend in financial markets, sales, or other quantifiable metrics. The gradient on the arrows adds a sense of depth and visual interest to the graphic
Free with trial Minimal glassmorphism arrows pointing up and down representing direction, navigation, or data flow, 3d rendering. Decrease arrow chart vectors Minimal glassmorphism arrows pointing up and down representing direction, navigation, or data flow, 3d rendering
Free with trial Dollar and bitcoin Coins with Upward Arrows Representing Financial Growth in Minimalist Flat Style. Decrease arrow chart vectors Dollar and bitcoin Coins with Upward Arrows Representing Financial Growth in Minimalist Flat Style
Free with trial A black and white line drawing depicts a magnifying glass focusing on a gear, a descending bar graph, and a. Decrease arrow chart illustrations Decline Analysis Magnifying Glass, Gear, and Downward Graph. A black and white line drawing depicts a magnifying glass focusing on a gear, a descending bar graph, and a.
Free with trial E-commerce Sales Decline Visualization , elegant style. Decrease arrow chart illustrations E-commerce Sales Decline Visualization
Free with trial Modern black and white vector icons depicting financial trends like rising, falling, and stable graphs, dollar signs, and investment arrows for business presentations and reports. Decrease arrow chart vectors Financial trend icons vector illustration showing profit loss growth and investment flat design. Modern black and white vector icons depicting financial trends like rising, falling, and stable graphs, dollar signs, and investment arrows for business presentations and reports.
Free with trial A diverse collection of downward-pointing arrows presented against a clean, light grey background. The arrows vary in style, including solid black, outlined, and shaded grey designs. This graphic element is ideal for representing direction, decline, progress, or a list of instructions. Its versatile design makes it suitable for web graphics, presentations, infographics, and print materials. Decrease arrow chart vectors Collection of Downward Arrows in Various Styles. A diverse collection of downward-pointing arrows presented against a clean, light grey background. The arrows vary in style, including solid black, outlined, and shaded grey designs. This graphic element is ideal for representing direction, decline, progress, or a list of instructions. Its versatile design makes it suitable for web graphics, presentations, infographics, and print materials.
Free with trial Economic decline, financial loss, market trends, business analysis, payment reminder, schedule planning. Downward trend graph with sad face icon. Economic decline and financial loss. Decrease arrow chart vectors Economic Decline and Financial Trends with Calendar Reminder and Graph Symbols. Economic decline, financial loss, market trends, business analysis, payment reminder, schedule planning. Downward trend graph with sad face icon. Economic decline and financial loss
Free with trial Black and white graph with dollar signs and decreasing trend line on white background. Decrease arrow chart vectors Black map pin icon with white circle in center. Black and white graph with dollar signs and decreasing trend line on white background
Free with trial Blue Global economic crisis icon isolated on blue background. World finance crisis. Minimalism concept. 3D render illustration. Decrease arrow chart illustrations Blue Global economic crisis icon isolated on blue background. World finance crisis. Minimalism concept. 3D render
Free with trial This illustration depicts a financial concept with a bar graph showing a downward trend, alternating between green (profit) and red (loss) bars. A red line graph with an arrow indicates a significant decline. To the right, a stack of documents represents a profit and loss statement, with 'Profit' and 'Loss' clearly labeled. This visual is ideal for representing financial performance, business challenges, economic downturns, or the need for strategic adjustments. Decrease arrow chart vectors Declining Profit and Loss Statement with Downward Trend Graph. This illustration depicts a financial concept with a bar graph showing a downward trend, alternating between green (profit) and red (loss) bars. A red line graph with an arrow indicates a significant decline. To the right, a stack of documents represents a profit and loss statement, with 'Profit' and 'Loss' clearly labeled. This visual is ideal for representing financial performance, business challenges, economic downturns, or the need for strategic adjustments.
Free with trial 3D Isometric Flat Vector Illustration of Real Estate Investment Risks, Fluctuations In Housing Prices. Decrease arrow chart vectors 3D Isometric Flat Vector Illustration of Real Estate Investment Risks
Free with trial Doodle Graph icon. Blue pen hand drawn infographic symbol on a notepaper piece. Line art style graphic design element. Web button with shadow. Decline, save on expences concept. Decrease arrow chart vectors Doodle Graph icon
Free with trial A vibrant, hand-drawn doodle illustration centered around a large percentage sign. This creative sketch features various financial and business icons, including bar graphs, pie charts, stacks of coins, dollar signs, and arrows indicating growth and decline. The colorful, cartoonish style makes it perfect for illustrating concepts like interest rates, economic trends, business analytics, and financial reports. Ideal for use in presentations, infographics, websites, and educational materials, this vector art is isolated on a white background for versatile application. Decrease arrow chart illustrations Finance and Economy Doodle Illustration. A vibrant, hand-drawn doodle illustration centered around a large percentage sign. This creative sketch features various financial and business icons, including bar graphs, pie charts, stacks of coins, dollar signs, and arrows indicating growth and decline. The colorful, cartoonish style makes it perfect for illustrating concepts like interest rates, economic trends, business analytics, and financial reports. Ideal for use in presentations, infographics, websites, and educational materials, this vector art is isolated on a white background for versatile application.
Free with trial Purple Global economic crisis icon isolated on purple background. World finance crisis. Minimalism concept. 3D render illustration. Decrease arrow chart illustrations Purple Global economic crisis icon isolated on purple background. World finance crisis. Minimalism concept. 3D render
Free with trial A comprehensive vector icon collection illustrating various aspects of financial crises, market downturns, and economic challenges. This set includes symbols like bull and bear market dynamics, broken shields representing risk and vulnerability, declining bar charts, candlestick patterns, and emergency indicators. Concepts such as bankruptcy, recession, financial loss, and market volatility are visually conveyed. Ideal for financial news, economic reports, business presentations, educational materials, and articles discussing market risks or economic forecasts. Decrease arrow chart vectors Financial Crisis, Market Downturn, and Bankruptcy Vector Icons Set. A comprehensive vector icon collection illustrating various aspects of financial crises, market downturns, and economic challenges. This set includes symbols like bull and bear market dynamics, broken shields representing risk and vulnerability, declining bar charts, candlestick patterns, and emergency indicators. Concepts such as bankruptcy, recession, financial loss, and market volatility are visually conveyed. Ideal for financial news, economic reports, business presentations, educational materials, and articles discussing market risks or economic forecasts.
Free with trial Set line Mobile stock trading, Contract money and pen and Global economic crisis on seamless pattern. Vector. Decrease arrow chart illustrations Set line Mobile stock trading, Contract money and pen and Global economic crisis on seamless pattern. Vector
Free with trial Price drop icon. Cost reduction symbol. Oil value Vector. Cheap fuel. EPS 10. Decrease arrow chart vectors Price drop icon. Cost reduction symbol. Oil value Vector. Cheap fuel.
Free with trial People and currency trading, white collar workers vector art. Decrease arrow chart vectors Business Man Showing Rising and Falling Sales Graphs. People and currency trading, white collar workers vector art
Free with trial A collection of simple black glyph icons representing economic downturn, financial loss, bankruptcy, and recession. These icons are suitable for illustrating concepts related to investment risk, market crash, and personal finance issues. Decrease arrow chart vectors Minimalist Black Glyph Economic Crisis and Financial Loss Icon Set. A collection of simple black glyph icons representing economic downturn, financial loss, bankruptcy, and recession. These icons are suitable for illustrating concepts related to investment risk, market crash, and personal finance issues.
Free with trial This infographic features a collection of colorful charts and graphs on a white background, surrounded by arrows pointing in different directions. The image represents business and finance concepts, such as data analysis, statistics, and trends. The vibrant colors and dynamic design make it visually appealing and engaging. Decrease arrow chart vectors A colorful infographic with arrows and charts on a white background. This infographic features a collection of colorful charts and graphs on a white background, surrounded by arrows pointing in different directions. The image represents business and finance concepts, such as data analysis, statistics, and trends. The vibrant colors and dynamic design make it visually appealing and engaging.
Free with trial A person in a suit holding a magnifying glass showing blue upward and red downward percentage arrows. Decrease arrow chart illustrations Person holding magnifying glass with percentage arrows hand blue. A person in a suit holding a magnifying glass showing blue upward and red downward percentage arrows.
Free with trial Economy crisis flat composition with human hands holding calculator and economic recession financial symbols vector illustration. Decrease arrow chart vectors Economy Crisis Composition. Economy crisis flat composition with human hands holding calculator and economic recession financial symbols vector illustration
Free with trial Dollar Coins with Upward and Downward Arrows Representing Financial Growth and Decline in Minimalist Flat Style. Decrease arrow chart vectors Dollar Coins with Upward and Downward Arrows Representing Financial Growth and Decline in Minimalist Flat Style.
Free with trial Financial crisis, business bankruptcy, money loss, and economy collapse concepts. Vector of crisis financial, bankruptcy and recession illustration. Decrease arrow chart vectors Financial crisis, business bankruptcy, money loss, and economy collapse concepts
Free with trial White Global economic crisis icon isolated with long shadow background. World finance crisis. Pink hexagon button. Vector. Decrease arrow chart illustrations White Global economic crisis icon isolated with long shadow background. World finance crisis. Pink hexagon button
Free with trial Sophisticated financial dollar. Professional growth indicators. Economic statistics Vector. Professional currency exchanges. EPS 10. Decrease arrow chart vectors Sophisticated financial dollar. Professional growth indicators. Economic statistics Vector. Professional currency exchanges
Free with trial Bear market business vector concept. Symbol of finance, downturn, trading. Minimal design eps10 illustration. Decrease arrow chart vectors Bear market business vector concept. Symbol of finance, downturn, trading. Minimal illustration
Free with trial Pink Searching for food in trash can on streets outdoors icon isolated on pink background. Homelessness and poverty concept. Minimalism concept. 3D render illustration. Decrease arrow chart illustrations Pink Searching for food in trash can on streets outdoors icon isolated on pink background. Homelessness and poverty
Free with trial This image features a minimalist and modern vector icon of a jagged downward trending line graph, sharply declining from left to right, symbolizing financial loss, economic downturn, or market decline, set against a clean and uncluttered white background suitable for use in presentations, reports, infographics, or digital media to visually communicate negative trends or decreasing performance. Decrease arrow chart illustrations Sharp downward trending line graph icon isolated on white background representing financial loss or market decline vector. This image features a minimalist and modern vector icon of a jagged downward trending line graph, sharply declining from left to right, symbolizing financial loss, economic downturn, or market decline, set against a clean and uncluttered white background suitable for use in presentations, reports, infographics, or digital media to visually communicate negative trends or decreasing performance
Free with trial A bold outline illustration of a computer screen displaying a downward trending line, representing financial loss or negative growth. Decrease arrow chart vectors Bold Outline Computer Screen with Falling Trend Line Icon Illustration. A bold outline illustration of a computer screen displaying a downward trending line, representing financial loss or negative growth.
Free with trial 3d illustration of red decreasing graph on stand, financial presentation representing negative results or economic downturn. Decrease arrow chart vectors 3d illustration of red decreasing graph on stand, financial presentation representing negative results
Free with trial A comprehensive collection of hand-drawn business and data visualization icons. This doodle-style set features a variety of essential elements, including different types of arrows, bar graphs, line charts, and pie charts. The sketchy, black and white illustrations are perfect for infographics, presentations, financial reports, and marketing materials. Each icon is isolated on a white background, representing concepts like growth, statistics, process flow, and direction. This versatile vector set is ideal for adding a creative, hand-made touch to any project related to analytics, finance, or strategy. Decrease arrow chart illustrations Hand Drawn Business and Finance Doodle Icon Set. A comprehensive collection of hand-drawn business and data visualization icons. This doodle-style set features a variety of essential elements, including different types of arrows, bar graphs, line charts, and pie charts. The sketchy, black and white illustrations are perfect for infographics, presentations, financial reports, and marketing materials. Each icon is isolated on a white background, representing concepts like growth, statistics, process flow, and direction. This versatile vector set is ideal for adding a creative, hand-made touch to any project related to analytics, finance, or strategy.
Free with trial Depreciation down graph fail bankruptcy diagram financial business crisis economy vector. Decrease arrow chart vectors Depreciation down graph fail bankruptcy diagram financial business crisis economy
Free with trial This vector illustration set features six distinct icons representing key financial and economic concepts. It includes bar charts depicting growth with a green arrow and decline with a red arrow, alongside currency exchange rate indicators for USD, INR, and EUR. Two donut charts visualize data distribution, while a world map colored green and red signifies global market trends or segmentation. Ideal for business presentations, financial reports, economic analysis, and investment-related content, these versatile graphics convey complex data clearly and concisely. Decrease arrow chart vectors Financial Growth, Decline, and Global Market Data Visualization Icons Set. This vector illustration set features six distinct icons representing key financial and economic concepts. It includes bar charts depicting growth with a green arrow and decline with a red arrow, alongside currency exchange rate indicators for USD, INR, and EUR. Two donut charts visualize data distribution, while a world map colored green and red signifies global market trends or segmentation. Ideal for business presentations, financial reports, economic analysis, and investment-related content, these versatile graphics convey complex data clearly and concisely.
Free with trial Up Down Pointer Icon Scroll Gesture Point Pointing Page Upward Downward Navigation Direction Swipe North South Sign Symbol Graphic Illustration Path. Decrease arrow chart vectors Up Down Pointer Icon Scroll Gesture Point Pointing Page Upward Downward Navigation Direction Swipe North South
Free with trial Combining love growth and decline charts, symbolizing relationship ups and downs. Perfect for dating, counseling, and emotional data visualization projects. Decrease arrow chart vectors Combining love growth and decline charts, symbolizing relationship ups and downs. Perfect for dating, counseling, and emotional
Free with trial A comprehensive collection of cartoon-style vector icons illustrating key financial and economic concepts. This set includes symbols for market decline, payment processing, bull and bear market dynamics, investment analysis, global currencies, financial balance, and rising interest rates. Ideal for use in business presentations, financial reports, banking websites, educational materials, or any project related to economics and investment. Decrease arrow chart vectors Financial and Economic Icons Set. A comprehensive collection of cartoon-style vector icons illustrating key financial and economic concepts. This set includes symbols for market decline, payment processing, bull and bear market dynamics, investment analysis, global currencies, financial balance, and rising interest rates. Ideal for use in business presentations, financial reports, banking websites, educational materials, or any project related to economics and investment.
Free with trial Crisis inflation causes increase in expenses for man walking along increasing negative schedule. Financial recession and inflation cause depression in bankrupt businessman in need of help. Decrease arrow chart vectors Crisis inflation causes increase in expenses for man walking along increasing negative schedule
Free with trial Team Collaboration on Real Estate Strategy with Finance Charts and House Icon, Representing Property Investment Opportunities and Market Analysis Sigmoid. Decrease arrow chart illustrations Professional team working together on real estate strategies with finance insights and graphics, focusing on investment. Team Collaboration on Real Estate Strategy with Finance Charts and House Icon, Representing Property Investment Opportunities and Market Analysis Sigmoid
Free with trial Collection of business growth and financial analysis icons featuring bar charts and arrows with editable line art and flat shape style. Editable vector icon set. Decrease arrow chart vectors Collection of business growth and financial analysis icons featuring bar charts and arrows with editable line art and flat shape
Free with trial Stylized data illustrates financial increase using dollar signs, bar graphs, and arrows. Some data trends down while other data trends up, showing potential profits and losses. Decrease arrow chart illustrations Stock Market Data Shows Economic Growth and Potential Loss in the Future. Stylized data illustrates financial increase using dollar signs, bar graphs, and arrows. Some data trends down while other data trends up, showing potential profits and losses.
Free with trial Economic critical crisis concept. The bar garph on red background. Recession financial, cryptocurrency, gold, and the stock market. Losing money and cash. Bearish. Decrease arrow chart vectors Economic critical crisis concept. The bar garph on red background. Recession financial, cryptocurrency, gold, and the stock market
Free with trial Basic charts line icon set. Bar diagram, pie and histogram graph. Data visualization, growth and distribution analysis for business and finance. Vector illustration Editable Stroke. Decrease arrow chart illustrations Basic charts line icon set. Bar diagram, pie and histogram graph. Data visualization, growth and distribution analysis
Free with trial A woman is working on a laptop analyzing a digital graph that shows cost reduction for a successful business model She is using a pen to focus on the downward trend highlighting the strategy and financial planning for efficiency and growth This highlights digital transformation for effective business analysis and future cost management. Decrease arrow chart illustrations Cost Reduction Strategy Digital Transformation Business Analysis and Financial Planning for Success. A woman is working on a laptop analyzing a digital graph that shows cost reduction for a successful business model She is using a pen to focus on the downward trend highlighting the strategy and financial planning for efficiency and growth This highlights digital transformation for effective business analysis and future cost management
Free with trial Up and down directional arrows in vector format for versatile use. Perfect for business infographics and data visualization. EPS 10. Decrease arrow chart vectors Up and down directional arrows in vector format for versatile use. Perfect for business infographics and data visualization.
Free with trial Illustration of a business activities. Decrease arrow chart vectors Illustration of a business activities
Free with trial Illustration of a business activities. Decrease arrow chart vectors Illustration of a business activities
Free with trial Illustration of a business activities. Decrease arrow chart vectors Illustration of a business activities
Free with trial Illustration of a business activities. Decrease arrow chart vectors Illustration of a business activities
Free with trial Illustration of a business activities. Decrease arrow chart vectors Illustration of a business activities
Free with trial Illustration of a business activities. Decrease arrow chart vectors Illustration of a business activities
Free with trial Illustration of a business activities. Decrease arrow chart vectors Illustration of a business activities
Free with trial Illustration of a business activities. Decrease arrow chart vectors Illustration of a business activities
Free with trial Illustration of a business activities. Decrease arrow chart vectors Illustration of a business activities
Free with trial Illustration of a business activities. Decrease arrow chart illustrations Illustration of a business activities
Free with trial A downward trend is shown on a graph. The graph is black and white. Decrease arrow chart illustrations A downward trend is shown on a graph
Free with trial Set line Shutdown of factory, Bank building, Global economic crisis news and Stop delivery cargo truck icon. Vector. Decrease arrow chart illustrations Set line Shutdown of factory, Bank building, Global economic crisis news and Stop delivery cargo truck icon. Vector
Free with trial Set of six black business charts icons showing growth and decline trends with arrows and bars in vector style clear and simple design calm. Generative AI. Decrease arrow chart vectors Business growth and decline charts arrows statistics bar graph icons vector illustration. Set of six black business charts icons showing growth and decline trends with arrows and bars in vector style clear and simple design calm. Generative AI
Free with trial A visual representation of declining trends, depicted by a graph with red and blue lines moving downwards, symbolizing a negative trajectory or market shift. Decrease arrow chart illustrations Downward trending graph with word trends. A visual representation of declining trends, depicted by a graph with red and blue lines moving downwards, symbolizing a negative trajectory or market shift
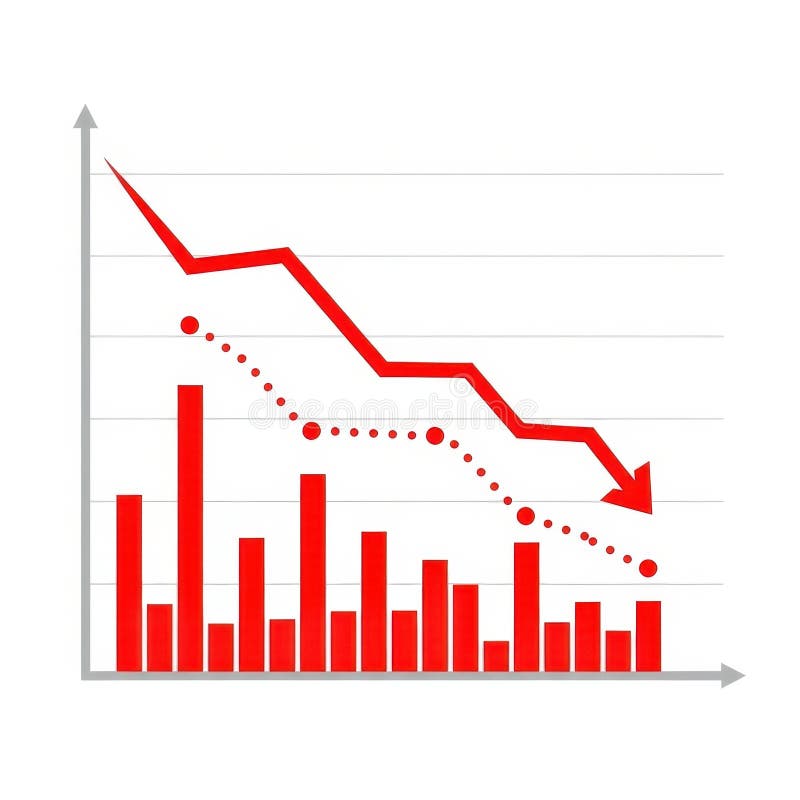
Free with trial A visual representation of negative financial performance. It features red bars and a red line graph showing a downward trend, accompanied by a dotted line indicating a similar pattern. Decrease arrow chart illustrations Red downward trending graph with bars and dotted line. A visual representation of negative financial performance. It features red bars and a red line graph showing a downward trend, accompanied by a dotted line indicating a similar pattern
Free with trial This illustration shows a downward trend for the US dollar and an upward trend for the Japanese Yen, generated by AI. The graphic uses stylized gold coins with currency symbols and directional arrows to clearly visualize the contrasting market movements. Decrease arrow chart illustrations USD vs. Yen: Currency Fluctuation. This illustration shows a downward trend for the US dollar and an upward trend for the Japanese Yen, generated by AI. The graphic uses stylized gold coins with currency symbols and directional arrows to clearly visualize the contrasting market movements.
Free with trial Financial arrows up and down. Financial growth and decline. Graph with green and red arrows. Finance diagram, graphic charts icon set. Decrease arrow chart vectors Financial arrows up and down. Financial growth and decline. Graph with green and red arrows. Finance diagram, graphic charts icon
Free with trial Downward Business Graph with Arrows Financial Loss and Market Decline Concept. Decrease arrow chart vectors Downward Business Graph with Arrows Financial Loss and Market Decline Concept
Free with trial 3D rendered graphic showing the word Finance in bold black letters with a green upward trending arrow above and a red downward trending arrow below, flanked by blue opposing arrows on a grid background. Decrease arrow chart illustrations Finance growth upward trend with opposing arrows image. 3D rendered graphic showing the word Finance in bold black letters with a green upward trending arrow above and a red downward trending arrow below, flanked by blue opposing arrows on a grid background
Free with trial A silver laptop sits on a light brown wooden surface. Its screen displays a dark background with a grid pattern and a prominent red line graph sharply declining from left to right. The red line is brightly lit, creating a strong visual contrast against the dark background. The overall mood is one of concern or warning, suggesting a negative trend or decline. The image is clean and simple, focusing, generated by AI. Decrease arrow chart illustrations Laptop Screen Showing Red Downward Trend Graph computer. A silver laptop sits on a light brown wooden surface. Its screen displays a dark background with a grid pattern and a prominent red line graph sharply declining from left to right. The red line is brightly lit, creating a strong visual contrast against the dark background. The overall mood is one of concern or warning, suggesting a negative trend or decline. The image is clean and simple, focusing, generated by AI.
Free with trial Data Stats Board Display Line Icon Downward Down Trend Statistic Performance Market Decline Economy Downturn Bar Graph Progress Outline Presentation. Decrease arrow chart vectors Data Stats Board Display Line Icon Downward Down Trend Statistic Performance Market Decline Economy Downturn Bar Graph
Free with trial A visual creation that highlights a balanced composition with interesting details and style, presenting a harmonious and aesthetic blend of elements, suitable for various creative purposes. Decrease arrow chart vectors Colorful vector icons depicting growth, flow, and transition. A visual creation that highlights a balanced composition with interesting details and style, presenting a harmonious and aesthetic blend of elements, suitable for various creative purposes.
Free with trial This vector illustration shows a set of black graph icons with rising and falling charts indicated by arrows showing trends in data with clear simple design and sharp edges calm. Generative AI. Decrease arrow chart vectors Black graph icons set rising and falling charts with arrows vector illustration simple design. This vector illustration shows a set of black graph icons with rising and falling charts indicated by arrows showing trends in data with clear simple design and sharp edges calm. Generative AI
Free with trial An image showcasing four different graphical representations of financial trends using arrows and lines on grid backgrounds. Decrease arrow chart illustrations Graphical representation of financial trends isolated on transparent background. An image showcasing four different graphical representations of financial trends using arrows and lines on grid backgrounds