Free with trial This vector illustration features a comprehensive set of modern infographic and decision-making elements, isolated on a clean white background with subtle reflections. The collection includes stylized casino chips marked "YES" and "NO" for choices, various bar charts depicting growth and data, and segmented donut pie charts representing proportions. An abstract 3D shape adds a contemporary touch. Ideal for presentations, business reports, websites, and applications requiring visual representation of data, statistics, polls, and strategic decisions in a clean, professional design. Decrease bar vectors Business Infographics and Decision Making Elements Set. This vector illustration features a comprehensive set of modern infographic and decision-making elements, isolated on a clean white background with subtle reflections. The collection includes stylized casino chips marked "YES" and "NO" for choices, various bar charts depicting growth and data, and segmented donut pie charts representing proportions. An abstract 3D shape adds a contemporary touch. Ideal for presentations, business reports, websites, and applications requiring visual representation of data, statistics, polls, and strategic decisions in a clean, professional design.
Free with trial A white background hosts two prominent 3D rendered thermometers, one red for "HOT" and one blue for "COLD," displaying contrasting temperature levels. Various weather are scattered around them, including suns, clouds with rain, and a snowflake. To the left, red up and down arrows signify rising and falling trends, while to the right, a bar graph with red and blue bars data or statistics,. Decrease bar illustrations Hot and cold thermometers with weather and up down arrows. A white background hosts two prominent 3D rendered thermometers, one red for "HOT" and one blue for "COLD," displaying contrasting temperature levels. Various weather are scattered around them, including suns, clouds with rain, and a snowflake. To the left, red up and down arrows signify rising and falling trends, while to the right, a bar graph with red and blue bars data or statistics,
Free with trial A collection of eight black icons featuring robot heads and bar graphs within speech bubbles, symbolizing data analysis and AI communication. Decrease bar vectors Set of eight black icons representing robots and data analysis white. A collection of eight black icons featuring robot heads and bar graphs within speech bubbles, symbolizing data analysis and AI communication
Free with trial A collection of nine flat vector icons for data visualization including bar graphs, line charts, pie charts, and performance meters isolated on a white background. Decrease bar vectors Simple black data analysis and business chart icon set. A collection of nine flat vector icons for data visualization including bar graphs, line charts, pie charts, and performance meters isolated on a white background
Free with trial Simple Bar Chart Showing Business Growth and Data Trends. Decrease bar vectors Simple Bar Chart Showing Business Growth and Data Trends
Free with trial Simple line art business icons set featuring a magnifying glass, minus symbol, pie chart, and rising bar graph for financial data analysis. Decrease bar illustrations Simple line art business icons set featuring a magnifying glass, minus symbol, pie chart, and rising bar graph for
Free with trial Laptop displaying a bar chart indicating growth and analysis ,Generative ai. Decrease bar illustrations Laptop with bar chart, visualizing growth, analysis, and business trends. Laptop displaying a bar chart indicating growth and analysis ,Generative ai
Free with trial This scientific infographic presents astrophysical data visualization on a dark blue background with elegant gold border, featuring a prominent black hole labeled Galaxy Mass with 10X Decrease notation on the left side, accompanied by two smaller black holes below labeled Black Hole Mass and 100x Decrease respectively, while the right side displays analytical graphs including a bar graph showing. Decrease bar illustrations Scientific infographic showing galaxy mass decreasing tenfold with black hole mass decreasing one hundred times on dark blue. This scientific infographic presents astrophysical data visualization on a dark blue background with elegant gold border, featuring a prominent black hole labeled Galaxy Mass with 10X Decrease notation on the left side, accompanied by two smaller black holes below labeled Black Hole Mass and 100x Decrease respectively, while the right side displays analytical graphs including a bar graph showing
Free with trial A dynamic black and white background pattern featuring a collection of hand-drawn financial and economic elements. The design includes various currency symbols like the Dollar, Euro, and Yen, alongside upward and downward arrows, zig-zag lines representing market volatility, and simple bar charts indicating growth or decline. Scattered ink splatters add a grunge, artistic touch to the overall composition. This versatile illustration is ideal for conveying concepts related to global finance, business trends, investment, stock market fluctuations, economic data, and wealth management in a creative and engaging way. Decrease bar vectors Hand Drawn Financial Market Elements Background Pattern. A dynamic black and white background pattern featuring a collection of hand-drawn financial and economic elements. The design includes various currency symbols like the Dollar, Euro, and Yen, alongside upward and downward arrows, zig-zag lines representing market volatility, and simple bar charts indicating growth or decline. Scattered ink splatters add a grunge, artistic touch to the overall composition. This versatile illustration is ideal for conveying concepts related to global finance, business trends, investment, stock market fluctuations, economic data, and wealth management in a creative and engaging way.
Free with trial The image features a 3D bar graph with a declining trend, represented by a red arrow pointing downwards. The bars are blue and increase in height from left to right, indicating an initial rise followed by a sharp decrease. The entire scene is set against a clean, white background, making the graph and arrow stand out prominently. This image is suitable for illustrating concepts related to. Decrease bar illustrations Graph with declining trend isolated on white background. The image features a 3D bar graph with a declining trend, represented by a red arrow pointing downwards. The bars are blue and increase in height from left to right, indicating an initial rise followed by a sharp decrease. The entire scene is set against a clean, white background, making the graph and arrow stand out prominently. This image is suitable for illustrating concepts related to
Free with trial A 3D white cloud floats above a series of decreasing tealcolored bars on a teal background The bars decrease in size from left to right The cloud consists of multiple rounded shapes The background is a uniform teal color. Decrease bar illustrations 3D cloud floating above decreasing teal bar chart graph. A 3D white cloud floats above a series of decreasing tealcolored bars on a teal background The bars decrease in size from left to right The cloud consists of multiple rounded shapes The background is a uniform teal color.
Free with trial This 3D rendering illustrates the dynamic journey of financial markets. It depicts a series of bar graphs on a dark, reflective surface, showcasing different stages of economic activity. From steady growth and fluctuating upward trends, the visualization culminates in a dramatic market collapse, where a tall bar graph shatters into pieces. This powerful image represents concepts of business success, market volatility, economic downturns, and financial crises, making it ideal for reports, presentations, and articles on investment risks and market analysis. Decrease bar illustrations Financial Market Dynamics: Growth, Volatility, and Collapse. This 3D rendering illustrates the dynamic journey of financial markets. It depicts a series of bar graphs on a dark, reflective surface, showcasing different stages of economic activity. From steady growth and fluctuating upward trends, the visualization culminates in a dramatic market collapse, where a tall bar graph shatters into pieces. This powerful image represents concepts of business success, market volatility, economic downturns, and financial crises, making it ideal for reports, presentations, and articles on investment risks and market analysis.
Free with trial Business analytics concept showing quality up and cost down balance with rising and falling bar graph over keyboard. Financial performance analysis data , profit optimization and business decision. Decrease bar illustrations Business analytics concept showing quality up and cost down balance with rising and falling bar graph over keyboard. Financial
Free with trial The image features a set of four clear glasses in various sizes arranged in a row. The glasses are empty and have a simple, classic design. The largest glass is on the far left, and the glasses gradually decrease in size to the right. Decrease bar illustrations A set of four clear glasses in various sizes arranged in a row
Free with trial This image features a collection of various black and white icons representing statistical graphics and charts. The icons include bar graphs, line graphs, and pie charts. The central image is a composite of a bar graph with an upward trending line graph and a pie chart. Surrounding this central image are smaller icons of similar graphs and charts. Decrease bar illustrations Collection of black and white statistical graphics and charts. This image features a collection of various black and white icons representing statistical graphics and charts. The icons include bar graphs, line graphs, and pie charts. The central image is a composite of a bar graph with an upward trending line graph and a pie chart. Surrounding this central image are smaller icons of similar graphs and charts
Free with trial The image shows two bar charts side by side, each representing different financial trends. The chart on the left, depicted in green, shows an upward trend with increasing bar heights and an upward-pointing arrow, indicating growth. The chart on the right, depicted in red, shows a downward trend with decreasing bar heights and a downward-pointing arrow, indicating decline. Both charts use a 3D. Decrease bar illustrations Contrasting trends in financial growth and decline charts. The image shows two bar charts side by side, each representing different financial trends. The chart on the left, depicted in green, shows an upward trend with increasing bar heights and an upward-pointing arrow, indicating growth. The chart on the right, depicted in red, shows a downward trend with decreasing bar heights and a downward-pointing arrow, indicating decline. Both charts use a 3D
Free with trial Illustration of a bar chart showing a downward trend with a red arrow pointing to a star. The bars decrease in height from left to right, transitioning through various colors. The chart visually represents a decline in value or performance. Decrease bar illustrations Declining bar chart with star isolated on white background. Illustration of a bar chart showing a downward trend with a red arrow pointing to a star. The bars decrease in height from left to right, transitioning through various colors. The chart visually represents a decline in value or performance
Free with trial A comprehensive set of financial and data visualization icons, perfect for illustrating business and economic concepts. This collection includes a growing bar chart with an upward trend, a declining bar chart with a downward trend, and a mixed bar chart. Also featured are stacks of global currencies (USD, Euro, INR), a segmented pie chart, and a world map colored green and red to signify global market conditions or data distribution. Ideal for presentations, reports, websites, and educational materials related to economics, finance, and market analysis. Decrease bar vectors Global Financial and Business Data Visualization Icons Set. A comprehensive set of financial and data visualization icons, perfect for illustrating business and economic concepts. This collection includes a growing bar chart with an upward trend, a declining bar chart with a downward trend, and a mixed bar chart. Also featured are stacks of global currencies (USD, Euro, INR), a segmented pie chart, and a world map colored green and red to signify global market conditions or data distribution. Ideal for presentations, reports, websites, and educational materials related to economics, finance, and market analysis.
Free with trial A simple line drawing depicts a person presenting a declining bar chart on a whiteboard, viewed through a magnifying. Decrease bar illustrations Decline Analysis Magnifying Glass on Falling Chart, Business. A simple line drawing depicts a person presenting a declining bar chart on a whiteboard, viewed through a magnifying.
Free with trial A magnifying glass focuses on a bar graph showing a downward trend, combined with a puzzle piece element, symbolizing a. Decrease bar illustrations Decline Analysis Magnifying Glass, Puzzle, and Downward Trend. A magnifying glass focuses on a bar graph showing a downward trend, combined with a puzzle piece element, symbolizing a.
Free with trial Icons representing financial growth, decline, and trends. Perfect for business presentations and data visualization design. Decrease bar illustrations Four business growth and decline bar chart icons with arrows. Icons representing financial growth, decline, and trends. Perfect for business presentations and data visualization design
Free with trial A pen rests on piece of paper with bar chart, suggesting data analysis, business planning, or financial reporting ,Generative ai. Decrease bar illustrations Pen and paper with bar chart, a visual representation of data analysis. A pen rests on piece of paper with bar chart, suggesting data analysis, business planning, or financial reporting ,Generative ai
Free with trial A vector illustration of an economic calendar on a white background. The calendar grid shows dates with various financial icons, including bar charts and colorful up and down arrows, symbolizing market trends and volatility. This graphic represents the tracking of important economic events, financial data analysis, and investment planning. It's an ideal concept for topics related to stock market trading, finance, business strategy, economic forecasting, and investment reports. The clean, modern design is perfect for presentations, websites, and financial news articles. Decrease bar vectors Economic Calendar for Financial Market Analysis and Trading. A vector illustration of an economic calendar on a white background. The calendar grid shows dates with various financial icons, including bar charts and colorful up and down arrows, symbolizing market trends and volatility. This graphic represents the tracking of important economic events, financial data analysis, and investment planning. It's an ideal concept for topics related to stock market trading, finance, business strategy, economic forecasting, and investment reports. The clean, modern design is perfect for presentations, websites, and financial news articles.
Free with trial This image is a bar chart titled 'Decline Chart' showing the decline of a certain metric over a range. The x-axis represents different intervals, while the y-axis represents the quantity, ranging from 0 to 1000. There are three different data series represented by different colors: dark blue for 'Etb,' gray for 'Decline,' and orange for 'Dec Chart. ' Each interval on the x-axis shows a decline in. Decrease bar illustrations Visual representation of data decline over a specific range. This image is a bar chart titled 'Decline Chart' showing the decline of a certain metric over a range. The x-axis represents different intervals, while the y-axis represents the quantity, ranging from 0 to 1000. There are three different data series represented by different colors: dark blue for 'Etb,' gray for 'Decline,' and orange for 'Dec Chart.' Each interval on the x-axis shows a decline in
Free with trial A clear, minimalist vector illustration featuring two distinct directional icons against a clean white background. On the left, a green downward-pointing triangle is paired with four green horizontal rounded bars, symbolizing download, collapse, or a decrease. On the right, a red upward-pointing triangle is combined with four red horizontal rounded bars, representing upload, expand, or an increase. These graphic elements are ideal for user interface design, web applications, mobile apps, presentations, or any project requiring clear visual indicators for data transfer, status, or directional actions. Decrease bar vectors Download and Upload Icons: Green Down, Red Up Arrows with Bars. A clear, minimalist vector illustration featuring two distinct directional icons against a clean white background. On the left, a green downward-pointing triangle is paired with four green horizontal rounded bars, symbolizing download, collapse, or a decrease. On the right, a red upward-pointing triangle is combined with four red horizontal rounded bars, representing upload, expand, or an increase. These graphic elements are ideal for user interface design, web applications, mobile apps, presentations, or any project requiring clear visual indicators for data transfer, status, or directional actions.
Free with trial A line drawing depicting a water drop and a declining bar graph under a magnifying glass, symbolizing a water crisis. Decrease bar illustrations Water Crisis Analysis Decreasing Water Level Under Magnifying Glass. A line drawing depicting a water drop and a declining bar graph under a magnifying glass, symbolizing a water crisis.
Free with trial This image showcases a variety of editable vector icons related to business and finance. The icons include different types of graphs, charts, and gauges. There are line graphs, bar graphs, pie charts, and speedometer-style gauges. Each icon is depicted in a simple, clean line art style, making them easy to edit and incorporate into various design projects. Decrease bar illustrations Collection of editable vector icons for business and finance. This image showcases a variety of editable vector icons related to business and finance. The icons. This image showcases a variety of editable vector icons related to business and finance. The icons include different types of graphs, charts, and gauges. There are line graphs, bar graphs, pie charts, and speedometer-style gauges. Each icon is depicted in a simple, clean line art style, making them easy to edit and incorporate into various design projects
Free with trial Bar chart and red arrow indicate a negative trend and economic recession. Represents financial crisis and business loss. Decrease bar vectors Financial graph showing declining sales and economic downturn. Bar chart and red arrow indicate a negative trend and economic recession. Represents financial crisis and business loss
Free with trial The image shows a bar chart with progressively shorter bars from left to right, indicating a downward trend. A bold red arrow points diagonally from the top left to the bottom right, emphasizing the decline. Decrease bar illustrations Graphic illustrating a declining trend with a downward red arrow. The image shows a bar chart with progressively shorter bars from left to right, indicating a downward trend. A bold red arrow points diagonally from the top left to the bottom right, emphasizing the decline
Free with trial A simple line drawing depicts a magnifying glass focusing on a declining bar chart with a downward arrow and zig-zag. Decrease bar illustrations Declining Market Analysis Magnifying Glass, Downward Trend Chart. A simple line drawing depicts a magnifying glass focusing on a declining bar chart with a downward arrow and zig-zag.
Free with trial The image displays a series of nine rectangular blocks arranged in descending order of height. Each block is a different color, transitioning from green at the tallest to red at the shortest. The visual representation emphasizes a gradient decrease in height, suggesting a decline or comparison metric. The blocks are uniformly spaced and have a sleek, modern design, making them suitable for use in. Decrease bar illustrations Colorful descending bar chart visualization with vibrant blocks. The image displays a series of nine rectangular blocks arranged in descending order of height. Each block is a different color, transitioning from green at the tallest to red at the shortest. The visual representation emphasizes a gradient decrease in height, suggesting a decline or comparison metric. The blocks are uniformly spaced and have a sleek, modern design, making them suitable for use in
Free with trial Abstract bar graph showing downward trend in neutral color palette. Decrease bar illustrations Abstract bar graph showing downward trend in neutral color palette
Free with trial A data visualization bar graph displays three vertical bars arranged horizontally showing the relationship between positive and negative values with green bars representing positive data points on the left, orange and red bars indicating negative values in the middle, all set against a soft gradient background blending light green and pink tones with a central white square containing the word. Decrease bar illustrations Bar graph showing positive and negative values comparison with green and red colored vertical bars on gradient background. A data visualization bar graph displays three vertical bars arranged horizontally showing the relationship between positive and negative values with green bars representing positive data points on the left, orange and red bars indicating negative values in the middle, all set against a soft gradient background blending light green and pink tones with a central white square containing the word
Free with trial A collection of nine black depicting various business charts and graphs including bar charts pie charts and line graphs against a white background. Decrease bar vectors Set of black business analytics and data charts graph statistics. A collection of nine black depicting various business charts and graphs including bar charts pie charts and line graphs against a white background
Free with trial Bar chart with a downward trending orange arrow indicating decline. Decrease bar vectors Bar chart with a downward trending orange arrow indicating decline
Free with trial Modern laptop shows real time financial data analytics with line graphs bar charts and a pie chart. Decrease bar illustrations Laptop Screen Displaying Live Business Data Charts and Analytics. Modern laptop shows real time financial data analytics with line graphs bar charts and a pie chart
Free with trial Hand Drawn Bar Chart Demonstrating Negative Trend with Downward Arrow. Decrease bar vectors Hand Drawn Bar Chart Demonstrating Negative Trend with Downward Arrow
Free with trial Declining bar graph with downward arrow icon hand drawn illustration. Decrease bar vectors Declining bar graph with downward arrow icon hand drawn illustration
Free with trial Hand drawn bar chart illustrating a downward trend with a large arrow. Decrease bar vectors Hand drawn bar chart illustrating a downward trend with a large arrow
Free with trial A bar graph with a red line showing a downward trend, indicating a consistent decrease in values over time. Decrease bar illustrations Graph illustrating a steady decline in data over a period of time. A bar graph with a red line showing a downward trend, indicating a consistent decrease in values over time
Free with trial The image illustrates a descending trend using a series of progressively shorter vertical bars. A bold red downward-sloping arrow emphasizes the decline, suggesting a significant drop in values or performance over time. This visual metaphor is often used in business, finance, and analytics to depict negative growth or reduction. Decrease bar illustrations Decline in performance represented by bar chart and downward arrow. The image illustrates a descending trend using a series of progressively shorter vertical bars. A bold red downward-sloping arrow emphasizes the decline, suggesting a significant drop in values or performance over time. This visual metaphor is often used in business, finance, and analytics to depict negative growth or reduction
Free with trial The image shows a set of adjustable dumbbells featuring a central metal bar with rotating collars and multiple rubber-coated weight plates. The weights appear to be designed for easy modification to increase or decrease resistance during workouts, suitable for strength training and fitness routines. Decrease bar illustrations Pair of adjustable dumbbells with rubberized weights and metal bar. The image shows a set of adjustable dumbbells featuring a central metal bar with rotating collars and multiple rubber-coated weight plates. The weights appear to be designed for easy modification to increase or decrease resistance during workouts, suitable for strength training and fitness routines
Free with trial A blue line drop-down with red bar chart on a white background. Businese concept. Decrease bar vectors A blue line drop-down with red bar chart on white background. Business concept
Free with trial The image displays a series of blocks in a gradient of colors from yellow to purple, arranged in a descending order of height. The blocks decrease in size progressively, forming a visual representation of a gradient bar chart. Decrease bar illustrations Graduated colorful blocks arranged in a descending height sequence. The image displays a series of blocks in a gradient of colors from yellow to purple, arranged in a descending order of height. The blocks decrease in size progressively, forming a visual representation of a gradient bar chart
Free with trial A 3d rendering of a yellow toy man standing on a green platform looking at a series of pink and red blocks of various heights arranged in a bar graph style with a red downward trend line. Decrease bar illustrations A yellow toy man looking at a pink and red graph with a downward trend. a 3d rendering of a yellow toy man standing on a green platform looking at a series of pink and red blocks of various heights arranged in a bar graph style with a red downward trend line
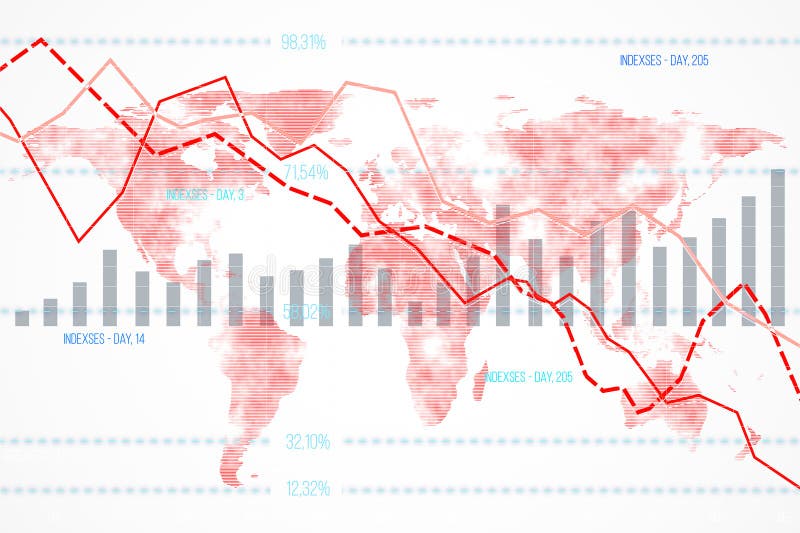
Free with trial Financial data chart featuring declining indexes and bar graphs overlaid on a world map background. Concept of global economic downturn. 3D Rendering. Decrease bar illustrations Financial data chart with declining indexes on a world map background. 3D Rendering. Financial data chart featuring declining indexes and bar graphs overlaid on a world map background. Concept of global economic downturn. 3D Rendering
Free with trial The image shows a bar chart with a downward trend line overlaid in red, indicating a decline. A green dollar symbol is positioned at the end of the chart, suggesting a connection to financial loss or decreasing revenue. Decrease bar illustrations Graphic depicting a declining financial trend with a dollar symbol. The image shows a bar chart with a downward trend line overlaid in red, indicating a decline. A green dollar symbol is positioned at the end of the chart, suggesting a connection to financial loss or decreasing revenue
Free with trial The image depicts a bar graph with a series of red vertical bars that decrease in height from left to right, indicating a downward trend. A large red arrow, outlined in white, points diagonally downward and to the right, emphasizing the decline. Decrease bar illustrations A downward trend graph with a prominent red arrow indicating decline. The image depicts a bar graph with a series of red vertical bars that decrease in height from left to right, indicating a downward trend. A large red arrow, outlined in white, points diagonally downward and to the right, emphasizing the decline
Free with trial A sophisticated 3D rendered bar graph composed of multiple vertical blue glass bars arranged in a line with varying heights, where the tallest bar appears at the bottom right side and the shortest bars are positioned at the top left, creating a visually striking data visualization against a clean white background that emphasizes the transparent glass-like material and realistic lighting effects. Decrease bar illustrations 3D rendered blue glass bar graph showing data visualization with vertical columns of varying heights on white background. A sophisticated 3D rendered bar graph composed of multiple vertical blue glass bars arranged in a line with varying heights, where the tallest bar appears at the bottom right side and the shortest bars are positioned at the top left, creating a visually striking data visualization against a clean white background that emphasizes the transparent glass-like material and realistic lighting effects
Free with trial A series of colorful bars representing a graph, each with water droplets, illuminated by a spotlight against a dark background with blurred city lights. Decrease bar illustrations Colorful bar graph with water droplets under a spotlight on a dark background with bokeh city lights. A series of colorful bars representing a graph, each with water droplets, illuminated by a spotlight against a dark background with blurred city lights
Free with trial A 3D bar chart with white bars and red bases shows a downward trend. A thick red arrow points downwards across the grid background. Isolated on white. Decrease bar illustrations 3 D red arrow graph chart showing decline on white background image. A 3D bar chart with white bars and red bases shows a downward trend. A thick red arrow points downwards across the grid background. Isolated on white
Free with trial The image features a collection of colorful chart icons, including bar graphs, line graphs, and pie charts, symbolizing data analysis, business growth, and financial performance. Decrease bar illustrations Colorful chart icons representing data analysis and business growth. The image features a collection of colorful chart icons, including bar graphs, line graphs, and pie charts, symbolizing data analysis, business growth, and financial performance
Free with trial A hand places a block on a decreasing bar graph, symbolizing cost reduction, with a magnifying glass highlighting the word COST. Decrease bar illustrations Cost Reduction Strategy Illustrated with Blocks and Magnifying Glass. A hand places a block on a decreasing bar graph, symbolizing cost reduction, with a magnifying glass highlighting the word COST
Free with trial The image depicts a bar graph with a series of red vertical bars that decrease in height from left to right, indicating a downward trend. A large red arrow, outlined in white, points diagonally downward and to the right, emphasizing the decline. Decrease bar illustrations A downward trend graph with a prominent red arrow indicating decline. The image depicts a bar graph with a series of red vertical bars that decrease in height from left to right, indicating a downward trend. A large red arrow, outlined in white, points diagonally downward and to the right, emphasizing the decline
Free with trial Four 3D bar graphs with arrows indicating upward and downward trends on white. Clear details and vibrant colors enhance visual. Decrease bar illustrations Four 3D Bar Graphs Showing Upward and Downward Trends with Arrows on White Keywords: bar graph, chart, data, statistics, analysis. Four 3D bar graphs with arrows indicating upward and downward trends on white. Clear details and vibrant colors enhance visual
Free with trial A black and white conceptual illustration features two interlocking gears labeled Legislation and Sentencing Parole, mechanically connected by a solid rod that holds them in precise alignment above a rising bar graph that visually represents the decreasing correlation between legislative changes and parole sentencing outcomes, creating a powerful metaphor for criminal justice reform, policy. Decrease bar illustrations Black and white conceptual illustration of legislation and sentencing parole gears connected by rod with increasing bar graph. A black and white conceptual illustration features two interlocking gears labeled Legislation and Sentencing Parole, mechanically connected by a solid rod that holds them in precise alignment above a rising bar graph that visually represents the decreasing correlation between legislative changes and parole sentencing outcomes, creating a powerful metaphor for criminal justice reform, policy
Free with trial An open textbook displays a vertical bar graph composed of six brightly colored orange, yellow, and red bars arranged from highest to lowest, symbolizing data analysis, statistical growth, and performance metrics, set against a plain beige background with scattered white dots that add a dynamic and energetic feel, creating a vibrant visual metaphor for progress, research, and educational. Decrease bar illustrations Open book with colorful bar graph on top showing data analysis, statistics, and growth metrics in vibrant orange, yellow, and red. An open textbook displays a vertical bar graph composed of six brightly colored orange, yellow, and red bars arranged from highest to lowest, symbolizing data analysis, statistical growth, and performance metrics, set against a plain beige background with scattered white dots that add a dynamic and energetic feel, creating a vibrant visual metaphor for progress, research, and educational
Free with trial The image depicts a 3D bar chart with bars in varying heights. The bars are colored in shades of green and blue, with the green bars being shorter and the blue bars being taller. The chart is set against a plain white background, which highlights the colors of the bars. Decrease bar illustrations Colorful 3d bar chart with green and blue bars on a white background. The image depicts a 3D bar chart with bars in varying heights. The bars are colored in shades of green and blue, with the green bars being shorter and the blue bars being taller. The chart is set against a plain white background, which highlights the colors of the bars
Free with trial Pink bar graph showing a downward trend on a pink background, financial concept. Decrease bar illustrations Pink bar graph showing a downward trend on a pink background, financial concept
Free with trial An open notebook displays two pages of business data visualization with a vertical bar graph on the left page featuring green, red, and blue bars alongside a central pie chart divided into red, blue, and green segments showing 70% in red with upward and downward arrows indicating percentage changes, all set against a clean white background ideal for concepts of analytics, financial reporting,. Decrease bar illustrations Business data analysis shown in an open notebook with colorful bar graph and pie chart illustrating statistics and percentages. An open notebook displays two pages of business data visualization with a vertical bar graph on the left page featuring green, red, and blue bars alongside a central pie chart divided into red, blue, and green segments showing 70% in red with upward and downward arrows indicating percentage changes, all set against a clean white background ideal for concepts of analytics, financial reporting,
Free with trial This image depicts a 3D bar graph with red bars. Initially, there is a sharp decline, followed by a significant upward trend, indicating a recovery or growth phase. The graph is set against a plain white background. Decrease bar illustrations A 3d graph showing a sharp decline followed by a significant upward trend. This image depicts a 3D bar graph with red bars. Initially, there is a sharp decline, followed by a significant upward trend, indicating a recovery or growth phase. The graph is set against a plain white background
Free with trial Two sets of rounded rectangular bars are displayed side by side on a white background. The left set is solid black, with bars decreasing in height from left to right. The right set is an outline. Decrease bar vectors Black and white bar graph showing downward trend on white background Keywords: bar chart, graph. Two sets of rounded rectangular bars are displayed side by side on a white background. The left set is solid black, with bars decreasing in height from left to right. The right set is an outline
Free with trial Grayscale Illustration of a Decreasing Bar Chart with a Downward Trend Arrow. Decrease bar vectors Grayscale Illustration of a Decreasing Bar Chart with a Downward Trend Arrow
Free with trial Isolated weighted straight bar dumbbell, with chrome textured grip and black rubber weight plates, perfect for strength training, gym workouts, bodybuilding, and home or commercial fitness exercise equipment for muscle building and physical fitness routines , urban background. Decrease bar vectors Dumbbell Lifts Weight For Strength Training, Fitness Exercise Equipment. Isolated weighted straight bar dumbbell, with chrome textured grip and black rubber weight plates, perfect for strength training, gym workouts, bodybuilding, and home or commercial fitness exercise equipment for muscle building and physical fitness routines , urban background
Free with trial A vibrant data visualization concept featuring a colorful vertical bar graph with gradient shades of blue, green, yellow, orange, and red arranged sequentially inside a transparent rectangular glass box against a clean white background, where two stylized red sun symbols positioned in the top right corner add symbolic elements to the analytical display, creating an abstract representation of. Decrease bar illustrations Colorful vertical bar graph with red sun symbols inside a glass box on white background representing data visualization and. A vibrant data visualization concept featuring a colorful vertical bar graph with gradient shades of blue, green, yellow, orange, and red arranged sequentially inside a transparent rectangular glass box against a clean white background, where two stylized red sun symbols positioned in the top right corner add symbolic elements to the analytical display, creating an abstract representation of
Free with trial The image depicts a bar graph with a series of red bars that are progressively decreasing in height from left to right. A large red arrow is pointing downwards, emphasizing the downward trend. Decrease bar illustrations Graph showing a downward trend with a large red arrow pointing downwards. The image depicts a bar graph with a series of red bars that are progressively decreasing in height from left to right. A large red arrow is pointing downwards, emphasizing the downward trend
Free with trial A collection of nine simple, solid black icons on a white background, illustrating concepts of decline, loss, and negative trends using various charts like bar graphs, line graphs, and pie charts with downward pointing arrows. Decrease bar vectors Set of black icons representing financial decrease and downward trends. A collection of nine simple, solid black icons on a white background, illustrating concepts of decline, loss, and negative trends using various charts like bar graphs, line graphs, and pie charts with downward pointing arrows
Free with trial This image shows two sets of 3D bar charts, one with green bars indicating a consistent upward trend and growth, while the other with red bars depicts a downward trend and decline. The green chart has arrows pointing upwards, symbolizing positive growth, while the red chart has arrows pointing downwards, indicating a negative trend. Decrease bar illustrations Contrasting upward and downward trends in a 3d bar chart visualization. This image shows two sets of 3D bar charts, one with green bars indicating a consistent upward trend and growth, while the other with red bars depicts a downward trend and decline. The green chart has arrows pointing upwards, symbolizing positive growth, while the red chart has arrows pointing downwards, indicating a negative trend
Free with trial A simple 3D render features four bars of decreasing height, in pink, blue and yellow, on a transparent backdrop. Depicts descending data. Decrease bar vectors Colorful 3D bar graph showing declining data on transparent background. A simple 3D render features four bars of decreasing height, in pink, blue and yellow, on a transparent backdrop. Depicts descending data.
Free with trial The image showcases a pair of chrome dumbbells with adjustable weights. The dumbbells are designed with a central bar and two circular weight plates on each side. The plates are marked with weight measurements and can be adjusted to increase or decrease the overall weight of the dumbbells. The dumbbells are set against a plain white background, highlighting their sleek and shiny appearance. Decrease bar illustrations A pair of chrome dumbbells with adjustable weights on a white background. The image showcases a pair of chrome dumbbells with adjustable weights. The dumbbells are designed with a central bar and two circular weight plates on each side. The plates are marked with weight measurements and can be adjusted to increase or decrease the overall weight of the dumbbells. The dumbbells are set against a plain white background, highlighting their sleek and shiny appearance
Free with trial Red bar graph showing downward trend and financial decline on a red background. Decrease bar illustrations Red bar graph showing downward trend and financial decline on a red background.
Free with trial A bar graph showing a downward trend, indicated by a blue arrow. Decrease bar illustrations Trending Downward: A Visual Representation of Decreasing Numbers. A bar graph showing a downward trend, indicated by a blue arrow
Free with trial A clean, minimalist smartphone app interface displays a spending tracker. A bar graph shows spending increase, highlighting financial growth. The design is black and white, emphasizing data clarity. Decrease bar illustrations Smartphone App UI: Minimalist Black & White Spending Tracker with Rising Graph. A clean, minimalist smartphone app interface displays a spending tracker. A bar graph shows spending increase, highlighting financial growth. The design is black and white, emphasizing data clarity
Free with trial A 3D bar chart visually represents a significant financial decline. A red arrow sharply descends, indicating a negative trend and a downward trajectory for market performance. Decrease bar illustrations Financial decline graph showing downturn and decreasing trend with arrow. A 3D bar chart visually represents a significant financial decline. A red arrow sharply descends, indicating a negative trend and a downward trajectory for market performance
Free with trial The image depicts a bar graph with five bars of varying heights, each accompanied by an arrow indicating the direction of change. The bars are colored in shades of blue and green, with the arrows in black. The first bar is the tallest and has a downward arrow, the second bar is shorter with an upward arrow, the third bar is the shortest with a downward arrow, the fourth bar is taller than the. Decrease bar illustrations Visual representation of fluctuating data with upward and downward trends. The image depicts a bar graph with five bars of varying heights, each accompanied by an arrow indicating the direction of change. The bars are colored in shades of blue and green, with the arrows in black. The first bar is the tallest and has a downward arrow, the second bar is shorter with an upward arrow, the third bar is the shortest with a downward arrow, the fourth bar is taller than the
Free with trial This vector file contains business chart icons including rising bar graphs, falling graphs, and pie chart symbols illustrating data trends in a simple style professional and clear mood. Generative AI. Decrease bar vectors Business chart icons set with rising and falling graphs pie chart symbols vector illustration. This vector file contains business chart icons including rising bar graphs, falling graphs, and pie chart symbols illustrating data trends in a simple style professional and clear mood. Generative AI
Free with trial Three-dimensional cubes arranged in a bar chart formation, representing data or progress. The cubes are colored blue, green, and pink, and are positioned in descending order of height from left to right. They are rendered with soft edges and cast subtle shadows on the white background. Decrease bar illustrations Three 3D Bar Chart Cubes in Ascending Order Keywords: bar chart, graph, data, statistics. Three-dimensional cubes arranged in a bar chart formation, representing data or progress. The cubes are colored blue, green, and pink, and are positioned in descending order of height from left to right. They are rendered with soft edges and cast subtle shadows on the white background
Free with trial A 3D representation of a bar chart shows a series of purple bars increasing in height from left to right. However, a yellow arrow curves downwards from the top of the chart, indicating a negative trend or decline. A single gold coin is positioned above the tallest bar, suggesting a connection to financial performance. The entire graphic is presented on a white background. Decrease bar illustrations 3D Bar Chart with Downward Trend Arrow and Gold Coin Keywords: business, finance, chart, graph, bar chart, data, statistics, trend. A 3D representation of a bar chart shows a series of purple bars increasing in height from left to right. However, a yellow arrow curves downwards from the top of the chart, indicating a negative trend or decline. A single gold coin is positioned above the tallest bar, suggesting a connection to financial performance. The entire graphic is presented on a white background