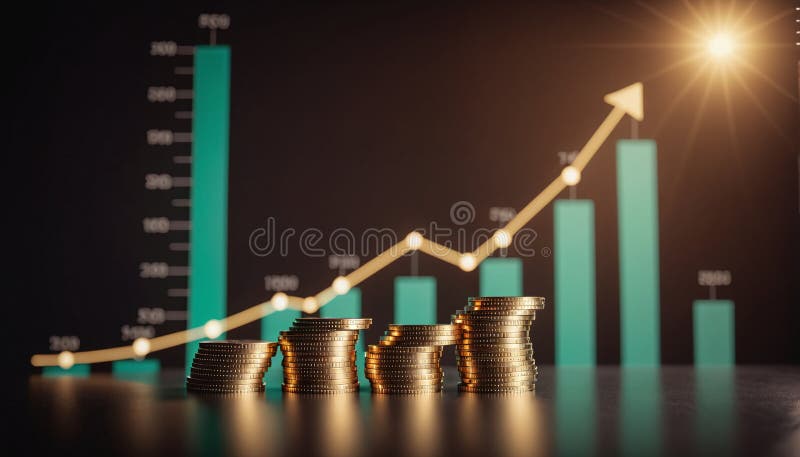
Free with trial Graph or block diagram shows the increase or decrease of shares, which means financial loss or gain -. Decrease bar illustrations Graph or block diagram shows the increase or decrease of shares, which means financial loss or gain
Free with trial A tablet displays a colorful bar graph, showcasing data trends. The image emphasizes visual data analysis and modern business tools. The warm wood background adds a professional yet inviting feel. Decrease bar illustrations Tablet Showing Business Graph. A tablet displays a colorful bar graph, showcasing data trends. The image emphasizes visual data analysis and modern business tools. The warm wood background adds a professional yet inviting feel.
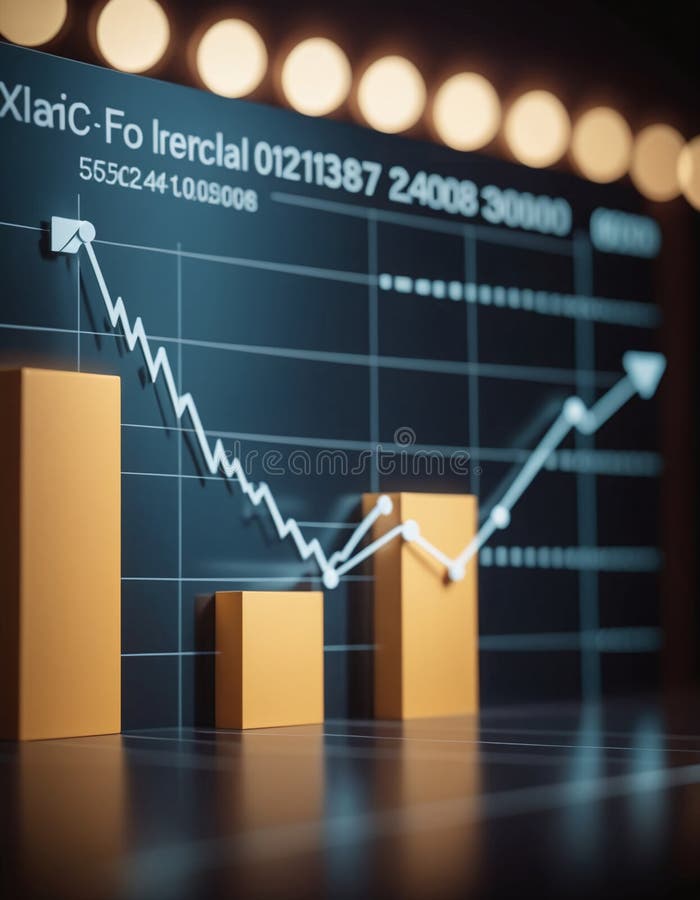
Free with trial A visual representation of a business downturn. This blue bar chart with a descending arrow illustrates a period of negative growth, financial loss, or economic recession. Decrease bar vectors Business Decline Graph Vector Icon. A visual representation of a business downturn. This blue bar chart with a descending arrow illustrates a period of negative growth, financial loss, or economic recession
Free with trial Graph or block diagram shows the increase or decrease of shares, which means financial loss or gain -. Decrease bar illustrations Graph or block diagram shows the increase or decrease of shares, which means financial loss or gain
Free with trial Graph or block diagram shows the increase or decrease of shares, which means financial loss or gain -. Decrease bar illustrations Graph or block diagram shows the increase or decrease of shares, which means financial loss or gain
Free with trial Graph or block diagram shows the increase or decrease of shares, which means financial loss or gain -. Decrease bar illustrations Graph or block diagram shows the increase or decrease of shares, which means financial loss or gain
Free with trial Graph or block diagram shows the increase or decrease of shares, which means financial loss or gain -. Decrease bar illustrations Graph or block diagram shows the increase or decrease of shares, which means financial loss or gain
Free with trial Graph or block diagram shows the increase or decrease of shares, which means financial loss or gain -. Decrease bar illustrations Graph or block diagram shows the increase or decrease of shares, which means financial loss or gain
Free with trial Graph or block diagram shows the increase or decrease of shares, which means financial loss or gain -. Decrease bar illustrations Graph or block diagram shows the increase or decrease of shares, which means financial loss or gain
Free with trial Graph or block diagram shows the increase or decrease of shares, which means financial loss or gain -. Decrease bar illustrations Graph or block diagram shows the increase or decrease of shares, which means financial loss or gain
Free with trial Graph or block diagram shows the increase or decrease of shares, which means financial loss or gain -. Decrease bar illustrations Graph or block diagram shows the increase or decrease of shares, which means financial loss or gain
Free with trial Graph or block diagram shows the increase or decrease of shares, which means financial loss or gain -. Decrease bar illustrations Graph or block diagram shows the increase or decrease of shares, which means financial loss or gain
Free with trial Graph or block diagram shows the increase or decrease of shares, which means financial loss or gain -. Decrease bar illustrations Graph or block diagram shows the increase or decrease of shares, which means financial loss or gain
Free with trial Graph or block diagram shows the increase or decrease of shares, which means financial loss or gain -. Decrease bar illustrations Graph or block diagram shows the increase or decrease of shares, which means financial loss or gain
Free with trial Graph or block diagram shows the increase or decrease of shares, which means financial loss or gain -. Decrease bar illustrations Graph or block diagram shows the increase or decrease of shares, which means financial loss or gain
Free with trial Graph or block diagram shows the increase or decrease of shares, which means financial loss or gain -. Decrease bar illustrations Graph or block diagram shows the increase or decrease of shares, which means financial loss or gain
Free with trial Graph or block diagram shows the increase or decrease of shares, which means financial loss or gain -. Decrease bar illustrations Graph or block diagram shows the increase or decrease of shares, which means financial loss or gain
Free with trial Graph or block diagram shows the increase or decrease of shares, which means financial loss or gain -. Decrease bar illustrations Graph or block diagram shows the increase or decrease of shares, which means financial loss or gain
Free with trial Graph or block diagram shows the increase or decrease of shares, which means financial loss or gain -. Decrease bar illustrations Graph or block diagram shows the increase or decrease of shares, which means financial loss or gain
Free with trial Graph or block diagram shows the increase or decrease of shares, which means financial loss or gain -. Decrease bar illustrations Graph or block diagram shows the increase or decrease of shares, which means financial loss or gain
Free with trial Graph or block diagram shows the increase or decrease of shares, which means financial loss or gain -. Decrease bar illustrations Graph or block diagram shows the increase or decrease of shares, which means financial loss or gain
Free with trial Graph or block diagram shows the increase or decrease of shares, which means financial loss or gain -. Decrease bar illustrations Graph or block diagram shows the increase or decrease of shares, which means financial loss or gain
Free with trial Graph or block diagram shows the increase or decrease of shares, which means financial loss or gain -. Decrease bar illustrations Graph or block diagram shows the increase or decrease of shares, which means financial loss or gain
Free with trial Graph or block diagram shows the increase or decrease of shares, which means financial loss or gain -. Decrease bar illustrations Graph or block diagram shows the increase or decrease of shares, which means financial loss or gain
Free with trial Graph or block diagram shows the increase or decrease of shares, which means financial loss or gain -. Decrease bar illustrations Graph or block diagram shows the increase or decrease of shares, which means financial loss or gain
Free with trial Graph or block diagram shows the increase or decrease of shares, which means financial loss or gain -. Decrease bar illustrations Graph or block diagram shows the increase or decrease of shares, which means financial loss or gain
Free with trial Graph or block diagram shows the increase or decrease of shares, which means financial loss or gain -. Decrease bar illustrations Graph or block diagram shows the increase or decrease of shares, which means financial loss or gain
Free with trial Graph or block diagram shows the increase or decrease of shares, which means financial loss or gain -. Decrease bar illustrations Graph or block diagram shows the increase or decrease of shares, which means financial loss or gain
Free with trial Graph or block diagram shows the increase or decrease of shares, which means financial loss or gain -. Decrease bar illustrations Graph or block diagram shows the increase or decrease of shares, which means financial loss or gain
Free with trial Graph or block diagram shows the increase or decrease of shares, which means financial loss or gain -. Decrease bar illustrations Graph or block diagram shows the increase or decrease of shares, which means financial loss or gain
Free with trial Graph or block diagram shows the increase or decrease of shares, which means financial loss or gain -. Decrease bar illustrations Graph or block diagram shows the increase or decrease of shares, which means financial loss or gain
Free with trial Graph or block diagram shows the increase or decrease of shares, which means financial loss or gain -. Decrease bar illustrations Graph or block diagram shows the increase or decrease of shares, which means financial loss or gain
Free with trial Graph or block diagram shows the increase or decrease of shares, which means financial loss or gain -. Decrease bar illustrations Graph or block diagram shows the increase or decrease of shares, which means financial loss or gain
Free with trial Graph or block diagram shows the increase or decrease of shares, which means financial loss or gain -. Decrease bar illustrations Graph or block diagram shows the increase or decrease of shares, which means financial loss or gain
Free with trial Graph or block diagram shows the increase or decrease of shares, which means financial loss or gain -. Decrease bar illustrations Graph or block diagram shows the increase or decrease of shares, which means financial loss or gain
Free with trial Chat arrow down icon Vector set on white background. EPS 10. Decrease bar vectors Chart arrow down icon set. decline downward chart vector symbol. stock trend downturn graph sign. negative economy bar Chart. Chat arrow down icon Vector set on white background. EPS 10
Free with trial Chat arrow down icon Vector set on white background. EPS 10. Decrease bar vectors Chart arrow down icon set. decline downward chart vector symbol. stock trend downturn graph sign. negative economy bar Chart. Chat arrow down icon Vector set on white background. EPS 10
Free with trial This image shows a bar chart with a downward trend line, indicating economic decline. Vector illustration design using ai tool. Decrease bar vectors Economic recession chart. This image shows a bar chart with a downward trend line, indicating economic decline. Vector illustration design using ai tool.
Free with trial This image shows a declining bar graph and a person reacting to a financial crisis. Vector illustration design using ai tool. Decrease bar vectors Economic collapse is coming. This image shows a declining bar graph and a person reacting to a financial crisis. Vector illustration design using ai tool.
Free with trial Chat arrow down icon Vector set on white background. EPS 10. Decrease bar vectors Chart arrow down icon set. decline downward chart vector symbol. stock trend downturn graph sign. negative economy bar Chart. Chat arrow down icon Vector set on white background. EPS 10
Free with trial A businessman stands with a briefcase, surrounded by declining bar charts and downward arrows. Vector art design using ai tool. Decrease bar vectors Stock Market Down Illustration. A businessman stands with a briefcase, surrounded by declining bar charts and downward arrows. Vector art design using ai tool.
Free with trial This AI-generated image depicts a bar graph where the bars are covered in a melting, metallic substance, suggesting a market downturn. The dripping metal symbolizes loss and decline, generated by AI for visual representation. Decrease bar illustrations Melting Market Graph. This AI-generated image depicts a bar graph where the bars are covered in a melting, metallic substance, suggesting a market downturn. The dripping metal symbolizes loss and decline, generated by AI for visual representation.
Free with trial This image shows a declining bar graph with broken bars and a downward trend line. Vector illustration design using ai tool. Decrease bar vectors Stock market crash. This image shows a declining bar graph with broken bars and a downward trend line. Vector illustration design using ai tool.
Free with trial This image shows a financial report with bar graphs and numerical data, generated by AI, suggesting business performance or investment analysis. The document rests on a wooden desk, with coins blurred in the background, hinting at financial matters. Decrease bar illustrations Financial Report Analysis. This image shows a financial report with bar graphs and numerical data, generated by AI, suggesting business performance or investment analysis. The document rests on a wooden desk, with coins blurred in the background, hinting at financial matters.
Free with trial A man stands in front of a bar and line graph showing a downward trend. Vector art design using ai tool. Decrease bar vectors Stock Market Downward Illustration. A man stands in front of a bar and line graph showing a downward trend. Vector art design using ai tool.
Free with trial A visually striking image capturing a bar chart, line graph, and pie chart meticulously drawn in the wet sand on a beach. The artwork is illuminated by the warm, golden light of a sunset, with gentle waves lapping at the shore. This represents concepts of financial growth, market analysis, and business success in a unique, natural setting. The image evokes themes of planning, progress, and the cyclical nature of markets. Decrease bar illustrations Financial Growth Chart and Pie Chart Drawn in Sand at Sunset. A visually striking image capturing a bar chart, line graph, and pie chart meticulously drawn in the wet sand on a beach. The artwork is illuminated by the warm, golden light of a sunset, with gentle waves lapping at the shore. This represents concepts of financial growth, market analysis, and business success in a unique, natural setting. The image evokes themes of planning, progress, and the cyclical nature of markets.
Free with trial Descending white cylinder steps. Empty podium for product display. Bar chart and business decline or failure. Financial profit loss and economic crisis. 3D render. Decrease bar illustrations Descending white cylinder steps. Empty podium for product display
Free with trial A graphic illustration featuring two distinct charts on a white background. The upper chart displays three descending lines in black, red, and green, each ending with a downward-pointing arrow. Below this, a bar chart shows three black bars of increasing height, with arrows pointing upwards from the tallest bars. A stylized black graphic element resembling diverging paths or a funnel is positioned. Decrease bar vectors Downward and upward trending graphs with arrows chart. A graphic illustration featuring two distinct charts on a white background. The upper chart displays three descending lines in black, red, and green, each ending with a downward-pointing arrow. Below this, a bar chart shows three black bars of increasing height, with arrows pointing upwards from the tallest bars. A stylized black graphic element resembling diverging paths or a funnel is positioned
Free with trial A row of colorful wooden blocks, resembling a bar graph, sits on a dark wooden surface. The blocks are various heights and colors, creating a visually appealing and potentially symbolic representation of growth or data. Decrease bar illustrations Colorful Wooden Blocks Chart. A row of colorful wooden blocks, resembling a bar graph, sits on a dark wooden surface. The blocks are various heights and colors, creating a visually appealing and potentially symbolic representation of growth or data.
Free with trial This image showcases a colorful bar graph with a downward-pointing arrow, generated by AI, illustrating a negative trend or decline. The vibrant colors and simplistic design make the message clear and easily understood. The image is perfect for representing economic downturns, market dips, or any s. Decrease bar illustrations Downward Trend Visualization. This image showcases a colorful bar graph with a downward-pointing arrow, generated by AI, illustrating a negative trend or decline. The vibrant colors and simplistic design make the message clear and easily understood. The image is perfect for representing economic downturns, market dips, or any s
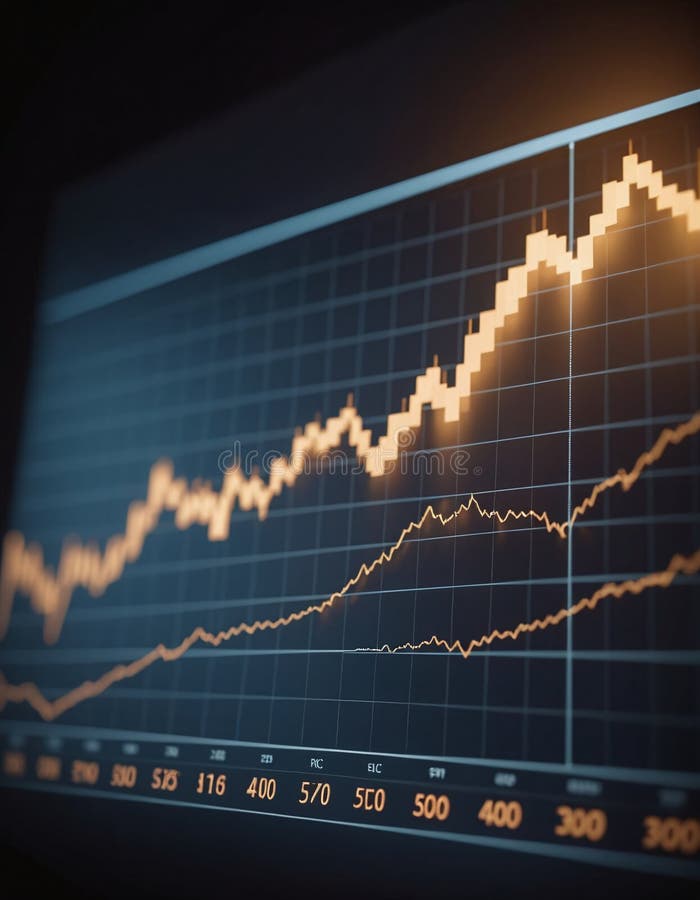
Free with trial The image shows a neon-style graph illustrating a business downturn. the graph features an orange line depicting a downward trend, punctuated by blue vertical lines that may represent key milestones or events. the background is dark, emphasizing the neon glow of the graph elements. the graph suggests a decline in business performance, with the orange line representing a decrease in value or profit over time. Decrease bar illustrations Business downturn neon chart illustration. the image shows a neon-style graph illustrating a business downturn. the graph features an orange line depicting a downward trend, punctuated by blue vertical lines that may represent key milestones or events. the background is dark, emphasizing the neon glow of the graph elements. the graph suggests a decline in business performance, with the orange line representing a decrease in value or profit over time.
Free with trial A 3D rendering showing stacks of coins under a magnifying glass focusing on a bar graph, generated by AI. This image symbolizes financial analysis, investment, and wealth management. It's perfect for illustrating articles or presentations related to economic trends and monetary growth. Decrease bar illustrations Financial Analysis Magnifier. A 3D rendering showing stacks of coins under a magnifying glass focusing on a bar graph, generated by AI. This image symbolizes financial analysis, investment, and wealth management. It's perfect for illustrating articles or presentations related to economic trends and monetary growth.
Free with trial Simple lineart icon of an eye looking at a bar chart, representing market analysis. Decrease bar vectors Human eye monitoring business bar chart icon. Simple lineart icon of an eye looking at a bar chart, representing market analysis
Free with trial A simple vector illustration of a battery icon showing a critically low power level. The colorful bars decrease in size, symbolizing energy depletion, exhaustion, or an approaching deadline. Decrease bar vectors Stylized Low Battery Charge Icon. A simple vector illustration of a battery icon showing a critically low power level. The colorful bars decrease in size, symbolizing energy depletion, exhaustion, or an approaching deadline
Free with trial A hand places a Bitcoin into a piggy bank, symbolizing cryptocurrency investment. The upward arrow and growing bar graph illustrate increasing value, a visual representation of potential returns generated by AI. Decrease bar illustrations Bitcoin Piggy Bank Savings Growth. A hand places a Bitcoin into a piggy bank, symbolizing cryptocurrency investment. The upward arrow and growing bar graph illustrate increasing value, a visual representation of potential returns generated by AI.
Free with trial This image showcases six vibrant icons representing various data visualization methods, including pie charts, bar graphs, and gauges. These colorful and engaging visuals are perfect for presentations or reports and were generated by AI. They offer a quick and easy way to represent data in a clear a. Decrease bar illustrations Colorful Data Visualization Icons. This image showcases six vibrant icons representing various data visualization methods, including pie charts, bar graphs, and gauges. These colorful and engaging visuals are perfect for presentations or reports and were generated by AI. They offer a quick and easy way to represent data in a clear a
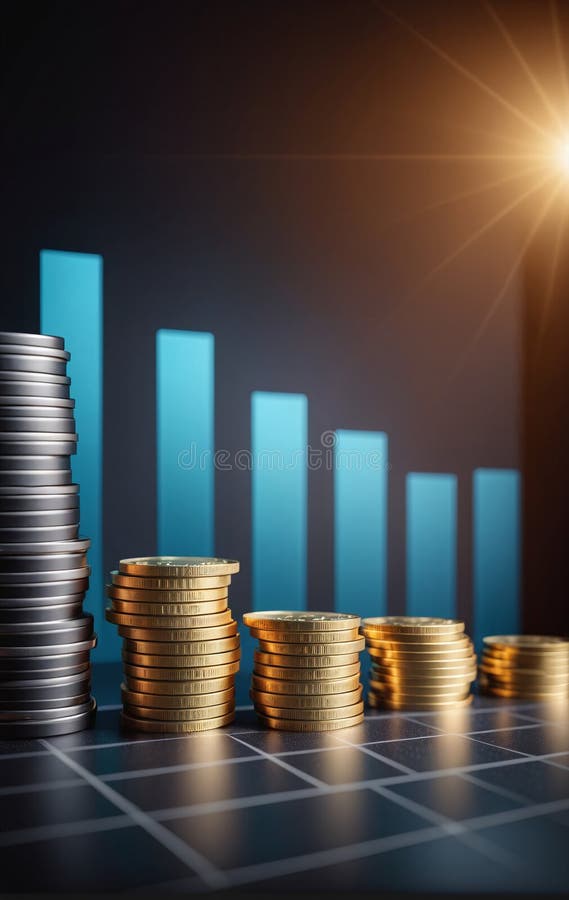
Free with trial Isometric bar graph with decreasing trend shows negative financial results with dollar bills and coins, representing economic downturn and financial crisis. Decrease bar vectors Isometric bar graph with decreasing trend shows negative financial results with dollar bills and coins, representing
Free with trial A captivating image featuring a descending bar graph composed of miniature candy canes against a bokeh background of twinkling Christmas lights and miniature snow-covered evergreen trees. The candy canes, in classic red and white stripes, visually represent a declining trend or decrease. The scene evokes a festive yet subtly concerning mood, ideal for illustrating concepts related to holiday. Decrease bar illustrations Christmas Candy Cane Graph Decline. A captivating image featuring a descending bar graph composed of miniature candy canes against a bokeh background of twinkling Christmas lights and miniature snow-covered evergreen trees. The candy canes, in classic red and white stripes, visually represent a declining trend or decrease. The scene evokes a festive yet subtly concerning mood, ideal for illustrating concepts related to holiday
Free with trial Woman looking worried near bar chart with declining arrows, broken piggy bank, and shattered coin, on light abstract background. Concept of economic failure. Vector illustration. Decrease bar vectors Financial crisis with broken piggy bank. Vector illustration. Woman looking worried near bar chart with declining arrows, broken piggy bank, and shattered coin, on light abstract background. Concept of economic failure. Vector illustration
Free with trial This vibrant illustration depicts financial growth, showcasing a dramatic upward trend after an initial decline. The 3D bar chart and upward arrow, generated by AI, symbolize overcoming challenges and achieving significant financial success. The gold coin further emphasizes the positive outcome. Decrease bar illustrations AI-Generated Financial Growth Chart. This vibrant illustration depicts financial growth, showcasing a dramatic upward trend after an initial decline. The 3D bar chart and upward arrow, generated by AI, symbolize overcoming challenges and achieving significant financial success. The gold coin further emphasizes the positive outcome.
Free with trial Strategic Decisions: Integrating Business Analytics with Strategic Thinking. This visual portrays the dynamic interaction between business analytics and strategic thinking, showcasing how analytical insights drive strategic planning and decision-making. It emphasizes the synergy between data analysis and strategic foresight in achieving business goals. --chaos 10 --ar 16:9 --style raw --stylize, immersive wallpaper background. Decrease bar illustrations Hand Drawn Colorful Bar Charts and Pie Charts. Strategic Decisions: Integrating Business Analytics with Strategic Thinking. This visual portrays the dynamic interaction between business analytics and strategic thinking, showcasing how analytical insights drive strategic planning and decision-making. It emphasizes the synergy between data analysis and strategic foresight in achieving business goals. --chaos 10 --ar 16:9 --style raw --stylize, immersive wallpaper background
Free with trial A bar chart representing a sharp decline makes a dramatic splash in clear water. This conceptual image visualizes a financial crisis, liquidity problems, or the impactful consequences of negative data and market failure. Decrease bar illustrations Economic Downturn Graph Splashing Down. A bar chart representing a sharp decline makes a dramatic splash in clear water. This conceptual image visualizes a financial crisis, liquidity problems, or the impactful consequences of negative data and market failure
Free with trial A versatile set of business and finance icons isolated on a white background. This collection features various data visualization elements, including bar charts, line graphs, pie charts, and diagrams. The clean, vector style represents concepts like statistical analysis, market growth, financial reporting, and economic trends. These infographic elements are perfect for presentations, business reports, websites, and marketing materials to illustrate progress, performance, and data-driven insights. Decrease bar vectors Business and Finance Chart and Graph Icon Set. A versatile set of business and finance icons isolated on a white background. This collection features various data visualization elements, including bar charts, line graphs, pie charts, and diagrams. The clean, vector style represents concepts like statistical analysis, market growth, financial reporting, and economic trends. These infographic elements are perfect for presentations, business reports, websites, and marketing materials to illustrate progress, performance, and data-driven insights.
Free with trial A candlestick chart showing a significant downward trend. The chart features black candlesticks indicating price fluctuations over time, with red, green, and orange lines tracing different moving averages. A bar graph at the bottom provides additional data. This image can be used to represent financial loss, market downturns, or economic recession. Decrease bar illustrations Downward Trend Candlestick Chart. A candlestick chart showing a significant downward trend. The chart features black candlesticks indicating price fluctuations over time, with red, green, and orange lines tracing different moving averages. A bar graph at the bottom provides additional data. This image can be used to represent financial loss, market downturns, or economic recession.
Free with trial Chart showcasing progress. The last bar stands out as a green arrow, symbolising positive growth. Accompanied by cash, it's a powerful representation of financial success. Decrease bar vectors Financial Growth Chart with Positive Momentum. Chart showcasing progress. The last bar stands out as a green arrow, symbolising positive growth. Accompanied by cash, it's a powerful representation of financial success...
Free with trial A modern flat design icon representing financial data analysis and market trends. This vector illustration features a combination of a green bar chart and a dark grey line graph, showing fluctuations in performance. An upward arrow indicates initial growth, followed by a volatile trend line symbolizing concepts like market instability, economic changes, profit and loss, or business analytics. This versatile graphic is perfect for infographics, financial reports, presentations, websites, and applications related to business, finance, statistics, and economics. Isolated on a white background for easy use. Decrease bar vectors Financial Market Fluctuation Graph Icon. A modern flat design icon representing financial data analysis and market trends. This vector illustration features a. A modern flat design icon representing financial data analysis and market trends. This vector illustration features a combination of a green bar chart and a dark grey line graph, showing fluctuations in performance. An upward arrow indicates initial growth, followed by a volatile trend line symbolizing concepts like market instability, economic changes, profit and loss, or business analytics. This versatile graphic is perfect for infographics, financial reports, presentations, websites, and applications related to business, finance, statistics, and economics. Isolated on a white background for easy use.
Free with trial This image showcases two contrasting bar charts, constructed from red and white blocks, generated by AI. One chart depicts growth, while the other illustrates decline, offering a visual representation of opposing trends. The use of color and simple shapes makes it easily understandable. Decrease bar illustrations AI-Generated Block Charts: Growth & Decline. This image showcases two contrasting bar charts, constructed from red and white blocks, generated by AI. One chart depicts growth, while the other illustrates decline, offering a visual representation of opposing trends. The use of color and simple shapes makes it easily understandable.
Free with trial A conceptual image illustrating a decline in the cocoa market. In the foreground, a pile of raw cocoa beans sits on a white surface. Behind them, a 3D bar chart shows a steep downward trend, with tall green bars transitioning to shorter red bars, symbolizing falling prices, reduced production, or financial loss. This graphic is ideal for representing economic downturns, agricultural commodity trading, market analysis, business reports, and news related to the chocolate industry's performance, supply chain issues, or crop failure. Decrease bar illustrations Cocoa Market Decline with Beans and Graph. A conceptual image illustrating a decline in the cocoa market. In the foreground, a pile of raw cocoa beans sits on a white surface. Behind them, a 3D bar chart shows a steep downward trend, with tall green bars transitioning to shorter red bars, symbolizing falling prices, reduced production, or financial loss. This graphic is ideal for representing economic downturns, agricultural commodity trading, market analysis, business reports, and news related to the chocolate industry's performance, supply chain issues, or crop failure.
Free with trial A visual representation of diminishing returns, where solid gold bars of success and profit gradually transition into clear, fragile glass. Decrease bar illustrations From Gold to Glass A Declining Bar Graph. A visual representation of diminishing returns, where solid gold bars of success and profit gradually transition into clear, fragile glass
Free with trial This image presents a set of four icons depicting different types of bar charts with upward and downward trends. These icons are commonly used to visually represent growth, decline, progress, and regression in various contexts, such as business, finance, and data analysis. Decrease bar vectors Collection of Growth and Decline Chart Icons. This image presents a set of four icons depicting different types of bar charts with upward and downward trends. These icons are commonly used to visually represent growth, decline, progress, and regression in various contexts, such as business, finance, and data analysis.
Free with trial A stock chart shows a red arrow trending upwards with a sharp decline represented by a red bar, juxtaposed with green bars, illustrating market fluctuations for financial analysis. Decrease bar illustrations Stock Chart with Red Arrow and Green Bars. A stock chart shows a red arrow trending upwards with a sharp decline represented by a red bar, juxtaposed with green bars, illustrating market fluctuations for financial analysis
Free with trial A modern, colorful bar chart illustrates a downward trend in financial performance or statistical data. Decrease bar illustrations Financial Data Analysis Graph Illustration. A modern, colorful bar chart illustrates a downward trend in financial performance or statistical data
Free with trial 3D rendering of a dynamic presentation stand showcasing financial data. Colorful, geometric shapes and infographics present market statistics, including percentages, dollar amounts, and bar graphs. Stacks of coins and various data elements are displayed on a dark blue platform with orange accents. Suitable for illustrating financial reports, market analysis, investment strategies, or business presentations. Decrease bar illustrations Modern Financial Data Visualization Display. 3D rendering of a dynamic presentation stand showcasing financial data. Colorful, geometric shapes and infographics present market statistics, including percentages, dollar amounts, and bar graphs. Stacks of coins and various data elements are displayed on a dark blue platform with orange accents. Suitable for illustrating financial reports, market analysis, investment strategies, or business presentations.
Free with trial An illustrative concept of economic downturn, where a declining bar graph with a red arrow rests on a precarious, floating island. Decrease bar vectors Financial Crisis Chart on a Floating Island. An illustrative concept of economic downturn, where a declining bar graph with a red arrow rests on a precarious, floating island
Free with trial An isometric illustration depicting a blue bar chart showing growth, with a red arrow forming a slide that goes downwards, symbolizing a business decline or setback. Decrease bar illustrations Business growth chart with a downward slide. An isometric illustration depicting a blue bar chart showing growth, with a red arrow forming a slide that goes downwards, symbolizing a business decline or setback
Free with trial A comprehensive collection of black and white icons representing various financial and business charts, including bar, line, and pie graphs, for data visualization. Decrease bar vectors Assortment of financial and business chart icons. A comprehensive collection of black and white icons representing various financial and business charts, including bar, line, and pie graphs, for data visualization
Free with trial Red bar chart with a gray arrow pointing down representing financial loss. Decrease bar vectors Red chart arrow pointing down representing financial loss. Red bar chart with a gray arrow pointing down representing financial loss
Free with trial A 3D render illustrating the concept of financial decline and economic crisis. The image features a bar chart with progressively smaller bars and a prominent red arrow pointing downwards, signifying a sharp downturn. This visual metaphor represents a stock market crash, business failure, investment loss, or recession. The minimalist design on a yellow background is perfect for financial reports, business presentations, economic news articles, and web graphics discussing negative growth, losses, or bankruptcy. A small stack of coins reinforces the monetary theme. Decrease bar illustrations 3D Financial Decline Graph with Downward Arrow. A 3D render illustrating the concept of financial decline and economic crisis. The image features a bar chart with progressively smaller bars and a prominent red arrow pointing downwards, signifying a sharp downturn. This visual metaphor represents a stock market crash, business failure, investment loss, or recession. The minimalist design on a yellow background is perfect for financial reports, business presentations, economic news articles, and web graphics discussing negative growth, losses, or bankruptcy. A small stack of coins reinforces the monetary theme.
Free with trial A descending bar graph with a dollar coin and downward pointing arrow signifies a decrease in the stock market, suitable for illustrating financial loss. Decrease bar illustrations Stock Market Plunge with Dollar Coin and Graph. A descending bar graph with a dollar coin and downward pointing arrow signifies a decrease in the stock market, suitable for illustrating financial loss