Free with trial Green bars and an upward arrow signify profit, contrasted by red bars and a downward arrow representing loss on a white background. Decrease bar illustrations Visual comparison of profit and loss using green ascending and red descending bar charts and arrows on a white. Green bars and an upward arrow signify profit, contrasted by red bars and a downward arrow representing loss on a white background
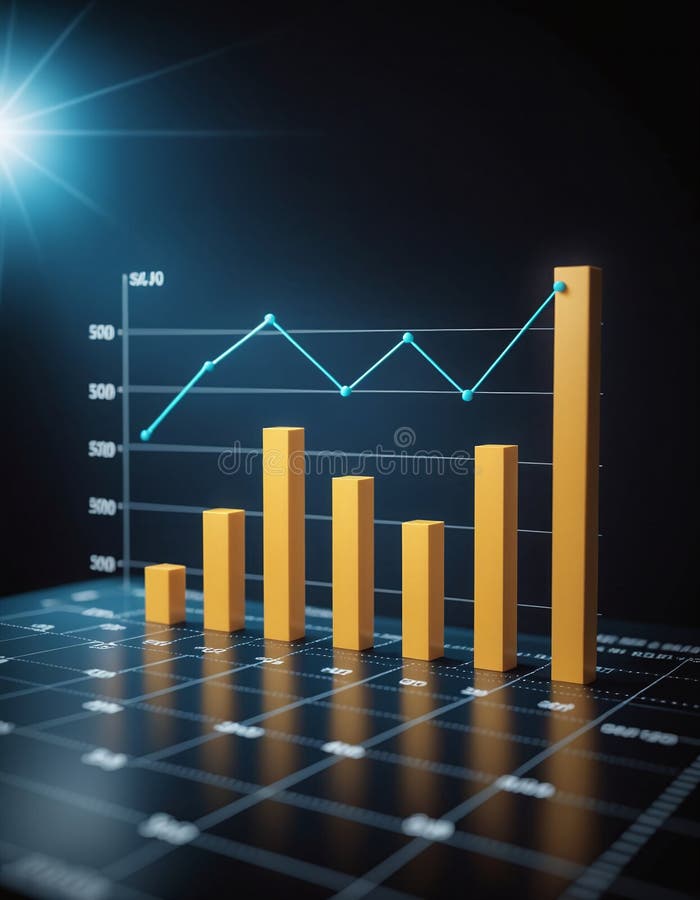
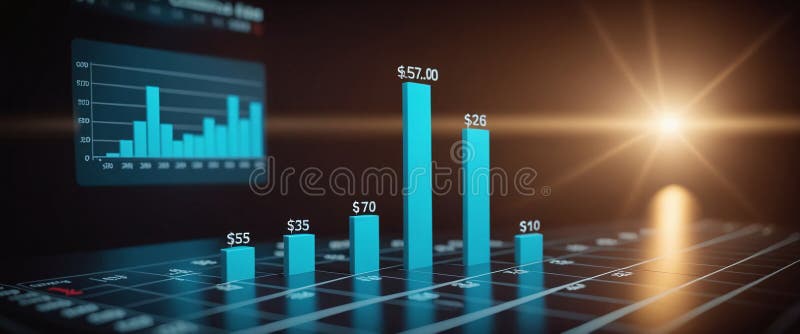
Free with trial Graph or block diagram shows the increase or decrease of shares, which means financial loss or gain -. Decrease bar illustrations Graph or block diagram shows the increase or decrease of shares, which means financial loss or gain
Free with trial Graph or block diagram shows the increase or decrease of shares, which means financial loss or gain -. Decrease bar illustrations Graph or block diagram shows the increase or decrease of shares, which means financial loss or gain
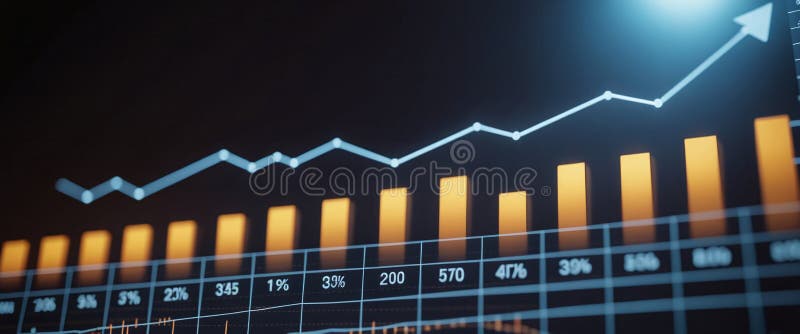
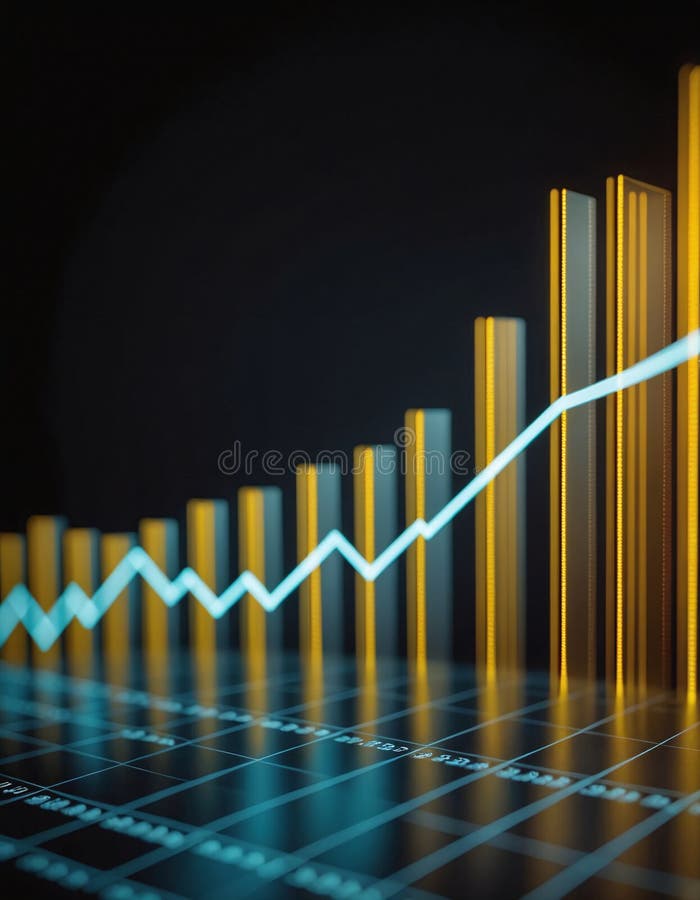
Free with trial This abstract image represents detailed data visualization of financial market trends featuring line graphs and bar charts on a dark backdrop. Decrease bar illustrations Abstract Data Visualization of Financial Market Trends with Line Graph and Bar Chart on Dark Background. This abstract image represents detailed data visualization of financial market trends featuring line graphs and bar charts on a dark backdrop
Free with trial A red neon arrow points downwards over a bar graph, symbolizing a stock market crash and economic recession. This image represents financial loss and investment decline in a crisis situation. Decrease bar illustrations Stock market crash economic recession financial crisis investment loss chart decline red arrow downtrend. a red neon arrow points downwards over a bar graph, symbolizing a stock market crash and economic recession. This image represents financial loss and investment decline in a crisis situation.
Free with trial A visual representation of a stock market crash, showcasing a downward trend with a red line and bar graph, indicating financial loss and economic downturn. it is a risk analysis chart. Decrease bar illustrations Stock market crash graph, financial analysis, investment risk, economic downturn, recession chart, loss trend. a visual representation of a stock market crash, showcasing a downward trend with a red line and bar graph, indicating financial loss and economic downturn. it is a risk analysis chart.
Free with trial A vivid red stock market bar chart decline is displayed against a dark background. This image conveys a financial crisis or market downturn concept. Decrease bar illustrations Red Financial Stock Market Crash with Bar Chart Decline in Dark Background Concept. A vivid red stock market bar chart decline is displayed against a dark background. This image conveys a financial crisis or market downturn concept
Free with trial Collection of black vector icons featuring downward trending charts, magnifying glass over bar graph, document reports, and computer screen data analysis symbols representing financial decline and analytics. Generative AI. Decrease bar vectors Black icons set showing downward trending graphs analysis with document reports magnifying glass and data visualization. Collection of black vector icons featuring downward trending charts, magnifying glass over bar graph, document reports, and computer screen data analysis symbols representing financial decline and analytics. Generative AI
Free with trial 3d red arrow crashing down with falling stock market bar charts, economic recession, financial crisis and market crash illustration. Generative AI. Decrease bar illustrations 3d red arrow crashing down with falling stock market bar charts economic recession financial crisis and market crash. 3d red arrow crashing down with falling stock market bar charts, economic recession, financial crisis and market crash illustration. Generative AI
Free with trial A downward trending red arrow crosses a series of blue bars, visually representing a sharp financial decline and negative business performance. Decrease bar illustrations Red arrow declining over blue bar chart symbolizing financial loss and downturn isolated on white background. A downward trending red arrow crosses a series of blue bars, visually representing a sharp financial decline and negative business performance
Free with trial Bar graph depicting a decline, representing economic downturn, stock market decline, and company insolvency with a dropping red arrow. Decrease bar vectors Bar chart illustrating a downward trend, symbolizing financial loss, market crash, and business failure with a falling red arrow. Bar graph depicting a decline, representing economic downturn, stock market decline, and company insolvency with a dropping red arrow
Free with trial Graphic showing 3d bar chart with pink blue and yellow bars on a white card against white background. Decrease bar illustrations 3D Bar Chart with Pink Blue and Yellow Bars on a White Card Against White Background Keywords: bar chart, graph, data, statistics. Graphic showing 3d bar chart with pink blue and yellow bars on a white card against white background
Free with trial Smartphone is displaying a simple line graph that is decreasing, suggesting negative performance. Decrease bar vectors Smartphone showing decreasing bar graph icon vector outline. Smartphone is displaying a simple line graph that is decreasing, suggesting negative performance
Free with trial The worldwide market is currently facing a financial slowdown, marked by a decrease in currency value, increasing inflation rates, and an economic recession that is moving in a negative direction. Decrease bar vectors Global market experiencing financial downturn, showing a currency decline, rising inflation, and economic recession with a. The worldwide market is currently facing a financial slowdown, marked by a decrease in currency value, increasing inflation rates, and an economic recession that is moving in a negative direction
Free with trial A hand pushes a stack of coins downward while a declining trend graph and bar chart illustrate economic decline. Decrease bar illustrations Hand pointing at falling stack of coins with downward market trend graph illustration depicting financial loss. A hand pushes a stack of coins downward while a declining trend graph and bar chart illustrate economic decline
Free with trial Bright minus symbol encircled with bold dark gray stroke, orange bar isolated over white digital object representing deduction. Decrease bar vectors Bright minus symbol encircled with bold dark gray stroke, orange bar isolated over white digital object representing
Free with trial A 3D graphic illustrating a declining red trend line against the backdrop of a bar chart, representing the volatility and risks associated with high-yield investment (HYIP) programs. Decrease bar illustrations Graph depicting the downward trend in high-yield investment programs highlighting financial risk and instability. A 3D graphic illustrating a declining red trend line against the backdrop of a bar chart, representing the volatility and risks associated with high-yield investment (HYIP) programs.
Free with trial Business Woman hands typing on laptop with digital falling bar chart and cost percentage icon. Concept of financial cost reduction, business expense management and economic crisis strategy. Decrease bar illustrations Business Woman hands typing on laptop with digital falling bar chart and cost percentage icon. Concept of financial cost reduction
Free with trial Visualize complex market trends and strategy using this metallic, AI-generated bar chart illustration. Perfect for financial reports, planning presentations, and investor materials that require a sophisticated, high-impact visual representation of business growth, decline, and future success. Decrease bar illustrations Conceptual 3D business bar chart illustrating market performance, showing initial decline followed by upward growth. Visualize complex market trends and strategy using this metallic, AI-generated bar chart illustration. Perfect for financial reports, planning presentations, and investor materials that require a sophisticated, high-impact visual representation of business growth, decline, and future success.
Free with trial This image illustrates market trends with arrows and graphs. It represents economic instability, showing both growth and decline, crucial for financial analysis. Decrease bar vectors Vector art of illustration depicting fluctuating market trends with upward and downward arrows and bar graphs, , conveying. This image illustrates market trends with arrows and graphs. It represents economic instability, showing both growth and decline, crucial for financial analysis
Free with trial Hand Drawn Pink Bar Chart Illustration Showing Rise and Fall of Data Trends with Arrows Symbolizing Up and Down Fluctuations. Decrease bar vectors Hand Drawn Pink Bar Chart Illustration Showing Rise and Fall of Data Trends with Arrows Symbolizing Up and Down Fluctuations
Free with trial The image displays an abstract graph illustrating fluctuating growth trends with associated data points and bar charts representing additional metrics. Decrease bar illustrations Abstract Graph Showing Growth and Data Trends. The image displays an abstract graph illustrating fluctuating growth trends with associated data points and bar charts representing additional metrics
Free with trial The image showcases a collection of 3D graphical elements representing different business and market performance metrics. It includes growth percentages, market share gains, pie charts, bar graphs, and target indicators. Each element highlights positive and negative trends, market shares, and growth rates, useful for illustrating financial reports, business presentations, or performance analyses. Decrease bar illustrations Visual representation of various business performance metrics and market growth indicators isolated on white background. The image showcases a collection of 3D graphical elements representing different business and market performance metrics. It includes growth percentages, market share gains, pie charts, bar graphs, and target indicators. Each element highlights positive and negative trends, market shares, and growth rates, useful for illustrating financial reports, business presentations, or performance analyses.
Free with trial Up and Down sign with green and red arrows isolated on a blue background vector illustration. Concept of sales bar chart symbol icon with arrow moving down and sales bar chart with arrow moving up. Decrease bar vectors Up and Down sign with green and red arrows vector illustration. Concept of sales bar chart symbol icon with arrows. Up and Down sign with green and red arrows isolated on a blue background vector illustration. Concept of sales bar chart symbol icon with arrow moving down and sales bar chart with arrow moving up.
Free with trial Up and Down sign with green and red arrows vector illustration. Concept of sales bar chart symbol icon with arrow moving down and sales bar chart with arrow moving up. Decrease bar vectors Up and Down sign with green and red arrows vector illustration. Concept of sales bar chart symbol icon with arrows. Up and Down sign with green and red arrows vector illustration. Concept of sales bar chart symbol icon with arrow moving down and sales bar chart with arrow moving up.
Free with trial Up and Down sign with green and red arrows vector illustration. Concept of sales bar chart symbol icon with arrow moving down and sales bar chart with arrow moving up. Decrease bar vectors Up and Down sign with green and red arrows vector illustration. Concept of sales bar chart symbol icon with arrows. Up and Down sign with green and red arrows vector illustration. Concept of sales bar chart symbol icon with arrow moving down and sales bar chart with arrow moving up.
Free with trial Rocket launching with decreasing bar graph, surrounded by tropical leaves on a blue background. Created with the help of Generative AI tools. Decrease bar illustrations Rocket launching with decreasing bar graph, surrounded by tropical leaves on a blue background
Free with trial The image showcases a collection of 3D graphical elements representing different business and market performance metrics. It includes growth percentages, market share gains, pie charts, bar graphs, and target indicators. Each element highlights positive and negative trends, market shares, and growth rates, useful for illustrating financial reports, business presentations, or performance analyses. Decrease bar illustrations Visual representation of various business performance metrics and market growth indicators isolated on white background. The image showcases a collection of 3D graphical elements representing different business and market performance metrics. It includes growth percentages, market share gains, pie charts, bar graphs, and target indicators. Each element highlights positive and negative trends, market shares, and growth rates, useful for illustrating financial reports, business presentations, or performance analyses.
Free with trial The image depicts two business professionals standing beside a bar chart that shows a downward trend, indicating a decline. In front of them, a pile of gold coins is also decreasing in size, symbolizing a reduction in financial assets or market value. Decrease bar illustrations Business professionals observing a declining market trend with diminishing financial assets isolated on white background. The image depicts two business. The image depicts two business professionals standing beside a bar chart that shows a downward trend, indicating a decline. In front of them, a pile of gold coins is also decreasing in size, symbolizing a reduction in financial assets or market value
Free with trial Professional vector illustration of downward sloping bar graph and connected dots line represents decreasing profits market loss economic recession data analysis results reduction in growth levels and monthly revenue falling. Decrease bar illustrations Descending bar chart icon with line graph showing negative business trends and financial decline on transparent background. Professional vector illustration of downward sloping bar graph and connected dots line represents decreasing profits market loss economic recession data analysis results reduction in growth levels and monthly revenue falling
Free with trial Striking AI-generated visualization of a sharp financial crisis. This 3D render, featuring a bar chart and a glowing downward arrow, clearly communicates economic distress and market volatility, providing essential data imagery for investors and businesses tracking performance decline. Decrease bar illustrations Conceptual 3D bar chart illustrating drastic market collapse and financial loss with a glowing downward arrow on a neutral backgro. Striking AI-generated visualization of a sharp financial crisis. This 3D render, featuring a bar chart and a glowing downward arrow, clearly communicates economic distress and market volatility, providing essential data imagery for investors and businesses tracking performance decline.
Free with trial Dark blue background as EU European Union, Europe, silhouette outline map of Germany and increasing rising uptrend bar-chart as economy and industry success image symbolic. Decrease bar illustrations Dark blue background as EU European Union, Europe, silhouette outline map of Germany and increasing rising uptrend bar-chart as
Free with trial Colorful bar charts illustrating positive and negative business trends from january to may provide a clear visual representation of performance. Decrease bar vectors Colorful bar charts illustrating positive and negative business trends from january to may provide a clear visual
Free with trial Colorful bar charts are presenting statistical trends and business performance data across different time periods. Possibly days of the week. Using a vibrant color scheme of blue. Purple. And orange. Decrease bar illustrations Colorful bar charts are presenting statistical trends and business performance data across different time periods
Free with trial Four colorful bar charts are displayed on a graph, representing trends, statistics, and timeline data, with a potential focus on business infographics elements. Decrease bar illustrations Four colorful bar charts are displayed on a graph, representing trends, statistics, and timeline data, with a potential
Free with trial A layered arrangement of dark wooden blocks displaying decreasing red and tan bars, with a downward arrow illustrating a downturn in financial or market performance. Decrease bar illustrations Stacked black wooden cubes with red and tan descending bar charts and downward arrow symbolizing financial or business decline. A layered arrangement of dark wooden blocks displaying decreasing red and tan bars, with a downward arrow illustrating a downturn in financial or market performance
Free with trial Colorful bar charts illustrating positive and negative business trends from january to may provide a clear visual representation of performance. Decrease bar illustrations Colorful bar charts illustrating positive and negative business trends from january to may provide a clear visual
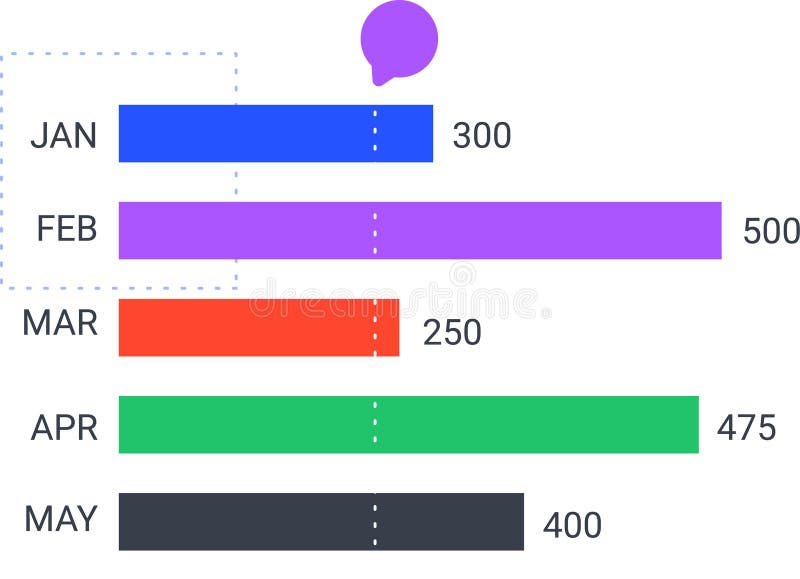
Free with trial Colorful horizontal bar chart is displaying monthly statistics from january to may, indicating trends and performance with a speech bubble above. Decrease bar vectors Colorful horizontal bar chart is displaying monthly statistics from january to may, indicating trends and performance
Free with trial Colorful horizontal bar chart is displaying monthly statistics from january to may, indicating trends and performance with a speech bubble above. Decrease bar vectors Colorful horizontal bar chart is displaying monthly statistics from january to may, indicating trends and performance
Free with trial Up and Down sign with blue and red arrows vector illustration. Concept of sales bar chart symbol icon with arrow moving down and sales bar chart with arrow moving up. Decrease bar vectors Up and Down sign with blue and red arrows vector illustration. Concept of sales bar chart symbol
Free with trial Stock market trading technical analysis bar chart fall banner. Business candlestick graph exchange down trend. Economic crisis and investment loss graph. Trader financial index crash. Money losing eps. Decrease bar vectors Stock market trading technical analysis bar chart fall banner. Business candlestick graph exchange down trend. Economic
Free with trial Decrease icon or logo isolated sign symbol vector illustration - Collection of high quality black style vector icons, seles chart icon isolated sign symbol vector illustration - Collection of high quality. Decrease bar vectors Decrease icon or logo isolated sign symbol vector illustration
Free with trial Graphical depiction of declining gold prices Three labeled gold bars on line graph showing downturn trend Red arrow indicates decrease against grid patterned background, suggesting financial or economic analysis related to gold markets For Social Media Post Size. Decrease bar illustrations Declining gold prices depicted with red arrow, gold bars, downturn trend. Graphical depiction of declining gold prices Three labeled gold bars on line graph showing downturn trend Red arrow indicates decrease against grid patterned background, suggesting financial or economic analysis related to gold markets For Social Media Post Size
Free with trial Graphical depiction of declining gold prices Three labeled gold bars on line graph showing downturn trend Red arrow indicates decrease against grid patterned background, suggesting financial or economic analysis related to gold markets. Decrease bar illustrations Declining gold prices depicted with red arrow, gold bars, downturn trend. Graphical depiction of declining gold prices Three labeled gold bars on line graph showing downturn trend Red arrow indicates decrease against grid patterned background, suggesting financial or economic analysis related to gold markets
Free with trial This graphic illustrates stable bank withdrawals alongside a rising financial trend with coins and bars, Bank withdrawals are currently stable and not showing any significant increase or decrease. Decrease bar vectors This graphic illustrates stable bank withdrawals alongside a rising financial trend with coins and bars, Bank withdrawals are
Free with trial Stock market trading technical analysis bar chart fall banner. Business candlestick graph exchange down trend. Economic downturn and investment loss graph. Trader financial index crash and bankruptcy. Decrease bar illustrations Stock market trading technical analysis bar chart fall banner. Business candlestick graph exchange down trend. Economy. Stock market trading technical analysis bar chart fall banner. Business candlestick graph exchange down trend. Economic downturn and investment loss graph. Trader financial index crash and bankruptcy
Free with trial Stock market trading technical analysis bar chart fall banner. Business candlestick graph exchange down trend. Economic downturn and investment loss graph. Trader financial index crash and bankruptcy. Decrease bar vectors Stock market trading technical analysis bar chart fall banner. Business candlestick graph exchange down trend. Economy. Stock market trading technical analysis bar chart fall banner. Business candlestick graph exchange down trend. Economic downturn and investment loss graph. Trader financial index crash and bankruptcy
Free with trial Up and Down sign with green and red arrows vector illustration. Concept of sales bar chart symbol icon with arrow moving down and sales bar chart with arrow moving up. Decrease bar vectors Up and Down sign with green and red arrows vector illustration. Concept of sales bar chart symbol icon with arrows. Up and Down sign with green and red arrows vector illustration. Concept of sales bar chart symbol icon with arrow moving down and sales bar chart with arrow moving up.
Free with trial An illustration of businessman leader watering seedling plant on bar graph with pollution smoke rising up. Climate crisis and environment policy, ESG or ecology problem concept. Decrease bar illustrations Businessman leader watering seedling plant on bar graph with pollution smoke rising up
Free with trial Reduction chart icon Vector symbol or sign set collection in black and white outline. Decrease bar vectors Decline Chart Icon Illustrating Decrease in Performance, Economic Downturn, and Analytical Data. Reduction chart icon Vector symbol or sign set collection in black and white outline
Free with trial Graph or block diagram shows the increase or decrease of shares, which means financial loss or gain -. Decrease bar illustrations Graph or block diagram shows the increase or decrease of shares, which means financial loss or gain
Free with trial Graph or block diagram shows the increase or decrease of shares, which means financial loss or gain -. Decrease bar illustrations Graph or block diagram shows the increase or decrease of shares, which means financial loss or gain
Free with trial Graph or block diagram shows the increase or decrease of shares, which means financial loss or gain -. Decrease bar illustrations Graph or block diagram shows the increase or decrease of shares, which means financial loss or gain
Free with trial Graph or block diagram shows the increase or decrease of shares, which means financial loss or gain -. Decrease bar illustrations Graph or block diagram shows the increase or decrease of shares, which means financial loss or gain
Free with trial Graph or block diagram shows the increase or decrease of shares, which means financial loss or gain -. Decrease bar illustrations Graph or block diagram shows the increase or decrease of shares, which means financial loss or gain
Free with trial Graph or block diagram shows the increase or decrease of shares, which means financial loss or gain -. Decrease bar illustrations Graph or block diagram shows the increase or decrease of shares, which means financial loss or gain
Free with trial Graph or block diagram shows the increase or decrease of shares, which means financial loss or gain -. Decrease bar illustrations Graph or block diagram shows the increase or decrease of shares, which means financial loss or gain
Free with trial Graph or block diagram shows the increase or decrease of shares, which means financial loss or gain -. Decrease bar illustrations Graph or block diagram shows the increase or decrease of shares, which means financial loss or gain
Free with trial Graph or block diagram shows the increase or decrease of shares, which means financial loss or gain -. Decrease bar illustrations Graph or block diagram shows the increase or decrease of shares, which means financial loss or gain
Free with trial Graph or block diagram shows the increase or decrease of shares, which means financial loss or gain -. Decrease bar illustrations Graph or block diagram shows the increase or decrease of shares, which means financial loss or gain
Free with trial Graph or block diagram shows the increase or decrease of shares, which means financial loss or gain -. Decrease bar illustrations Graph or block diagram shows the increase or decrease of shares, which means financial loss or gain
Free with trial Graph or block diagram shows the increase or decrease of shares, which means financial loss or gain -. Decrease bar illustrations Graph or block diagram shows the increase or decrease of shares, which means financial loss or gain
Free with trial Graph or block diagram shows the increase or decrease of shares, which means financial loss or gain -. Decrease bar illustrations Graph or block diagram shows the increase or decrease of shares, which means financial loss or gain
Free with trial Graph or block diagram shows the increase or decrease of shares, which means financial loss or gain -. Decrease bar illustrations Graph or block diagram shows the increase or decrease of shares, which means financial loss or gain
Free with trial Graph or block diagram shows the increase or decrease of shares, which means financial loss or gain -. Decrease bar illustrations Graph or block diagram shows the increase or decrease of shares, which means financial loss or gain
Free with trial Graph or block diagram shows the increase or decrease of shares, which means financial loss or gain -. Decrease bar illustrations Graph or block diagram shows the increase or decrease of shares, which means financial loss or gain
Free with trial Graph or block diagram shows the increase or decrease of shares, which means financial loss or gain -. Decrease bar illustrations Graph or block diagram shows the increase or decrease of shares, which means financial loss or gain
Free with trial Graph or block diagram shows the increase or decrease of shares, which means financial loss or gain -. Decrease bar illustrations Graph or block diagram shows the increase or decrease of shares, which means financial loss or gain
Free with trial Graph or block diagram shows the increase or decrease of shares, which means financial loss or gain -. Decrease bar illustrations Graph or block diagram shows the increase or decrease of shares, which means financial loss or gain
Free with trial Graph or block diagram shows the increase or decrease of shares, which means financial loss or gain -. Decrease bar illustrations Graph or block diagram shows the increase or decrease of shares, which means financial loss or gain
Free with trial Graph or block diagram shows the increase or decrease of shares, which means financial loss or gain -. Decrease bar illustrations Graph or block diagram shows the increase or decrease of shares, which means financial loss or gain
Free with trial Graph or block diagram shows the increase or decrease of shares, which means financial loss or gain -. Decrease bar illustrations Graph or block diagram shows the increase or decrease of shares, which means financial loss or gain
Free with trial Graph or block diagram shows the increase or decrease of shares, which means financial loss or gain -. Decrease bar illustrations Graph or block diagram shows the increase or decrease of shares, which means financial loss or gain
Free with trial Graph or block diagram shows the increase or decrease of shares, which means financial loss or gain -. Decrease bar illustrations Graph or block diagram shows the increase or decrease of shares, which means financial loss or gain
Free with trial Graph or block diagram shows the increase or decrease of shares, which means financial loss or gain -. Decrease bar illustrations Graph or block diagram shows the increase or decrease of shares, which means financial loss or gain
Free with trial Graph or block diagram shows the increase or decrease of shares, which means financial loss or gain -. Decrease bar illustrations Graph or block diagram shows the increase or decrease of shares, which means financial loss or gain
Free with trial Graph or block diagram shows the increase or decrease of shares, which means financial loss or gain -. Decrease bar illustrations Graph or block diagram shows the increase or decrease of shares, which means financial loss or gain
Free with trial Graph or block diagram shows the increase or decrease of shares, which means financial loss or gain -. Decrease bar illustrations Graph or block diagram shows the increase or decrease of shares, which means financial loss or gain
Free with trial Graph or block diagram shows the increase or decrease of shares, which means financial loss or gain -. Decrease bar illustrations Graph or block diagram shows the increase or decrease of shares, which means financial loss or gain
Free with trial Graph or block diagram shows the increase or decrease of shares, which means financial loss or gain -. Decrease bar illustrations Graph or block diagram shows the increase or decrease of shares, which means financial loss or gain