Free with trial Report using graphs and diagrams icons set vector illustration. Data analysis line icon. Growth in business, success and development concept. Decrease business development vectors Report for graphs and diagrams icons set. Report using graphs and diagrams icons set vector illustration. Data analysis line icon. Growth in business, success and development concept
Free with trial Business strategy icons set with chess game symbols flat isolated vector illustration. Decrease business development vectors Business Strategy Icons Set
Free with trial Business strategy composition with chess play symbols flat vector illustration. Decrease business development vectors Business Strategy Composition
Free with trial Futuristic Robot Hand Displaying Download Icon for Cost Reduction Strategy in Digital Business Environment Quark. Decrease business development illustrations Futuristic Robot Hand Displaying Download Icon for Cost Reduction Strategy in Digital Business Environment Quark
Free with trial Futuristic Robotic Hand Interacting with Digital Interface for Cost Analysis and Reduction Strategies in Business Environment Quark. Decrease business development illustrations Futuristic Robotic Hand Interacting with Digital Interface for Cost Analysis and Reduction Strategies in Business
Free with trial A comprehensive collection of hand-drawn business and data visualization icons. This doodle-style set features a variety of essential elements, including different types of arrows, bar graphs, line charts, and pie charts. The sketchy, black and white illustrations are perfect for infographics, presentations, financial reports, and marketing materials. Each icon is isolated on a white background, representing concepts like growth, statistics, process flow, and direction. This versatile vector set is ideal for adding a creative, hand-made touch to any project related to analytics, finance, or strategy. Decrease business development illustrations Hand Drawn Business and Finance Doodle Icon Set. A comprehensive collection of hand-drawn business and data visualization icons. This doodle-style set features a variety of essential elements, including different types of arrows, bar graphs, line charts, and pie charts. The sketchy, black and white illustrations are perfect for infographics, presentations, financial reports, and marketing materials. Each icon is isolated on a white background, representing concepts like growth, statistics, process flow, and direction. This versatile vector set is ideal for adding a creative, hand-made touch to any project related to analytics, finance, or strategy.
Free with trial Cost Analysis in Business Strategy: Hands on Laptop with Graphs and Icons Representing Marketing, Planning, and Research in Contemporary Workspace Quark. Decrease business development illustrations Cost Analysis in Business Strategy: Hands on Laptop with Graphs and Icons Representing Marketing, Planning, and Research
Free with trial Robotic Hand Interacting with Digital Cost Reduction Interface in a Futuristic Cityscape with Data Graphs and Business Icons Quark. Decrease business development illustrations Robotic Hand Interacting with Digital Cost Reduction Interface in a Futuristic Cityscape with Data Graphs and Business
Free with trial Abstract 3d bar charts illustrating data visualization, financial statistics, and business analysis, presenting growth and decline trends in a report format. Decrease business development illustrations Business data visualization showing 3d bar graphs. Abstract 3d bar charts illustrating data visualization, financial statistics, and business analysis, presenting growth and decline trends in a report format
Free with trial A pair of arrows represented increase profit and recession business. Flat thin line infographic template. Red progress arrow and blue recession arrow. Increase decrease graphs concept diagram chart. Decrease business development vectors Progress and recession. A pair of arrows represented increase profit and recession business. Flat thin line infographic template. Red progress arrow and blue recession arrow. Increase decrease graphs concept diagram chart.
Free with trial Aerial View of Business Professionals Collaborating on Cost Analysis with Laptop and Digital Graphs on Table in Modern Office Setting Quark. Decrease business development illustrations Aerial View of Business Professionals Collaborating on Cost Analysis with Laptop and Digital Graphs on Table in Modern
Free with trial Business Team Analyzing Cost Management Strategies Using Digital Technology in a Modern Workspace Environment Quark. Decrease business development illustrations Business Team Analyzing Cost Management Strategies Using Digital Technology in a Modern Workspace Environment Quark
Free with trial Business ranking up or down, situation for success and failure, growth or losing comparison, risk or challenge concept, businessman holding balloon rising up compare to other falling down with anchor. Decrease business development vectors Business ranking up or down, situation for success and failure, growth or losing comparison, risk or challenge concept
Free with trial Conceptual Image of Cost Analysis with Hands Reaching Out to Digital Graphs and Icons Representing Business Strategy and Financial Planning Quark. Decrease business development illustrations Conceptual Image of Cost Analysis with Hands Reaching Out to Digital Graphs and Icons Representing Business Strategy and
Free with trial Business professional analyzing cost reduction strategies with digital interface, graphic icons, and keyboard input in modern office environment Quark. Decrease business development illustrations Business professional analyzing cost reduction strategies with digital interface, graphic icons, and keyboard input in
Free with trial A collage of nine distinct charts and graphs, primarily displaying financial data, growth trends, and economic indicators. The visuals feature line graphs, area charts, and bar charts with various colored lines and shaded areas representing different metrics over time. Accompanying text and labels suggest analysis of business performance, economic growth, and financial markets. This collection is ideal for presentations, reports, and articles related to finance, economics, and business analytics. Decrease business development illustrations Collection of Financial and Business Growth Charts. A collage of nine distinct charts and graphs, primarily displaying financial data, growth trends, and economic indicators. The visuals feature line graphs, area charts, and bar charts with various colored lines and shaded areas representing different metrics over time. Accompanying text and labels suggest analysis of business performance, economic growth, and financial markets. This collection is ideal for presentations, reports, and articles related to finance, economics, and business analytics.
Free with trial Futuristic Robot Hand Interacting with Cost Analysis Concepts on Digital Screen in Modern Business Environment Quark. Decrease business development illustrations Futuristic Robot Hand Interacting with Cost Analysis Concepts on Digital Screen in Modern Business Environment Quark
Free with trial Illustration of a business activities. Decrease business development vectors Illustration of a business activities
Free with trial Income decrease graph, financial crisis rate, revenue decline chart, economy downturn, investment risk, fund management, budget deficit, vector illustration, flat icon. Decrease business development vectors Budget deficit, income decrease, economy decline, financial crisis, investment risk. Income decrease graph, financial crisis rate, revenue decline chart, economy downturn, investment risk, fund management, budget deficit, vector illustration, flat icon
Free with trial Three wooden blocks arranged in a step-like formation on a wooden surface, with an upward-pointing arrow on the middle block and a downward-pointing arrow on the top block, representing concepts of growth, decline, and change in business or finance. Decrease business development illustrations Wooden blocks with up and down arrows symbolizing business growth and decline. Three wooden blocks arranged in a step-like formation on a wooden surface, with an upward-pointing arrow on the middle block and a downward-pointing arrow on the top block, representing concepts of growth, decline, and change in business or finance
Free with trial Business Professional Highlighting Cost Management Strategies on a Digital Tablet with Visual Diagram and Infographic Elements Quark. Decrease business development illustrations Business Professional Highlighting Cost Management Strategies on a Digital Tablet with Visual Diagram and Infographic
Free with trial Robotic Hand Holding Computer Display with Cost Reduction Concept, Analyzing Data and Strategies for Business Growth in Digital World Quark. Decrease business development illustrations Robotic Hand Holding Computer Display with Cost Reduction Concept, Analyzing Data and Strategies for Business Growth in
Free with trial Futuristic Robot Hand Interacting with Cost Analysis Concept on a Digital Screen for Business Strategies and Financial Planning Insights Quark. Decrease business development illustrations Futuristic Robot Hand Interacting with Cost Analysis Concept on a Digital Screen for Business Strategies and Financial
Free with trial A conceptual image featuring a series of ascending wooden blocks, with a green upward arrow on a lower block and a red downward arrow on a higher block, symbolizing the fluctuating nature of business, market trends, and financial performance. The image conveys concepts of success, failure, progress, and setback in a clear and concise manner. Decrease business development illustrations Wooden Blocks with Up and Down Arrows Representing Business Growth and Decline. A conceptual image featuring a series of ascending wooden blocks, with a green upward arrow on a lower block and a red downward arrow on a higher block, symbolizing the fluctuating nature of business, market trends, and financial performance. The image conveys concepts of success, failure, progress, and setback in a clear and concise manner
Free with trial Abstract negative business graph results vector ilustration. Decrease business development vectors Abstract negative business graph results vector abstract negative business graph results vector. Abstract negative business graph results vector ilustration
Free with trial Robotic Hand Interacting with Cost Reduction Concept on Digital Screen in a High-Tech Cityscape Background for Business Applications Quark. Decrease business development illustrations Robotic Hand Interacting with Cost Reduction Concept on Digital Screen in a High-Tech Cityscape Background for Business
Free with trial Futuristic Robotic Hand Interacting with Cost Analysis Interface and Business Strategy Elements in a Digital Environment Quark. Decrease business development illustrations Futuristic Robotic Hand Interacting with Cost Analysis Interface and Business Strategy Elements in a Digital Environment
Free with trial Futuristic Robot Hand Representing Cost Reduction Strategies in Digital Business Environment with Graphs and Icons Quark. Decrease business development illustrations Futuristic Robot Hand Representing Cost Reduction Strategies in Digital Business Environment with Graphs and Icons Quark
Free with trial Reduction graph concept. Blue arrow depict recession business. Flat illustration of fallof arrow with shadow as an element for infographic, article background for internet, publish, social networks. Decrease business development vectors Recession Business Concept. Reduction graph concept. Blue arrow depict recession business. Flat illustration of fallof arrow with shadow as an element for infographic, article background for internet, publish, social networks.
Free with trial A collage of various hand-drawn charts and graphs in shades of blue, illustrating business growth, data analysis, and financial trends. The collection includes bar charts, line graphs, and pie charts, all rendered with a sketchy, artistic style. These visuals are perfect for presentations, reports, or any project requiring a dynamic and informative representation of data and progress. Decrease business development illustrations Hand-Drawn Business Growth Charts and Graphs Collection. A collage of various hand-drawn charts and graphs in shades of blue, illustrating business growth, data analysis, and financial trends. The collection includes bar charts, line graphs, and pie charts, all rendered with a sketchy, artistic style. These visuals are perfect for presentations, reports, or any project requiring a dynamic and informative representation of data and progress.
Free with trial Abstract illustration of business growth, featuring bar graphs and line graphs in shades of blue and grey. The image conveys concepts of data analysis, progress, and financial performance. Suitable for presentations, reports, and marketing materials related to business, finance, and technology. Decrease business development illustrations Abstract Business Growth Chart. Abstract illustration of business growth, featuring bar graphs and line graphs in shades of blue and grey. The image conveys concepts of data analysis, progress, and financial performance. Suitable for presentations, reports, and marketing materials related to business, finance, and technology.
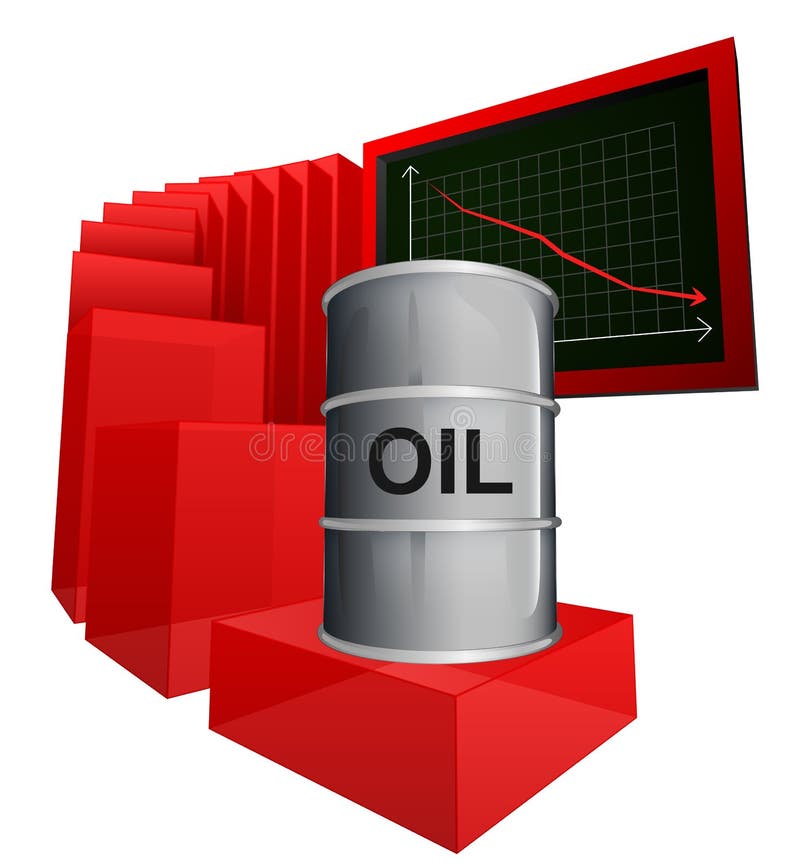
Free with trial Negative business graph of oil goods vector ilustration. Decrease business development vectors Negative business graph of oil goods vector
Free with trial Modern collection of business and finance elements. Contains data, charts,diagrams. Use it for presentation, report and infographic projects. Decrease business development vectors Set of Business and Finance Infographic Elements on Transparent Background Vectors. Modern collection of business and finance elements. Contains data, charts,diagrams. Use it for presentation, report and infographic projects
Free with trial Negative business graph of golden goods vector ilustration. Decrease business development vectors Negative business graph of golden goods vector
Free with trial A collection of colorful flat icons representing marketing and business concepts like growth, analytics, and strategy. Decrease business development illustrations Marketing and Business Growth Icons Set for Digital Strategy and Analytics image photo. A collection of colorful flat icons representing marketing and business concepts like growth, analytics, and strategy
Free with trial This image showcases a comprehensive collection of blue bar graphs and line graphs, presented in a grid format. Each graph depicts various data trends, including upward and downward movements, fluctuating patterns, and steady growth. The clean, modern design makes these icons ideal for representing financial data, market analysis, performance metrics, and business growth in presentations, reports, and websites. Decrease business development illustrations Collection of Blue Bar and Line Graphs for Business Analytics. This image showcases a comprehensive collection of blue bar graphs and line graphs, presented in a grid format. Each graph depicts various data trends, including upward and downward movements, fluctuating patterns, and steady growth. The clean, modern design makes these icons ideal for representing financial data, market analysis, performance metrics, and business growth in presentations, reports, and websites.
Free with trial Decreasing graph concept. Blue arrow depict recession business. Flat illustration of broken fallof arrow as an element for infographic, article background for internet, publish, social networks. Decrease business development vectors Recession Business Concept 4. Decreasing graph concept. Blue arrow depict recession business. Flat illustration of broken fallof arrow as an element for infographic, article background for internet, publish, social networks.
Free with trial Negative business banking results of Dollar vector illustration. Decrease business development vectors Negative business banking results of Dollar vector
Free with trial Reduction graph concept. Red arrow depict recession business. Flat illustration of broken downward arrow as an element for infographic, article background for web, publish, social networks. Decrease business development vectors Recession Business Concept 3. Reduction graph concept. Red arrow depict recession business. Flat illustration of broken downward arrow as an element for infographic, article background for web, publish, social networks.
Free with trial A focused hand uses red chalk drawing downward arrow on blackboard showing negative business concept and pessimistic financial decline. Decrease business development illustrations Focused hand uses red chalk drawing downward arrow on blackboard showing negative business concept and pessimistic financial. A focused hand uses red chalk. A focused hand uses red chalk drawing downward arrow on blackboard showing negative business concept and pessimistic financial decline
Free with trial Businessman and stock market arrow presentation. Cheerful businessman with graph indicating increase. The concept of business success. Can be used for workflow layout, banner, diagram, number options, step up options, web design, timeline, infographic template. Vector illustration. Decrease business development vectors Businessman and stock market arrow presentation.Cheerful businessman with graph indicating increase.The concept of business
Free with trial Avoid financial leverage RGB color icon. Stock market risk. Business asset. Trading disadvantage. Finance debt. Economy and banking. Decrease in earnings. Isolated vector illustration. Decrease business development vectors Avoid financial leverage RGB color icon
Free with trial Graphic visual representation of bar chart data analysis for business growth and market trends ,Generative ai. Decrease business development illustrations Comprehensive data analysis, visualizing business growth and market trends through bar chart graphics. Graphic visual representation of bar chart data analysis for business growth and market trends ,Generative ai
Free with trial Businessman hand pushing a business graph on a touch screen interface. Hand holding business graph. Isolated on white background. Vector illustration flat design. Decrease business development vectors Businessman hand pushing a business graph on a touch screen interface.Hand holding business graph.Isolated on white background.
Free with trial Chart graph. Black Icon growth and downward with arrow isolated on background. Hologram positive, fall percentage. Design business concept direction growth, recession. Analysis. Vector illustration. Decrease business development vectors Chart graph. Black Icon growth and downward with arrow isolated on background. Hologram positive, fall percentage. Design business
Free with trial This infographic-style image visually represents business growth and financial performance through various charts and graphs. A line graph illustrates revenue trends with percentage markers, a donut chart displays market share distribution, and a bar chart shows quarterly profit figures. Icons representing data, growth, and reports are subtly integrated into the background, creating a professional and informative visual for business and finance-related content. Decrease business development illustrations Business Growth and Financial Performance Analytics. This infographic-style image visually represents business growth and financial performance through various charts and graphs. A line graph illustrates revenue trends with percentage markers, a donut chart displays market share distribution, and a bar chart shows quarterly profit figures. Icons representing data, growth, and reports are subtly integrated into the background, creating a professional and informative visual for business and finance-related content.
Free with trial A vibrant collection of hand-drawn business charts and graphs, rendered in blue tones. The set includes various types of visualizations like bar charts, line graphs, and a pie chart, all with a sketchy, illustrative style. These visuals are ideal for presentations, reports, and infographics related to finance, data analysis, growth, and business performance. Decrease business development illustrations Hand-Drawn Business Charts and Graphs Collection. A vibrant collection of hand-drawn business charts and graphs, rendered in blue tones. The set includes various types of visualizations like bar charts, line graphs, and a pie chart, all with a sketchy, illustrative style. These visuals are ideal for presentations, reports, and infographics related to finance, data analysis, growth, and business performance.
Free with trial Analyze Data with Graphs on Tablet, Business Growth Concept and Wood Background , subtle gradient. Decrease business development illustrations Analyze Data with Graphs on Tablet, Business Growth Concept and Wood Background
Free with trial Vector hand drawn business concept sketch. Businessman sitting on his haunches and trying to lift falling indicator of growth by hands. Lettering Business concept. Decrease business development vectors Hand drawn businessman, business concept lettering. Vector hand drawn business concept sketch. Businessman sitting on his haunches and trying to lift falling indicator of growth by hands. Lettering Business concept
Free with trial Sad face beside declining line graph and bar chart, symbolizing setbacks. Ideal for finance, business, economy, loss, analytics, crisis performance. Simple flat metaphor. Decrease business development vectors Negative Trend Line and Declining Bar Chart Representing Business Loss or Financial Downturn. Sad face beside declining line graph and bar chart, symbolizing setbacks. Ideal for finance, business, economy, loss, analytics, crisis performance. Simple flat metaphor
Free with trial Beverage keg with negative business calculations isolated on white illustration. Decrease business development illustrations Beverage keg with negative business calculations isolated on white
Free with trial A conceptual vector illustration depicting business analysis and market research. A hand holds a magnifying glass, focusing on a colorful financial chart with bar and line graphs labeled 'Market Trends'. Surrounding icons represent key business metrics like growth, decline, market share, and innovation. This flat design graphic is ideal for presentations, reports, and web content related to data analytics, strategic planning, and financial performance evaluation, symbolizing the scrutiny of data to identify opportunities and understand market dynamics. Decrease business development illustrations Business Analysis and Market Trends Concept with Magnifying Glass. A conceptual vector illustration depicting business analysis and market research. A hand holds a magnifying glass, focusing on a colorful financial chart with bar and line graphs labeled 'Market Trends'. Surrounding icons represent key business metrics like growth, decline, market share, and innovation. This flat design graphic is ideal for presentations, reports, and web content related to data analytics, strategic planning, and financial performance evaluation, symbolizing the scrutiny of data to identify opportunities and understand market dynamics.
Free with trial Progress and regress in business concept. Young sad businessman and happy business woman standing holding arrows up and down meaning development and failure. Decrease business development vectors Progress and regress in business concept
Free with trial Dollar golden coin with negative business calculations isolated on white illustration. Decrease business development illustrations Dollar golden coin with negative business calculations isolated on white
Free with trial A business professional conducts a thorough analysis of financial data using a magnifying glass, illustrating market trends with graphs and charts on a digital interface. Scalp. Decrease business development illustrations Business Professional Analyzing Financial Data with a Magnifying Glass, Graphs, and Visual Representation of Market. A business professional conducts a thorough analysis of financial data using a magnifying glass, illustrating market trends with graphs and charts on a digital interface. Scalp
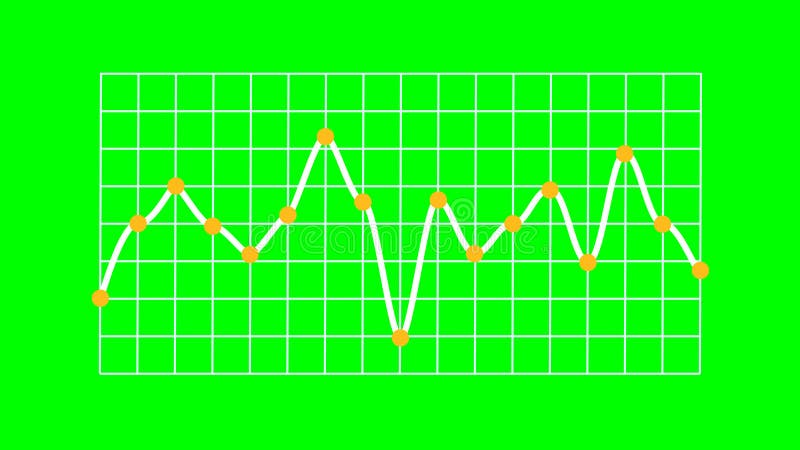
Free with trial Rendered line graph showing a single white line indicating data trends with distinct fluctuations. Yellow marker points animate vertically from the X-axis, and each plotted value features an orange circular dot. The white line runs over a structured white grid on a bright green screen background, enabling chroma keying. No axis values or units are present, emphasizing visual representation of abstract data and business trends. Decrease business development illustrations Business Trend Line Graph Showing Trading on Green Screen. Rendered line graph showing a single white line indicating data trends with distinct fluctuations. Yellow marker points animate vertically from the X-axis, and each plotted value features an orange circular dot. The white line runs over a structured white grid on a bright green screen background, enabling chroma keying. No axis values or units are present, emphasizing visual representation of abstract data and business trends.
Free with trial Crisis in the world business market on background. Decrease business development illustrations Crisis in the world business market
Free with trial Graph reduction with arrow down, line chart icon. Financial fall, decrease, fail. Statistics and analytics. Vector flat illustration. Decrease business development vectors Graph reduction with arrow down, line chart icon. Financial fall, decrease, fail. Statistics and analytics. Vector illustration
Free with trial A stark bar graph illustrates a clear downward trend, symbolized by a descending arrow. This image represents decline, decrease, or negative progression in data. Decrease business development vectors Vector art of bar graph with a downward trend line indicating decline or decrease in data. A stark bar graph illustrates a clear downward trend, symbolized by a descending arrow. This image represents decline, decrease, or negative progression in data
Free with trial This image showcases a person using a tablet to interact with business analytics data, generated by AI. The visualization includes graphs and charts, providing real-time insights into key performance indicators. This technology streamlines business decision-making. Decrease business development illustrations AI-Powered Business Analytics. This image showcases a person using a tablet to interact with business analytics data, generated by AI. The visualization includes graphs and charts, providing real-time insights into key performance indicators. This technology streamlines business decision-making.
Free with trial This image displays a bar graph visualizing a clear downward trend. Nine vertical blue bars gradually decrease in height from left to right, signifying a consistent decline in values. A white arrowed line diagonally descends across the graph, reinforcing the negative trend. Blue horizontal and vertical grid lines aid in alignment. The background is green screen, allowing for chroma key use. This chart effectively communicates decline in areas like business, finance, or performance. Decrease business development illustrations Downward Bar Graph Showing Financial Decline on Green Screen. This image displays a bar graph visualizing a clear downward trend. Nine vertical blue bars gradually decrease in height from left to right, signifying a consistent decline in values. A white arrowed line diagonally descends across the graph, reinforcing the negative trend. Blue horizontal and vertical grid lines aid in alignment. The background is green screen, allowing for chroma key use. This chart effectively communicates decline in areas like business, finance, or performance.
Free with trial Set Photo retouching Cloud technology data transfer Search engine Financial growth decrease Magnifying glass with check mark and New chat messages notification icon. Vector. Decrease business development vectors Set Photo retouching, Cloud technology data transfer, Search engine, Financial growth decrease, Magnifying glass with. Set Photo retouching Cloud technology data transfer Search engine Financial growth decrease Magnifying glass with check mark and New chat messages notification icon. Vector.
Free with trial Blue business abstract background with arrow. Decrease business development vectors Business background. Abstract Concept. Blue business abstract background with arrow
Free with trial Analyze Data with Colorful Graph and Notes for Business Planning Strategy , layered depth. Decrease business development illustrations Analyze Data with Colorful Graph and Notes for Business Planning Strategy
Free with trial This minus sign icon represents decrease and subtraction. Decrease business development vectors Minus Sign Icon for Decrease. This minus sign icon represents decrease and subtraction.
Free with trial Graph growth with arrow up and reduction with arrow down, line chart icon. Financial invest, fall, increase and decrease. Statistics and analytics. Vector flat illustration. Decrease business development vectors Graph growth with arrow up and reduction with arrow down, line chart icon. Financial invest, fall, increase and decrease
Free with trial Graph growth with arrow up and reduction with arrow down, line chart icon. Financial invest, fall, increase and decrease. Statistics and analytics. Vector flat illustration. Decrease business development vectors Graph growth with arrow up and reduction with arrow down, line chart icon. Financial invest, fall, increase and decrease
Free with trial Abstract Business Growth Chart with Vintage Texture. Decrease business development illustrations Abstract Business Growth Chart with Vintage Texture
Free with trial Growth development graph rise icon. Vector graphic design. Decrease business development vectors Graph up down growth development icon. Growth development graph rise icon. Vector graphic design.
Free with trial A 3D rendered bar chart encased in clear glass, displaying year-end business performance. The chart features three vertical bars in blue, pink, and yellow, representing 61%, 24%, and 35% respectively. The clean, modern design and transparent material create a sophisticated visual suitable for presentations, reports, and data visualization concepts related to business growth, financial analysis, and success metrics. Decrease business development illustrations Year End Business Performance Chart. A 3D rendered bar chart encased in clear glass, displaying year-end business performance. The chart features three vertical bars in blue, pink, and yellow, representing 61%, 24%, and 35% respectively. The clean, modern design and transparent material create a sophisticated visual suitable for presentations, reports, and data visualization concepts related to business growth, financial analysis, and success metrics.
Free with trial Trend artwork composite banner 3D photo collage of analyzing graphics target goal business young man scream pressure arrow down crisis. Decrease business development illustrations Trend artwork composite banner 3D photo collage of analyzing graphics target goal business young man scream pressure
Free with trial A vibrant 3D bar chart, featuring glossy blue and orange rectangular segments, illustrates data progression or comparison. The varying bar heights convey growth or statistical analysis. This modern graphic is ideal for business, finance, and analytical concepts, presented cleanly isolated on a transparent background. Decrease business development vectors Glossy 3D bar chart showing data growth and statistics with blue and orange segments, perfect for business and finance presentatio. A vibrant 3D bar chart, featuring glossy blue and orange rectangular segments, illustrates data progression or comparison. The varying bar heights convey growth or statistical analysis. This modern graphic is ideal for business, finance, and analytical concepts, presented cleanly isolated on a transparent background.
Free with trial This set includes 15 high-quality, vector business icons representing various aspects of finance, networking, and growth. Perfect for websites, presentations, and applications. These simple yet effective icons provide visual clarity and professionalism. Decrease business development illustrations Business Icon Set. This set includes 15 high-quality, vector business icons representing various aspects of finance, networking, and growth. Perfect for websites, presentations, and applications. These simple yet effective icons provide visual clarity and professionalism.
Free with trial A collection of business-related icons illustrating various aspects of business, including target achievement, growth, decline, and organizational structure. Decrease business development vectors Vector art of a set of business icons, , representing target achievement, growth, decline, and structure in a business or. A collection of business-related icons illustrating various aspects of business, including target achievement, growth, decline, and organizational structure
Free with trial Decreasing graph concept. Red arrow depict recession business. Flat illustration of downward arrow with shadow as an element for infographic, article background for web, publish, social networks. Decrease business development vectors Recession Business Concept. Decreasing graph concept. Red arrow depict recession business. Flat illustration of downward arrow with shadow as an element for infographic, article background for web, publish, social networks.
Free with trial Data Visualization Colorful Chart and Graph Design, Analytics, Business Intelligence Data analysis, Infographic , This photo was created using generative AI. Decrease business development illustrations Data Visualization Colorful Chart and Graph Design, Analytics, Business Intelligence Data analysis, Infographic
Free with trial The image shows two hands each holding a sign. The left hand holds a sign with a green upward arrow labeled 'Quality,' indicating an increase. The right hand holds a sign with a red downward arrow labeled 'Cost,' indicating a decrease. Decrease business development illustrations Hands holding signs indicating increase in quality and decrease in cost. The image shows two hands each holding a sign. The left hand holds a sign with a green upward arrow labeled 'Quality,' indicating an increase. The right hand holds a sign with a red downward arrow labeled 'Cost,' indicating a decrease
Free with trial A minimalist black icon depicting a business data chart. It features a bar graph with multiple vertical bars, overlaid by two distinct line graphs. One line graph shows an upward trend with data points, symbolizing growth and success, while the other illustrates a downward trend, representing decline or loss. This versatile vector illustration is ideal for conveying concepts related to financial analysis, market trends, business performance, statistics, and economic fluctuations. Perfect for web interfaces, presentations, reports, and infographics. Decrease business development vectors Business Data Analysis Chart Icon with Trends. A minimalist black icon depicting a business data chart. It features a bar graph with multiple vertical bars, overlaid by two distinct line graphs. One line graph shows an upward trend with data points, symbolizing growth and success, while the other illustrates a downward trend, representing decline or loss. This versatile vector illustration is ideal for conveying concepts related to financial analysis, market trends, business performance, statistics, and economic fluctuations. Perfect for web interfaces, presentations, reports, and infographics.
Free with trial An unstable business situation. A businessman flying in a balloon symbolizes success, while another businessman descending symbolizes business failure. Decrease business development vectors The business situation is fluctuating and unstable. An unstable business situation. A businessman flying in a balloon symbolizes success, while another businessman descending symbolizes business failure
Free with trial Cost versus quality optimization concept with business professional analyzing charts by increasing quality while reducing cost representing efficiency, performance improvement, cost management. Decrease business development illustrations Cost versus quality optimization concept with business professional analyzing charts by increasing quality while reducing cost