Free with trial Set of nine linear icons illustrating various aspects of business strategy, planning, and progress. The icons feature minimalist line art depicting concepts like mountain peaks symbolizing achievement, graphs showing growth, light bulbs representing ideas, and other business related symbols. Ideal. Decrease business development vectors Collection of Linear Icons Representing Business Strategy and Progress. Set of nine linear icons illustrating various aspects of business strategy, planning, and progress. The icons feature minimalist line art depicting concepts like mountain peaks symbolizing achievement, graphs showing growth, light bulbs representing ideas, and other business related symbols. Ideal
Free with trial Set Browser window Cloud technology data transfer Search engine Mobile phone Server Data Financial growth decrease and icon. Vector. Decrease business development vectors Set Browser window, Cloud technology data transfer, Search engine, Mobile phone, Server, Data, Financial growth decrease. Set Browser window Cloud technology data transfer Search engine Mobile phone Server Data Financial growth decrease and icon. Vector.
Free with trial Infographic world map with charts, graphs, and data visualizations for business reports, presentations, and website content, vibrant background Generative AI. Decrease business development illustrations Infographic world map with charts, graphs, and data visualizations for business reports, presentations, and website content
Free with trial This 3D rendering shows vibrant bar and pie charts illustrating business growth, data analysis, and statistical visualization. Perfect for presentations, reports, or marketing materials. Decrease business development illustrations Colorful 3D Bar and Pie Charts Representing Business Growth and Data Analysis. This 3D rendering shows vibrant bar and pie charts illustrating business growth, data analysis, and statistical visualization. Perfect for presentations, reports, or marketing materials.
Free with trial This image captures a conceptual business planning session, suggesting a focus on market trend analysis, charting of progress and addressing potential declines. Decrease business development illustrations Conceptual business strategy session with downward trend and coffee break. This image captures a conceptual business planning session, suggesting a focus on market trend analysis, charting of progress and addressing potential declines
Free with trial Business portfolio with three arrows pointing down, representing a decrease in value or career prospects. Decrease business development vectors Portfolio under pressure falling business icon showing decreasing career opportunities. Business portfolio with three arrows pointing down, representing a decrease in value or career prospects
Free with trial Colorful isometric bar chart showing business data and growth with bars of different height, colored blue, yellow and green. Isolated on a transparent background, perfect for business presentations or infographics. Decrease business development vectors Colorful business chart illustration on transparent background AI Generated. Colorful isometric bar chart showing business data and growth with bars of different height, colored blue, yellow and green. Isolated on a transparent background, perfect for business presentations or infographics.
Free with trial Hand drawn bar chart illustration showing data statistics and business growth. Decrease business development vectors Hand drawn bar chart illustration showing data statistics and business growth
Free with trial CO2 reducing icon on green leaf with water droplet for decrease CO2,carbon footprint and carbon credit to limit global warming from climate change,Bio Circular Green Economy concept. Decrease business development illustrations CO2 reducing icon on green leaf with water droplet for decrease CO2 , carbon footprint and carbon credit to limit global warming. CO2 reducing icon on green leaf with water droplet for decrease CO2,carbon footprint and carbon credit to limit global warming from climate change,Bio Circular Green Economy concept.
Free with trial Business graph data analysis on wooden desk with pencils, bananas and notebooks. Decrease business development illustrations Business graph data analysis on wooden desk with pencils, bananas and notebooks
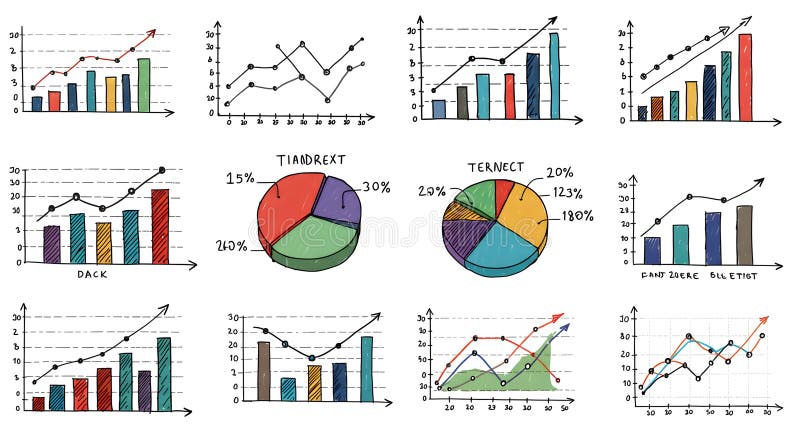
Free with trial A collection of hand-drawn style charts and diagrams that can be used to display data and analyze progress, ideal for business presentations, reports, or data visualizations. Decrease business development illustrations Hand-Drawn Collection of Statistical Charts and Diagrams for Business Analytics. A collection of hand-drawn style charts and diagrams that can be used to display data and analyze progress, ideal for business presentations, reports, or data visualizations
Free with trial Various customer people giving 5 stars review for quality service. Effort and drive as a person pushes a big gauge toward green. Business superhero looking on top mountain peak using telescope. Decrease business development vectors Customer loyalty. Reduce risk level. Business vision concept to see journey to success. Various customer people giving 5 stars review for quality service. Effort and drive as a person pushes a big gauge toward green. Business superhero looking on top mountain peak using telescope
Free with trial Chess king symbolizing leadership beside a declining bar graph for strategy, business performance. Ideal for growth analysis, planning, decision-making, leadership vision, competition, management. Decrease business development illustrations Strategic planning concept with chess king and declining bar chart for business analysis insights. Chess king symbolizing leadership beside a declining bar graph for strategy, business performance. Ideal for growth analysis, planning, decision-making, leadership vision, competition, management
Free with trial Cost and quality control, business strategy and project management concept. Businessman use computer laptop with quality control growth graph and cost reduction, control budget cost and improvement. Decrease business development illustrations Cost and quality control, business strategy and project management concept. Businessman use computer laptop with quality control
Free with trial Backup logo design with editable slogan. Business card and branding book template. Decrease business development vectors Backup logo design with editable slogan. Branding book and business card template. Backup logo design with editable slogan. Business card and branding book template.
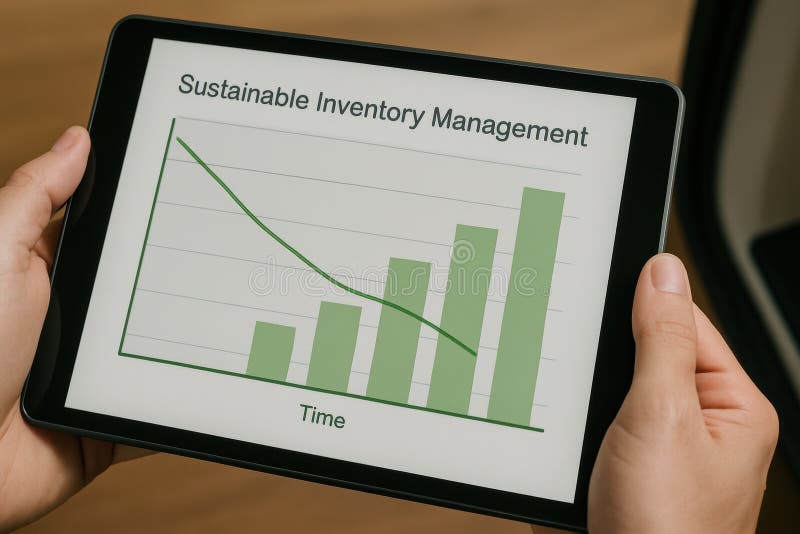
Free with trial A detailed graph displaying sustainable inventory management trends on a tablet device. This image highlights data analytics for business strategy and efficiency. Decrease business development illustrations Sustainable Inventory Management Graph on Tablet Device for Business Analytics and Strategy. A detailed graph displaying sustainable inventory management trends on a tablet device. This image highlights data analytics for business strategy and efficiency
Free with trial This image captures the concept of business growth and the importance of cost reduction The image features a person working on a laptop and a tablet with digital arrows indicating profit increasing and cost decreasing It emphasizes the need to balance both factors to achieve overall success in business. Decrease business development illustrations Business growth and cost reduction concept with technology application illustration. This image captures the concept of business growth and the importance of cost reduction The image features a person working on a laptop and a tablet with digital arrows indicating profit increasing and cost decreasing It emphasizes the need to balance both factors to achieve overall success in business
Free with trial Rise vs Risk symbol. Turned wooden cubes with words Risk vs Rise. Businessman hand. Business and Rise vs Risk concept. Copy space. 3D rendering on blue background. Decrease business development illustrations Rise vs Risk symbol. Turned wooden cubes with words Risk vs Rise. Businessman hand. Business and Rise vs Risk concept.
Free with trial Plant growing on coins stacking with carbon reduction sign for carbon credit and footprint can make more business profit and limit global warming from climate change concept. Decrease business development illustrations Plant growing on coins stacking with carbon reduction sign for carbon credit and footprint can make more business profit and
Free with trial Creative collage illustration picture standing young woman arrow upwards arrow downwards symbol progress decrease achieve template. Decrease business development illustrations Creative collage illustration picture standing young woman arrow upwards arrow downwards symbol progress decrease
Free with trial A stylized 3D business growth chart depicted against a light blue background. The chart features a blue mountain-like shape representing a peak, with two intersecting lines. One line, marked with pink nodes, shows fluctuations, while another line with green nodes indicates a general upward trend. This visual metaphor conveys concepts of business performance, market trends, and financial analysis. Decrease business development illustrations 3D Stylized Business Growth Chart with Red and Green Nodes on Blue Background graph data. A stylized 3D business growth chart depicted against a light blue background. The chart features a blue mountain-like shape representing a peak, with two intersecting lines. One line, marked with pink nodes, shows fluctuations, while another line with green nodes indicates a general upward trend. This visual metaphor conveys concepts of business performance, market trends, and financial analysis
Free with trial Green cube with an upward arrow, symbolizing business progress, finance and investment growth. Close-up. Decrease business development illustrations Green cube with an upward arrow, symbolizing business progress, finance and investment growth
Free with trial Set line Search engine, Mobile phone, Browser window and Financial growth decrease icon. Vector. Decrease business development vectors Set line Search engine, Mobile phone, Browser window and Financial growth decrease icon. Vector
Free with trial CO2 emission reduction concept with environmental icons, global warming, climate change, carbon footprint, sustainable development, Greenhouse, connectivity, renewable energy green business background. Generative AI. Decrease business development illustrations CO2 emission reduction concept with environmental icons. Generative AI. CO2 emission reduction concept with environmental icons, global warming, climate change, carbon footprint, sustainable development, Greenhouse, connectivity, renewable energy green business background. Generative AI
Free with trial 3d bar chart illustrating growth, analysis, and business progress with colorful visual representation of data ,Generative ai. Decrease business development illustrations 3d bar chart, visualizing growth, data analysis, and business progress for effective communication. 3d bar chart illustrating growth, analysis, and business progress with colorful visual representation of data ,Generative ai
Free with trial Cost reduction concept on wooden cube, Expenses and saving money, Business strategy and project management, cost reduction, efficient business and budget cutting. Decrease business development illustrations Cost reduction concept on wooden cube, Expenses and saving money, Business strategy and project management, cost reduction
Free with trial Gold business icons on dark background graphs, charts, money, global, growth, finance, planning, idea, vibrant background Generative AI. Decrease business development illustrations Gold business icons on dark background graphs, charts, money, global, growth, finance, planning, idea
Free with trial Modern Robot Hands Interacting with Digital Cost Reduction Concept on Futuristic Background Representing Business Strategy and Brand Analysis Quark. Decrease business development illustrations Modern Robot Hands Interacting with Digital Cost Reduction Concept on Futuristic Background Representing Business
Free with trial Red cube with arrow up. Business and market growth concept. Close-up. Decrease business development illustrations Red cube with arrow up. Business and market growth concept
Free with trial Red cube with arrow up. Business and market growth concept. Close-up. Decrease business development illustrations Red cube with arrow up. Business and market growth concept
Free with trial Red cube with arrow up. Business and market growth concept. Close-up. Decrease business development illustrations Red cube with arrow up. Business and market growth concept
Free with trial Red cube with arrow up. Business and market growth concept. Close-up. Decrease business development illustrations Red cube with arrow up. Business and market growth concept
Free with trial Red cube with arrow up. Business and market growth concept. Close-up. Decrease business development illustrations Red cube with arrow up. Business and market growth concept
Free with trial Red cube with arrow up. Business and market growth concept. Close-up. Decrease business development illustrations Red cube with arrow up. Business and market growth concept
Free with trial Red cube with arrow up. Business and market growth concept. Close-up. Decrease business development illustrations Red cube with arrow up. Business and market growth concept
Free with trial Red cube with arrow up. Business and market growth concept. Close-up. Decrease business development illustrations Red cube with arrow up. Business and market growth concept
Free with trial Green cube with arrow up. Business and market growth concept. Close-up. Decrease business development illustrations Green cube with arrow up. Business and market growth concept
Free with trial Green cube with arrow up. Business and market growth concept. Close-up. Decrease business development illustrations Green cube with arrow up. Business and market growth concept
Free with trial Green cube with arrow up. Business and market growth concept. Close-up. Decrease business development illustrations Green cube with arrow up. Business and market growth concept
Free with trial Green cube with arrow up. Business and market growth concept. Close-up. Decrease business development illustrations Green cube with arrow up. Business and market growth concept
Free with trial Set line Search engine, SEO optimization, Financial growth decrease and Browser setting icon. Vector. Decrease business development vectors Set line Search engine, SEO optimization, Financial growth decrease and Browser setting icon. Vector
Free with trial The Cost reduction and coins for Business concept 3d rendering. Decrease business development illustrations The Cost reduction and coins for Business concept 3d rendering
Free with trial The Cost reduction and coins for Business concept 3d rendering. Decrease business development illustrations The Cost reduction and coins for Business concept 3d rendering
Free with trial The Cost reduction and coins for Business concept 3d rendering. Decrease business development illustrations The Cost reduction and coins for Business concept 3d rendering
Free with trial The Cost reduction and coins for Business concept 3d rendering. Decrease business development illustrations The Cost reduction and coins for Business concept 3d rendering
Free with trial The Cost reduction and coins for Business concept 3d rendering. Decrease business development illustrations The Cost reduction and coins for Business concept 3d rendering
Free with trial The Cost reduction and coins for Business concept 3d rendering. Decrease business development illustrations The Cost reduction and coins for Business concept 3d rendering
Free with trial Set line Search engine, Laptop with browser window, Financial growth decrease and Browser shield icon. Vector. Decrease business development vectors Set line Search engine, Laptop with browser window, Financial growth decrease and Browser shield icon. Vector
Free with trial Business Analytics And Data Visualization Line Icon Set. Financial Growth, Market Trends, And Performance Analysis Outline Symbol Collection. Editable Stroke. Isolated Vector Illustration. Decrease business development vectors Business Analytics And Data Visualization Line Icon Set. Financial Growth, Market Trends, And Performance Analysis
Free with trial Colorful 3D bar graph illustrating contrasting trends: growth and decline. Symbolizes business fluctuations, market volatility, economic change, opposing forces, and progress. Ideal for promoting your services or creating eye-catching visuals. Open area for featuring your products, copy space, banner, advertisement. . Generative AI. Decrease business development illustrations Rising and Falling Bar Graph Colorful 3D bar graph illustrating contrasting trends growth and decline Symbolizes business. Colorful 3D bar graph illustrating contrasting trends: growth and decline. Symbolizes business fluctuations, market volatility, economic change, opposing forces, and progress. Ideal for promoting your services or creating eye-catching visuals. Open area for featuring your products, copy space, banner, advertisement. . Generative AI
Free with trial Visualizing cost reduction strategies in business, a hand places an arrow indicating decreasing costs on a graph, highlighting financial management and efficiency. 200 chars. Decrease business development illustrations Reduce costs strategy business finance management budget planning investment savings efficiency 100 chars. visualizing cost reduction strategies in business, a hand places an arrow indicating decreasing costs on a graph, highlighting financial management and efficiency. 200 chars
Free with trial Set Online shopping on screen Financial growth decrease Search engine Create account Mobile phone and Cloud technology data transfer icon. Vector. Decrease business development vectors Set Online shopping on screen, Financial growth decrease, Search engine, Create account, Mobile phone, and Cloud. Set Online shopping on screen Financial growth decrease Search engine Create account Mobile phone and Cloud technology data transfer icon. Vector.
Free with trial Red arrow pointing downward on colorful vertical bars. Business financial crisis chart with decreasing trend line. Economic data visualization. Decrease business development illustrations Red arrow pointing downward on colorful vertical bars. Business financial crisis chart with decreasing trend line
Free with trial Set line Browser window, Online shopping on screen, Financial growth decrease, with shield, setting and icon. Vector. Decrease business development vectors Set line Browser window, Online shopping on screen, Financial growth decrease, with shield, setting and icon. Vector
Free with trial Set Data analysis Financial growth and decrease on seamless pattern. Vector. Decrease business development vectors Set Data analysis, Financial growth and decrease on seamless pattern. Vector
Free with trial Wooden cubes display eco-friendly business concept. Green plant sprouts from one cube. Factory symbol on. Cube shows words green industry. Image suggests sustainable manufacturing. Decrease business development illustrations Wooden cubes display eco-friendly business concept. Green plant sprouts from one cube. Factory symbol on. Cube shows words green
Free with trial Person holds tablet showing globe with growth charts. Digital eco friendly tech, sustainable development concept. Global investment strategy for businesses corporations. Person planning eco. Decrease business development illustrations Person holds tablet showing globe with growth charts. Digital eco friendly tech, sustainable development concept. Global
Free with trial Set Magnifying glass with check mark Browser window files Financial growth decrease SEO optimization Search engine and Secure your site HTTPS SSL icon. Vector. Decrease business development illustrations Set Magnifying glass with check mark, Browser window, files, Financial growth decrease, SEO optimization, Search engine. Set Magnifying glass with check mark Browser window files Financial growth decrease SEO optimization Search engine and Secure your site HTTPS SSL icon. Vector.
Free with trial Collage collection of business people coworking networking launch project hold arrow down isolated on painted background. Decrease business development illustrations Collage collection of business people coworking networking launch project hold arrow down isolated on painted background
Free with trial A financial report with bar graph and line chart is a visual tool for business data analysis, offering insights for presentation, review, and strategic decision-making. Decrease business development vectors Vector art of financial report with bar graph and line chart, showing business data and analysis for presentation and review. A financial report with bar graph and line chart is a visual tool for business data analysis, offering insights for presentation, review, and strategic decision-making
Free with trial Person interacts with digital globe displaying eco data. Person examines sustainable development strategy on tablet. Financial reports charts overlay globe. Data analysis for eco. Decrease business development illustrations Person interacts with digital globe displaying eco data. Person examines sustainable development strategy on tablet. Financial
Free with trial Two entrepreneurs created a business strategy to reduce project operational costs using laptops. Cost Reduction concept. trend modern vector flat illustration. Decrease business development vectors Two entrepreneurs created a business strategy to reduce project operational costs using laptops. Cost Reduction concept.
Free with trial 3D Illustration Business Graph Chart Growth Success Analysis Finance Investment Strategy Data Market Stock Economy Trading Financial Progress Report. Decrease business development illustrations 3D Illustration Business Graph Chart Growth Success Analysis Finance Investment Strategy Data Market Stock Economy Trading
Free with trial CO2 reducing icon on green leaf with water droplet. Decrease carbon footprint limit global warming from climate change Bio Circular Green Economy concept. Saving environment from CO2. Decrease business development illustrations CO2 reducing icon on green leaf with water droplet. Decrease carbon footprint limit global warming from climate change, Bio. CO2 reducing icon on green leaf with water droplet. Decrease carbon footprint limit global warming from climate change Bio Circular Green Economy concept. Saving environment from CO2.
Free with trial A person in a suit presents a bar chart indicating quality increase and cost decrease, illuminated by golden light. Decrease business development illustrations Person in Suit Presenting Bar Chart with Quality Up and Cost Down, Illuminated by Golden Light Modern technology business. A person in a suit presents a bar chart indicating quality increase and cost decrease, illuminated by golden light
Free with trial Businesspeople handshake of commitment to reduce carbon to net zero by 2050 and sustainable development and business based on renewable energy. Decrease business development illustrations Businesspeople handshake of commitment to reduce carbon to net zero by 2050. AI Generated. Businesspeople handshake of commitment to reduce carbon to net zero by 2050 and sustainable development and business based on renewable energy.
Free with trial Closeup view of a pen resting on graph, suggesting data analysis or business planning ,Generative AI. Decrease business development illustrations Detailed view of a pen placed on graph, depicting financial analysis, business planning, and data interpretation for strategic. Closeup view of a pen resting on graph, suggesting data analysis or business planning ,Generative AI
Free with trial Person viewing digital globe on tablet eco-friendly investment strategy data. Sustainable development information displayed on digital screen. Green plants eco-conscious workplace. Decrease business development illustrations Person viewing digital globe on tablet eco-friendly investment strategy data. Sustainable development information displayed on
Free with trial Illustration shows concept of neural network with path to optimal solution. Orange lines connect blue nodes like tech business strategy, management, planning, solution finding risk management. Decrease business development illustrations Illustration shows concept of neural network with path to optimal solution. Orange lines connect blue nodes like tech business
Free with trial Sustainable CO2 reduction, emission strategies, green business transition. created ai. Decrease business development illustrations Environmental Stewardship Aiming for CO2 Emission Reduction Strategies: Eco-Conscious Business Tactics Demonstrating Green. Sustainable CO2 reduction, emission strategies, green business transition. created ai
Free with trial Wooden cube model shows factory, with green font. Eco-friendly industry concept. Sustainable business strategy. Renewable energy focus. Future tech for environment. Cube display. Decrease business development illustrations Wooden cube model shows factory with green font. Eco-friendly industry concept. Sustainable business strategy. Renewable energy. Wooden cube model shows factory, with green font. Eco-friendly industry concept. Sustainable business strategy. Renewable energy focus. Future tech for environment. Cube display.
Free with trial Business strategy with digital tech tools. Hands working on tablet analyzing data, graphs for cost management. Planning effective project management data analysis. Improving business. Decrease business development illustrations Business strategy with digital tech tools. Hands working on tablet analyzing data, graphs for cost management. Planning effective
Free with trial Business industry is increasingly adopting sustainable practices to reduce carbon emissions and preserve the ecology of the Earth, emphasizing the importance of eco-friendly energy solutions. Decrease business development illustrations Business industry is increasingly adopting sustainable practices to reduce carbon emissions and preserve the ecology of the Earth
Free with trial Set Pie chart infographic, Financial growth decrease, Data analysis and Search data on seamless pattern. Vector. Decrease business development illustrations Set Pie chart infographic, Financial growth decrease, Data analysis and Search data on seamless pattern. Vector
Free with trial Set Binary code, Pie chart infographic, Data analysis and Financial growth decrease icon. Vector. Decrease business development vectors Set Binary code, Pie chart infographic, Data analysis and Financial growth decrease icon. Vector
Free with trial Global financial investment, Financial data Information for Trading and business investment, Stock market with candlestick on background. Business stock market visualization? Pie chart and graphs? Growth graph business inves background. Generative AI. Decrease business development illustrations Business graph of income growth, timeline, arrows indicate the direction of the graph. Global financial investment, Financial data Information for Trading and business investment, Stock market with candlestick on background. Business stock market visualization ? Pie chart and graphs ? Growth graph business inves background. Generative AI
Free with trial 2026. Decrease chart. Red color. 3d illustration. Decrease business development illustrations 2026. Decrease chart. Red color. 3d illustration
Free with trial A minimalist black and white icon representing documents with an upward and downward arrow. This graphic symbolizes concepts like report generation, data analysis, growth, decline, upload, download, information flow, and business metrics. It's ideal for presentations, websites, and applications related to finance, business, technology, and data management. Decrease business development vectors Document Growth and Data Flow Icon. A minimalist black and white icon representing documents with an upward and downward arrow. This graphic symbolizes concepts like report generation, data analysis, growth, decline, upload, download, information flow, and business metrics. It's ideal for presentations, websites, and applications related to finance, business, technology, and data management.
Free with trial A clean, minimalist icon representing an analytics graph. It features a series of vertical bars of varying heights, symbolizing data or trends. A line graph with circular data points connects the tops of some of the bars, illustrating growth, progress, or fluctuations over time. This graphic is ideal for representing business intelligence, financial data, research, or any concept related to data analysis and performance. Decrease business development vectors Analytics Graph Icon with Data Points. A clean, minimalist icon representing an analytics graph. It features a series of vertical bars of varying heights, symbolizing data or trends. A line graph with circular data points connects the tops of some of the bars, illustrating growth, progress, or fluctuations over time. This graphic is ideal for representing business intelligence, financial data, research, or any concept related to data analysis and performance.
Free with trial Black silhouette arrows illustrate financial growth and decline against a white background, perfect for business concepts. Flat design graphic. Decrease business development vectors Multiple upward and downward trend arrows. Black silhouette arrows illustrate financial growth and decline against a white background, perfect for business concepts. Flat design graphic