Free with trial A line graph depicting a downward trend, symbolizing a decline in performance, sales, or economic activity, often used in business and financial contexts. Decrease business development vectors Vector art of a line graph showing a downward trend, , indicating a decline in performance, sales, or economic activity in a. A line graph depicting a downward trend, symbolizing a decline in performance, sales, or economic activity, often used in business and financial contexts
Free with trial Risky choice of strategy or development path, leadership in prevention unforeseen circumstances, mentoring to solve complex situations, loss of funds in high-risk investments, man warns of risk. Decrease business development vectors Man warns of risk
Free with trial Oil industry crisis. Oil field on red. Oil pump next to the down arrow. Falling energy prices. Decrease in oil production levels. Decrease business development illustrations Oil industry crisis. Oil field on red. Oil pump next to the down arrow. Falling energy prices. Decrease in oil production levels
Free with trial Gray bar chart with red line graph and downward arrow, illustrating decline, decrease, loss, and negative trend. Decrease business development vectors Bar chart with downward red arrow, symbolizing decline. Gray bar chart with red line graph and downward arrow, illustrating decline, decrease, loss, and negative trend
Free with trial A collection of nine flat vector icons for data visualization including bar graphs, line charts, pie charts, and performance meters isolated on a white background. Decrease business development vectors Simple black data analysis and business chart icon set. A collection of nine flat vector icons for data visualization including bar graphs, line charts, pie charts, and performance meters isolated on a white background
Free with trial Laptop displaying a bar chart indicating growth and analysis ,Generative ai. Decrease business development illustrations Laptop with bar chart, visualizing growth, analysis, and business trends. Laptop displaying a bar chart indicating growth and analysis ,Generative ai
Free with trial A minimalist black and white icon representing a bar graph. The graph features several vertical bars of varying heights, arranged in a sequence that initially ascends to a peak and then descends. This versatile graphic symbolizes data, statistics, growth, decline, trends, and analysis. Its clean design makes it suitable for presentations, reports, websites, and applications related to finance, business, technology, and research. Decrease business development vectors Black Bar Graph Icon with Ascending and Descending Bars. A minimalist black and white icon representing a bar graph. The graph features several vertical bars of varying heights, arranged in a sequence that initially ascends to a peak and then descends. This versatile graphic symbolizes data, statistics, growth, decline, trends, and analysis. Its clean design makes it suitable for presentations, reports, websites, and applications related to finance, business, technology, and research.
Free with trial A dynamic 3D visualization of financial data, featuring an upward trending blue arrow graph, a series of white and blue bar graphs, and two pie charts. The composition is set against a dark blue, grid-like background, symbolizing data analysis, business growth, and financial success. This image is ideal for presentations, reports, and websites related to finance, economics, and market trends. Decrease business development illustrations 3D Financial Growth Chart with Pie Charts and Bar Graph. A dynamic 3D visualization of financial data, featuring an upward trending blue arrow graph, a series of white and blue bar graphs, and two pie charts. The composition is set against a dark blue, grid-like background, symbolizing data analysis, business growth, and financial success. This image is ideal for presentations, reports, and websites related to finance, economics, and market trends.
Free with trial This is an isometric 3D illustration depicting a dynamic data visualization. It features a combination of bar charts and a line graph, showcasing rising trends and fluctuating data points. The color palette includes shades of blue, teal, and coral, creating a modern and professional aesthetic. This graphic is ideal for representing financial reports, business analytics, market trends, growth, and performance metrics in a visually engaging and easy-to-understand format. Decrease business development illustrations Isometric 3D Bar and Line Graph with Data Visualization. This is an isometric 3D illustration depicting a dynamic data visualization. It features a combination of bar charts and a line graph, showcasing rising trends and fluctuating data points. The color palette includes shades of blue, teal, and coral, creating a modern and professional aesthetic. This graphic is ideal for representing financial reports, business analytics, market trends, growth, and performance metrics in a visually engaging and easy-to-understand format.
Free with trial This 3D rendering illustrates the dynamic journey of financial markets. It depicts a series of bar graphs on a dark, reflective surface, showcasing different stages of economic activity. From steady growth and fluctuating upward trends, the visualization culminates in a dramatic market collapse, where a tall bar graph shatters into pieces. This powerful image represents concepts of business success, market volatility, economic downturns, and financial crises, making it ideal for reports, presentations, and articles on investment risks and market analysis. Decrease business development illustrations Financial Market Dynamics: Growth, Volatility, and Collapse. This 3D rendering illustrates the dynamic journey of financial markets. It depicts a series of bar graphs on a dark, reflective surface, showcasing different stages of economic activity. From steady growth and fluctuating upward trends, the visualization culminates in a dramatic market collapse, where a tall bar graph shatters into pieces. This powerful image represents concepts of business success, market volatility, economic downturns, and financial crises, making it ideal for reports, presentations, and articles on investment risks and market analysis.
Free with trial A minimalist black bar chart icon isolated on a clean white background. This simple graphic features three vertical bars of different heights resting on a horizontal axis, visually representing data, statistics, and comparative information. Ideal for illustrating business performance, financial reports, market trends, analytics, or any concept related to growth, decline, and quantitative analysis in presentations, websites, applications, and infographics. Its clean, flat design makes it versatile for various digital and print media. Decrease business development vectors Minimalist Bar Chart Icon for Data Analysis and Statistics. A minimalist black bar chart icon isolated on a clean white background. This simple graphic features. A minimalist black bar chart icon isolated on a clean white background. This simple graphic features three vertical bars of different heights resting on a horizontal axis, visually representing data, statistics, and comparative information. Ideal for illustrating business performance, financial reports, market trends, analytics, or any concept related to growth, decline, and quantitative analysis in presentations, websites, applications, and infographics. Its clean, flat design makes it versatile for various digital and print media.
Free with trial Business ranking up or down, entrepreneur grasping balloon that ascends, in contrast to others descending with an anchor. Decrease business development vectors Business ranking up or down, entrepreneur grasping balloon that ascends, in contrast to others descending with an anchor
Free with trial A businessman is shown from a high angle, typing on a silver laptop. The screen displays a green downward-pointing arrow above the word COST, symbolizing cost reduction or decrease. The setting appears to be a professional office environment. Decrease business development illustrations Businessman using laptop with cost reduction arrow on screen. A businessman is shown from a high angle, typing on a silver laptop. The screen displays a green downward-pointing arrow above the word COST, symbolizing cost reduction or decrease. The setting appears to be a professional office environment
Free with trial This image shows a hand interacting with a glowing cloud symbol containing the CO2 chemical formula and the years 2026 and 2050 This highlights the goal of achieving carbon neutrality by 2050 with a reduction target set for 2026 to decrease CO2 emissions for sustainable development and a healthier planet It represents the commitment to environmental responsibility and innovation. Decrease business development illustrations Reaching carbon neutrality by 2050 and lower CO2 emissions by 2026 for a sustainable future. This image shows a hand interacting with a glowing cloud symbol containing the CO2 chemical formula and the years 2026 and 2050 This highlights the goal of achieving carbon neutrality by 2050 with a reduction target set for 2026 to decrease CO2 emissions for sustainable development and a healthier planet It represents the commitment to environmental responsibility and innovation
Free with trial Colorful 3D pie chart render with segments in green, orange, yellow against soft green background. Minimalist design highlights data visualization concept. Useful for business reports. Decrease business development illustrations Colorful 3D pie chart render with segments in green, orange, yellow against soft green background. Minimalist design highlights
Free with trial Detailed illustration featuring a variety of hand drawn style financial charts and data analysis line icons including growth curves and market trends. Decrease business development vectors Collection of business data and financial analytics line icons. detailed illustration featuring a variety of hand drawn style financial charts and data analysis line icons including growth curves and market trends
Free with trial A line graph illustrating a decrease in energy consumption over time, transitioning from lightning bolt icons to leaf icons, symbolizing a shift towards sustainable and eco-friendly practices. Decrease business development illustrations Energy Consumption Reduction Graph with Lightning Bolts and Leaves. A line graph illustrating a decrease in energy consumption over time, transitioning from lightning bolt icons to leaf icons, symbolizing a shift towards sustainable and eco-friendly practices
Free with trial Colorful bar chart visualizing business data, financial growth, and market analysis with a retro aesthetic. Decrease business development illustrations Colorful geometric bar chart displaying data visualization progress. Colorful bar chart visualizing business data, financial growth, and market analysis with a retro aesthetic
Free with trial A man in a suit presents a digital interface showing a cost reduction chart with a downward arrow, illustrating financial decline and business challenges. Decrease business development illustrations Man presenting cost reduction chart with downward arrow and percentage sign in a digital interface. a man in a suit presents a digital interface showing a cost reduction chart with a downward arrow, illustrating financial decline and business challenges.
Free with trial A cheerful 3D-rendered cartoon businessman sits confidently beside a rising bar graph, holding a pie chart, symbolizing successful business growth and financial planning. He appears relaxed and optimistic, suggesting achievement and future prosperity. Decrease business development illustrations Smiling 3D Cartoon Businessman Analyzing Financial Growth Charts. A cheerful 3D-rendered cartoon businessman sits confidently beside a rising bar graph, holding a pie chart, symbolizing successful business growth and financial planning. He appears relaxed and optimistic, suggesting achievement and future prosperity.
Free with trial Minimalist vector icons illustrating financial growth, savings, ice cream treat, and energy efficiency. Ideal for business presentations, infographics, and educational materials on economics or sustainability. Decrease business development vectors Flat design icons for financial trends and energy consumption concepts. Minimalist vector icons illustrating financial growth, savings, ice cream treat, and energy efficiency. Ideal for business presentations, infographics, and educational materials on economics or sustainability
Free with trial Glossy polished 3D red segmented downward arrow, ideal for illustrating market decline, economic downturn, financial loss, stock market crashes, business recession, and corporate financial downturn concepts for financial reports, marketing assets and business content , stunning visual effect. Decrease business development vectors Red Arrow Shows Decline with Statistics Concept and Economic Downturn. Glossy polished 3D red segmented downward arrow, ideal for illustrating market decline, economic downturn, financial loss, stock market crashes, business recession, and corporate financial downturn concepts for financial reports, marketing assets and business content , stunning visual effect
Free with trial An overhead shot captures hands engaged in meticulous financial planning on a rustic wooden desk. Stacks of US quarters, a calculator, and a notebook filled with handwritten charts and graphs illustrate concepts of budgeting, savings, and investment. The scene suggests careful analysis of financial data, strategizing for future growth, or managing personal and business finances. Eyeglasses, a pen, and a coffee cup complete this focused work environment, ideal for themes of economy, wealth management, and financial success. Decrease business development illustrations Financial Planning and Savings: Hands Analyzing Data with Coins and Calculator. An overhead shot captures hands engaged in meticulous financial planning on a rustic wooden desk. Stacks of US quarters, a calculator, and a notebook filled with handwritten charts and graphs illustrate concepts of budgeting, savings, and investment. The scene suggests careful analysis of financial data, strategizing for future growth, or managing personal and business finances. Eyeglasses, a pen, and a coffee cup complete this focused work environment, ideal for themes of economy, wealth management, and financial success.
Free with trial This abstract digital artwork features a blue and gray bar graph with data points highlighting growth trends on a dark background, ideal for business and analytics themes Generative AI. Decrease business development illustrations Blue and Gray Bar Graph with Data Points Representing Growth Trends and Statistical Analysis in Digital Format on Dark Background. This abstract digital artwork features a blue and gray bar graph with data points highlighting growth trends on a dark background, ideal for business and analytics themes Generative AI
Free with trial Slide switch with TSA, tax sheltered annuary text. Financial, Management, Economic. close up of slide switch,Business Concept. 3D rendering on green background. Decrease business development illustrations Slide switch with TSA, tax sheltered annuary text. Financial, Management, Economic.close up of slide switch
Free with trial Slide switch with TSA, tax sheltered annuary text. Financial, Management, Economic. close up of slide switch,Business Concept. 3D rendering on blue background. Decrease business development illustrations Slide switch with TSA, tax sheltered annuary text. Financial, Management, Economic.close up of slide switch. slide switch with TSA, tax sheltered annuary text. Financial, Management, Economic.close up of slide switch,Business Concept.3D rendering on blue background.
Free with trial Wooden cubes with TSA, tax sheltered annuary text. Financial, Management, Economic. close up of wooden cubes,Business Concept. Supports PNG files with transparent backgrounds. Decrease business development vectors Wooden cubes with TSA, tax sheltered annuary text. Financial, Management, Economic.close up of wooden cubes
Free with trial This abstract 3D composition features purple graphs symbolizing growth and decline, set against a soft purple backdrop, ideal for business concepts. Decrease business development illustrations Abstract 3D Purple Graphs Representing Growth and Decline on a Soft Purple Background. This abstract 3D composition features purple graphs symbolizing growth and decline, set against a soft purple backdrop, ideal for business concepts
Free with trial Pink bar chart report on wooden table displaying progress data analysis ,Generative ai. Decrease business development illustrations Pink bar chart report displaying progress data analysis on wooden table for business insights. Pink bar chart report on wooden table displaying progress data analysis ,Generative ai
Free with trial The image depicts a gray ladder with black text on each rung, leaning against a blue background with a subtle white graph. Green and red arrows of varying sizes point up and down, indicating change. The ladder's rungs are labeled with 'position' numbers, and a magnifying glass rests on it. The scene symbolizes growth, progress, and examination in a professional or business context, with the arrows. This image was generated using artificial intelligence. Decrease business development illustrations A gray ladder with black text leans on a blue background with green and red arrows pointing up and down showing change in position. The image depicts a gray ladder with black text on each rung, leaning against a blue background with a subtle white graph. Green and red arrows of varying sizes point up and down, indicating change. The ladder's rungs are labeled with 'position' numbers, and a magnifying glass rests on it. The scene symbolizes growth, progress, and examination in a professional or business context, with the arrows. This image was generated using artificial intelligence.
Free with trial Yellow button with TSA, tax sheltered annuary text. Financial, Management, Economic. close up button of keyboard,Business Concept. 3D rendering on blue background. Decrease business development illustrations Yellow button with TSA, tax sheltered annuary text. Financial, Management, Economic.
Free with trial Wooden cubes with TSA, tax sheltered annuary text. Financial, Management, Economic. close up of wooden cubes,Business Concept. 3D rendering on yellow background. Decrease business development illustrations Wooden cubes with TSA, tax sheltered annuary text. Financial, Management, Economic.close up of wooden cubes
Free with trial The concept of a decrease or increase in the bitcoin price after halving. Decrease business development vectors Bitcoin price after Halving event. Vector illustration. The concept of a decrease or increase in the bitcoin price after halving.
Free with trial Green arrows pointing up and down. Illustrative design shows direction choice. Concept for website user interface button, or for business graphic. Decrease business development illustrations Green arrows pointing up and down. Illustrative design shows direction choice. Concept for website user interface button or for
Free with trial Blue stacked arrows illustrate financial growth, market trends. Graphic displays upward, downward movement, signifying progress, decline in business economy. Represents strategy,. Decrease business development illustrations Blue stacked arrows illustrate financial growth, market trends. Graphic displays upward, downward movement, signifying progress
Free with trial A colorful bar chart overlays blueprint showcasing data visualization for business analysis colorful on top of blueprinted paper ,Generative ai. Decrease business development illustrations A vibrant and informative colorful bar chart displayed on top of detailed blueprinted paper for comprehensive data analysis. A colorful bar chart overlays blueprint showcasing data visualization for business analysis colorful on top of blueprinted paper ,Generative ai
Free with trial This vibrant line chart illustrates growth and decline trends with colored circles, making it suitable for business presentations, reports, and educational material. Decrease business development illustrations Colorful Line Chart Showing Growth and Decline Trends with Green, Yellow, and Red Circles Representing Data Points over Time. This vibrant line chart illustrates growth and decline trends with colored circles, making it suitable for business presentations, reports, and educational material
Free with trial Failed startup launch icon outline vector. Falling rocket. Business project crisis. Decrease business development illustrations Failed startup launch icon outline vector. Falling rocket
Free with trial Metallic financial fluctuation concept with dollar symbol, green arrow pointing up indicating growth, and red arrow pointing down for decrease. Market trends and investment. Economy changes. Decrease business development illustrations Metallic Dollar Sign With Green Up Arrow And Red Down Arrow Representing Financial Fluctuation. Metallic financial fluctuation concept with dollar symbol, green arrow pointing up indicating growth, and red arrow pointing down for decrease. Market trends and investment. Economy changes
Free with trial Crashed startup rocket icon outline vector. Project failure. New business crisis. Decrease business development vectors Crashed startup rocket icon outline vector. Project failure
Free with trial A vibrant 3D bar graph illustration shows financial growth trends with colorful bars. Perfect for business presentations, analytics, and creative projects. Decrease business development illustrations Colorful 3D bar graph illustration depicting financial growth and performance trends with vibrant hues and clean modern design for. A vibrant 3D bar graph illustration shows financial growth trends with colorful bars. Perfect for business presentations, analytics, and creative projects
Free with trial Wood cube block with TSA, tax sheltered annuary text. Financial, Management, Economic. close up of wooden elements,Business Concept. 3D rendering on blue background. Decrease business development illustrations Wood cube block with TSA, tax sheltered annuary text. Financial, Management, Economic.
Free with trial Wood cube block with TSA, tax sheltered annuary text. Financial, Management, Economic. close up of wooden elements,Business Concept. 3D rendering on red background. Decrease business development illustrations Wood cube block with TSA, tax sheltered annuary text. Financial, Management, Economic.
Free with trial Wood cube block with TSA, tax sheltered annuary text. Financial, Management, Economic. close up of wooden elements,Business Concept. 3D rendering on black background. Decrease business development illustrations Wood cube block with TSA, tax sheltered annuary text. Financial, Management, Economic.
Free with trial CO2 reducing icon on green leaf with water droplet for decrease CO2 , carbon footprint and carbon credit to limit global warming from climate change, Bio Circular Green Economy concept. Decrease business development illustrations CO2 reducing icon on green leaf with water droplet for decrease CO2
Free with trial CO2 reducing icon on green leaf with water droplet for decrease CO2 , carbon footprint and carbon credit to limit global warming from climate change, Bio Circular Green Economy concept. Decrease business development illustrations CO2 reducing icon on green leaf with water droplet for decrease CO2
Free with trial Male and female characters beside a financial downfall chart, vector illustration on a blue background, concept of business success. Flat cartoon vector illustration. Decrease business development vectors Male and female characters beside a financial downfall chart, vector illustration
Free with trial This graphic illustrates stable bank withdrawals alongside a rising financial trend with coins and bars, Bank withdrawals are currently stable and not showing any significant increase or decrease. Decrease business development vectors This graphic illustrates stable bank withdrawals alongside a rising financial trend with coins and bars, Bank withdrawals are
Free with trial Analysis of website traffic using magnifying glass on laptop. Detailed data, graphs reviewed for blog ranking. Online marketing, business performance monitoring key. Research. Decrease business development illustrations Analysis of website traffic using magnifying glass on laptop. Detailed data, graphs reviewed for blog ranking. Online marketing
Free with trial A wooden arrow pointing down is on top of a stack of wooden blocks. The arrow represents a downward trend or a decrease in something generated by AI. Decrease business development vectors A wooden arrow pointing down is on top of a stack of wooden blocks generated by AI. A wooden arrow pointing down is on top of a stack of wooden blocks. The arrow represents a downward trend or a decrease in something generated by AI
Free with trial Composite trend artwork sketch photo collage of monochrome young woman walk step huge analyzing arrow go down direction crisis decrease. Decrease business development illustrations Composite trend artwork sketch photo collage of monochrome young woman walk step huge analyzing arrow go down direction
Free with trial Set Browser window Cloud technology data transfer Laptop with browser setting Search engine Photo retouching Financial growth decrease and icon. Vector. Decrease business development vectors Set Browser window, Cloud technology data transfer, Laptop with browser, setting, Search engine, Photo retouching. Set Browser window Cloud technology data transfer Laptop with browser setting Search engine Photo retouching Financial growth decrease and icon. Vector.
Free with trial CO2 reducing icon with circular for decrease CO2 , carbon footprint and carbon credit to limit global warming from climate change, Bio Circular Green Economy concept. Decrease business development illustrations Letter O Nature and Environmental Conservation. CO2 reducing icon with circular for decrease CO2 , carbon footprint and carbon credit to limit global warming from climate change, Bio Circular Green Economy concept.
Free with trial Graph chart infographic report set with statistic arrow data elements for financial market analysis and planning in business performance research for your illustration. Decrease business development vectors Graph chart infographic report set
Free with trial Graph chart infographic report set with statistic arrow data elements for financial market analysis and planning in business performance research for your illustration. Decrease business development vectors Graph chart infographic report set
Free with trial Graph chart infographic report set with statistic arrow data elements for financial market analysis and planning in business performance research for your illustration. Decrease business development vectors Graph chart infographic report set
Free with trial Oil industry crisis. Oil field on red. Oil pump next to the down arrow. Falling energy prices. Decrease in oil production levels. Decrease business development illustrations Oil industry crisis. Oil field on red. Oil pump next to the down arrow. Falling energy prices. Decrease in oil production levels
Free with trial Oil industry crisis. Oil field on red. Oil pump next to the down arrow. Falling energy prices. Decrease in oil production levels. Decrease business development illustrations Oil industry crisis. Oil field on red. Oil pump next to the down arrow. Falling energy prices. Decrease in oil production levels
Free with trial Oil industry crisis. Oil field on red. Oil pump next to the down arrow. Falling energy prices. Decrease in oil production levels. Decrease business development illustrations Oil industry crisis. Oil field on red. Oil pump next to the down arrow. Falling energy prices. Decrease in oil production levels
Free with trial Oil industry crisis. Oil field on red. Oil pump next to the down arrow. Falling energy prices. Decrease in oil production levels. Decrease business development illustrations Oil industry crisis. Oil field on red. Oil pump next to the down arrow. Falling energy prices. Decrease in oil production levels
Free with trial Oil industry crisis. Oil field on red. Oil pump next to the down arrow. Falling energy prices. Decrease in oil production levels. Decrease business development illustrations Oil industry crisis. Oil field on red. Oil pump next to the down arrow. Falling energy prices. Decrease in oil production levels
Free with trial Oil industry crisis. Oil field on red. Oil pump next to the down arrow. Falling energy prices. Decrease in oil production levels. Decrease business development illustrations Oil industry crisis. Oil field on red. Oil pump next to the down arrow. Falling energy prices. Decrease in oil production levels
Free with trial A 3D rendered illustration depicting business growth. The image showcases two upward-trending arrow charts, one in gold and the other in blue, representing positive trends, progress, and success. The charts are set against a clean, light background, emphasizing the upward movement and potential for financial gain. Suitable for illustrating economic growth, investment strategies, and business performance. Decrease business development illustrations Growth Chart with Arrows. A 3D rendered illustration depicting business growth. The image showcases two upward-trending arrow charts, one in gold and the other in blue, representing positive trends, progress, and success. The charts are set against a clean, light background, emphasizing the upward movement and potential for financial gain. Suitable for illustrating economic growth, investment strategies, and business performance.
Free with trial A minimalist black and white icon representing a financial growth chart. It features a series of vertical bars of varying heights, symbolizing data points or periods, overlaid with a line graph connecting circular nodes. This graphic effectively conveys concepts of financial analysis, business growth, performance tracking, and data visualization. Ideal for presentations, reports, websites, and applications related to finance, economics, and business intelligence. Decrease business development vectors Growth Analysis Finance Chart Icon. A minimalist black and white icon representing a financial growth chart. It features a series of vertical bars of varying heights, symbolizing data points or periods, overlaid with a line graph connecting circular nodes. This graphic effectively conveys concepts of financial analysis, business growth, performance tracking, and data visualization. Ideal for presentations, reports, websites, and applications related to finance, economics, and business intelligence.
Free with trial A vibrant green upward trending arrow signifies growth, progress, and positive development. The arrow's design is visually appealing and represents a successful trajectory. The dark background emphasizes the upward movement. Decrease business development illustrations Green Arrow Growth Chart. A vibrant green upward trending arrow signifies growth, progress, and positive development. The arrow's design is visually appealing and represents a successful trajectory. The dark background emphasizes the upward movement.
Free with trial A hand holds a piece of paper with a hand-drawn graph showing a sharp decline. The downward trend is clearly visible, indicating a negative development. This image was generated by AI and is ideal for illustrating concepts like economic downturn, market crash, or business failure. Decrease business development illustrations Hand Holding Declining Graph. A hand holds a piece of paper with a hand-drawn graph showing a sharp decline. The downward trend is clearly visible, indicating a negative development. This image was generated by AI and is ideal for illustrating concepts like economic downturn, market crash, or business failure.
Free with trial A graph with a red line and a green line. This could represent a decrease in one variable and an increase in another. Decrease business development illustrations A graph with a red line and a green line
Free with trial A minimalist, flat design illustration of a bar chart featuring three vertical bars of varying heights. The bars are colored in orange, teal, and a lighter orange, set against a clean white background. This graphic represents data visualization, trends, and comparisons, suitable for business reports, educational materials, or web design elements. Decrease business development illustrations Simple Bar Chart with Three Bars. A minimalist, flat design illustration of a bar chart featuring three vertical bars of varying heights. The bars are colored in orange, teal, and a lighter orange, set against a clean white background. This graphic represents data visualization, trends, and comparisons, suitable for business reports, educational materials, or web design elements.
Free with trial A clean, minimalist 3D render of a blue bar chart with a blue trend line connecting circular data points. The bars vary in height, illustrating growth and fluctuations. The background is a bright, clean white, emphasizing the chart's elements. This graphic is ideal for representing financial data, business growth, market trends, statistics, and performance analysis in a modern and professional style. Decrease business development illustrations 3D Blue Bar Chart with Trend Line. A clean, minimalist 3D render of a blue bar chart with a blue trend line connecting circular data points. The bars vary in height, illustrating growth and fluctuations. The background is a bright, clean white, emphasizing the chart's elements. This graphic is ideal for representing financial data, business growth, market trends, statistics, and performance analysis in a modern and professional style.
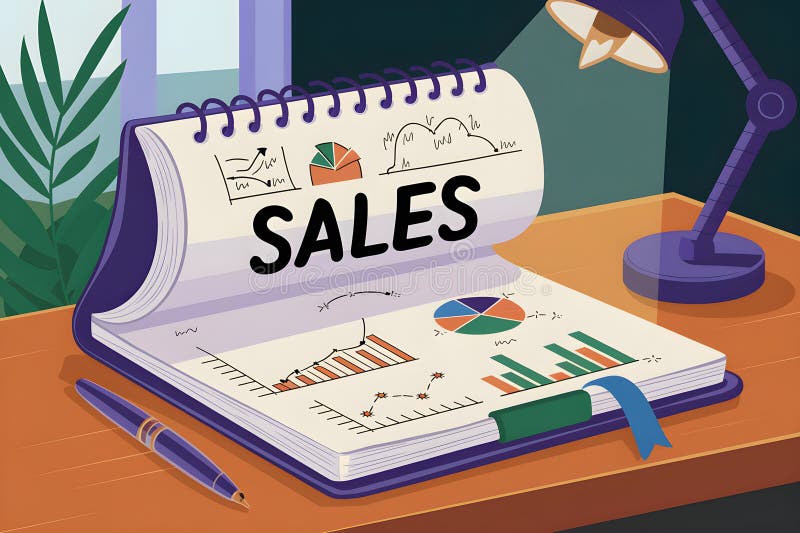
Free with trial Open notebook displaying sales data with charts, graphs, and the word sales highlighted, illuminated by a desk lamp, symbolizing business analysis and strategy. Decrease business development illustrations Sales report with charts and graphs illuminated by desk lamp. Open notebook displaying sales data with charts, graphs, and the word sales highlighted, illuminated by a desk lamp, symbolizing business analysis and strategy
Free with trial Risky choice of strategy or development path,achieve high results through hard work despite obstacles,achieve your goals in a highly competitive environment,people add cubes with the letters risk. Decrease business development vectors People add cubes with the letters risk
Free with trial A black stock chart icon with upward and downward trends is displayed on a red background to represent business growth. Decrease business development illustrations Stock Chart Icon on Red Background. A black stock chart icon with upward and downward trends is displayed on a red background to represent business growth
Free with trial A 3D rendered, vibrant red arrow pointing downwards and to the right, isolated on a transparent background. The arrow has a modern, sleek design. It can be used to represent concepts like decrease, decline, direction, navigation, or a downward trend. The clean background makes it easy to integrate into various designs and projects. Decrease business development illustrations Red Arrow Pointing Down
Free with trial A minimalist 3D rendering showcases a bar chart with an upward arrow and a diverging arrow on a round platform, symbolizing business growth and decline and is suitable for presentations or website graphics. Decrease business development illustrations 3d Bar Chart with Arrow, Growth Concept. A minimalist 3D rendering showcases a bar chart with an upward arrow and a diverging arrow on a round platform, symbolizing business growth and decline and is suitable for presentations or website graphics
Free with trial A modern flat design icon representing financial data analysis and market trends. This vector illustration features a combination of a green bar chart and a dark grey line graph, showing fluctuations in performance. An upward arrow indicates initial growth, followed by a volatile trend line symbolizing concepts like market instability, economic changes, profit and loss, or business analytics. This versatile graphic is perfect for infographics, financial reports, presentations, websites, and applications related to business, finance, statistics, and economics. Isolated on a white background for easy use. Decrease business development vectors Financial Market Fluctuation Graph Icon. A modern flat design icon representing financial data analysis and market trends. This vector illustration features a combination of a green bar chart and a dark grey line graph, showing fluctuations in performance. An upward arrow indicates initial growth, followed by a volatile trend line symbolizing concepts like market instability, economic changes, profit and loss, or business analytics. This versatile graphic is perfect for infographics, financial reports, presentations, websites, and applications related to business, finance, statistics, and economics. Isolated on a white background for easy use.
Free with trial Decreasing bar graph isolated on white background. Investment statistics. Economic data. Financial report. Interest rate. Business concept. Top view. 3d render. Decrease business development illustrations Decreasing bar graph isolated on white background
Free with trial A vibrant 3D bar chart featuring multiple colorful columns, including red, blue, green, yellow, and purple, set against a clean white background. The bars vary in height, representing different data points or categories, and are displayed on a reflective surface, adding depth to the visualization. Grid lines provide a clear scale for interpretation. This modern graphic is ideal for illustrating statistics, business growth, financial performance, market analysis, and educational concepts in presentations, reports, and digital media. Decrease business development illustrations Colorful 3D Bar Chart on White Background. A vibrant 3D bar chart featuring multiple colorful columns, including red, blue, green, yellow, and purple, set against a clean white background. The bars vary in height, representing different data points or categories, and are displayed on a reflective surface, adding depth to the visualization. Grid lines provide a clear scale for interpretation. This modern graphic is ideal for illustrating statistics, business growth, financial performance, market analysis, and educational concepts in presentations, reports, and digital media.
Free with trial Red decreasing bar graph on light gray background. Investment statistics. Economic data. Financial report. Interest rate. Business concept. Top view. 3d render. Decrease business development illustrations Red decreasing bar graph on light gray background
Free with trial The concept of eternity, endless and unlimited, The circular economy icon on nature, circular for decrease CO2, carbon footprint and carbon credit to limit global warming from climate change. Decrease business development illustrations Eco friendly, circular economy, eco community, green factory and industry concept. The concept of eternity, endless and unlimited, The circular economy icon on nature, circular for decrease CO2, carbon footprint and carbon credit to limit global warming from climate change