Free with trial A man is presenting business data on a whiteboard, using a laptop. The chart shows growth and success. He is explaining the strategy and planning to his colleagues. Decrease business development illustrations Man presenting business data on a whiteboard isolated on white background. A man is presenting business data on a whiteboard, using a laptop. The chart shows growth and success. He is explaining the strategy and planning to his colleagues
Free with trial A simple, flat design graphic illustrating a downward trend in a graph. A stylized person with flames above their head is positioned below the declining line graph, symbolizing stress, loss, or a negative impact. Suitable for presentations, articles, or social media posts related to business performance, market analysis, personal development, or any situation involving a downward trend. The flat design makes it versatile and easily adaptable for various uses. Decrease business development vectors Declining Graph with Stressed Person. A simple, flat design graphic illustrating a downward trend in a graph. A stylized person with flames above their head is positioned below the declining line graph, symbolizing stress, loss, or a negative impact. Suitable for presentations, articles, or social media posts related to business performance, market analysis, personal development, or any situation involving a downward trend. The flat design makes it versatile and easily adaptable for various uses.
Free with trial A vibrant and modern illustration showcasing various data visualization elements. The image features a collection of charts, graphs, and diagrams, including line graphs, bar graphs, pie charts, and circular diagrams, all rendered in a colorful and abstract style. The design incorporates gradients and geometric shapes, suggesting growth, analysis, and business concepts. Ideal for presentations, reports, websites, and marketing materials related to finance, economics, and data analysis. Decrease business development illustrations Abstract Data Visualization and Business Charts. A vibrant and modern illustration showcasing various data visualization elements. The image features a collection of charts, graphs, and diagrams, including line graphs, bar graphs, pie charts, and circular diagrams, all rendered in a colorful and abstract style. The design incorporates gradients and geometric shapes, suggesting growth, analysis, and business concepts. Ideal for presentations, reports, websites, and marketing materials related to finance, economics, and data analysis.
Free with trial Green line graph on a pink background with a downward arrow. Business trend showing decline and fall. Financial analysis and performance concept. Decrease business development illustrations Green line graph on a pink background with a downward arrow. Business trend showing decline and fall
Free with trial A minimal Downward arrow symbolizing financial crises, negativ business success and strategic progress in a modern conceptual design. Decrease business development illustrations Downward growth and negativ financial concept with abstract arrow, business progress and strategy. A minimal Downward arrow symbolizing financial crises, negativ business success and strategic progress in a modern conceptual design
Free with trial The image depicts a bar graph with blue bars that increase in height initially, then gradually decrease, symbolizing growth followed by decline. An upward-pointing arrow overlays the graph, indicating an overall upward trend or potential future growth despite the current decline in the bars' heights. This visual is often used in business, finance, and analytics to illustrate performance trends. Decrease business development illustrations Growth trend represented by increasing and then decreasing blue bar graph with upward arrow. The image depicts a bar graph with blue bars that increase in height initially, then gradually decrease, symbolizing growth followed by decline. An upward-pointing arrow overlays the graph, indicating an overall upward trend or potential future growth despite the current decline in the bars' heights. This visual is often used in business, finance, and analytics to illustrate performance trends
Free with trial Set of icons featuring different types of charts and graphs used for data analysis and business growth isolated on transparent background. Decrease business development vectors Collection of various icons representing data analysis and business growth with charts and graphs. Set of icons featuring different types of charts and graphs used for data analysis and business growth isolated on transparent background
Free with trial Vibrant abstract visualization of a trendline against a gradient background, ideal for business reports, financial analysis, and creative projects. Decrease business development illustrations Abstract Data Visualization of a Trendline with Blue and Pink Background for Business Use. Vibrant abstract visualization of a trendline against a gradient background, ideal for business reports, financial analysis, and creative projects
Free with trial Colorful data charts, graphs, and infographics on white background, illustrating business analytics, breathtaking wallpaper background Generative AI. Decrease business development illustrations Colorful data charts, graphs, and infographics on white background, illustrating business analytics
Free with trial Crisis the wooden cube block word. World crisis business and financial concept. Decrease business development illustrations Crisis the wooden cube block word. World crisis business and financial concept
Free with trial A man is giving a business presentation, pointing to a graph on a whiteboard. He is using a laptop and explaining the data. The scene is set in an office. Decrease business development illustrations Business presentation with a man pointing to a graph isolated on white background. A man is giving a business presentation, pointing to a graph on a whiteboard. He is using a laptop and explaining the data. The scene is set in an office
Free with trial Line art business trend icons set featuring growth and decline bar charts for financial data visualization. Decrease business development vectors Line art business trend icons set featuring growth and decline bar charts for financial data visualization
Free with trial Increasing the quality and optimizing the costs of products or services to improve efficiency. Effective business, effective risk. Decrease business development illustrations Cost and quality control, business strategy and project management concept. Increasing the quality and optimizing the costs of products or services to improve efficiency. Effective business, effective risk
Free with trial Increasing the quality and optimizing the costs of products or services to improve efficiency. Effective business, effective risk. Decrease business development illustrations Cost and quality control, business strategy and project management concept. Increasing the quality and optimizing the costs of products or services to improve efficiency. Effective business, effective risk
Free with trial A man is presenting business data on a whiteboard, using a laptop. He is explaining the chart and graph to his colleagues. The scene is set in an office. Decrease business development illustrations Man presenting business data on a whiteboard with laptop isolated on white background. A man is presenting business data on a whiteboard, using a laptop. He is explaining the chart and graph to his colleagues. The scene is set in an office
Free with trial Set of icons illustrating data analysis and business analytics with various charts graphs and tools isolated on transparent background. Decrease business development vectors Collection of icons representing data analysis and business analytics with various charts graphs and tools. Set of icons illustrating data analysis and business analytics with various charts graphs and tools isolated on transparent background
Free with trial A minimal upward arrow symbolizing financial growth, business success and strategic progress in a modern conceptual design. Decrease business development illustrations AI generated Upward growth and financial success concept with abstract arrow, business progress and strategy. AI generated A minimal upward arrow symbolizing. A minimal upward arrow symbolizing financial growth, business success and strategic progress in a modern conceptual design
Free with trial Hand drawn line art illustration of financial analysis depicting growth and market trends for business strategy. Decrease business development vectors Hand drawn line art illustration of financial analysis depicting growth and market trends for business strategy
Free with trial A line art illustration shows a bar graph with arrows and a star on a purple background. It represents business growth, success, and achievement of goals. Decrease business development vectors Vector art of line art illustration of a bar graph with arrows and a star on a purple background business growth concept. A line art illustration shows a bar graph with arrows and a star on a purple background. It represents business growth, success, and achievement of goals
Free with trial Visualize complex market trends and strategy using this metallic, AI-generated bar chart illustration. Perfect for financial reports, planning presentations, and investor materials that require a sophisticated, high-impact visual representation of business growth, decline, and future success. Decrease business development illustrations Conceptual 3D business bar chart illustrating market performance, showing initial decline followed by upward growth. Visualize complex market trends and strategy using this metallic, AI-generated bar chart illustration. Perfect for financial reports, planning presentations, and investor materials that require a sophisticated, high-impact visual representation of business growth, decline, and future success.
Free with trial Minus 5 percent decrease red arrow. Plus 10 percent increase green arrow. Economic indicators. Financial statistics. Business performance. Market fluctuations shown. Decrease business development illustrations Red down arrow with minus 5 percent and green up arrow with plus 10 percent on white background. Minus 5 percent decrease red arrow. Plus 10 percent increase green arrow. Economic indicators. Financial statistics. Business performance. Market fluctuations shown
Free with trial Business analytics, data visualization, market research, financial reports, and growth strategies are symbolized in this image. Elegant empty space crafted for branding, ads, and product presentations. Suitable for marketing campaigns and creative displays. . Generative AI. Decrease business development illustrations Colorful Data Charts and Graphs on White Background Business analytics data visualization market research financial reports. Business analytics, data visualization, market research, financial reports, and growth strategies are symbolized in this image. Elegant empty space crafted for branding, ads, and product presentations. Suitable for marketing campaigns and creative displays. . Generative AI
Free with trial Cost reduction concept. Quality increase and cost optimization, Hands typing on a laptop with digital icons representing business efficiency and cost reduction. Effective business, Expense reduce. Decrease business development illustrations Cost reduction concept. Quality increase and cost optimization, Hands typing on a laptop with digital icons representing business
Free with trial Colorful business graph illustrating a decline in data, featuring a bold red arrow pointing downward. Ideal for enhancing presentations and finance reports with clear visual analysis. Decrease business development vectors Colorful business graph illustrating a decline in data, featuring a bold red arrow pointing downward. Ideal for
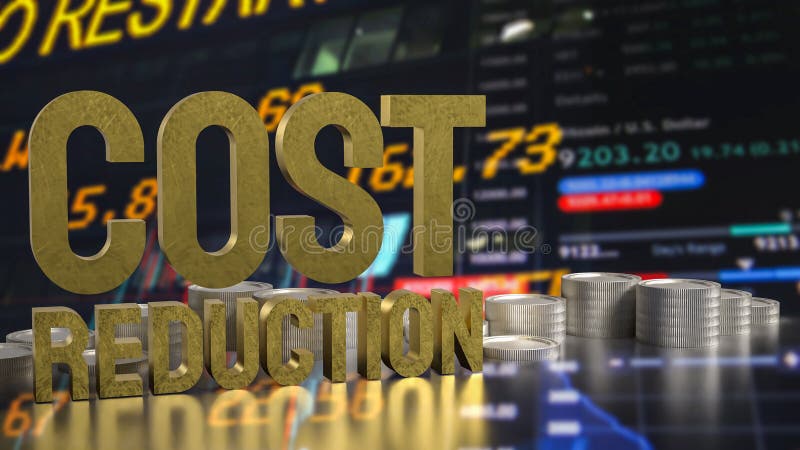
Free with trial The Cost reduction and coins for Business concept 3d rendering. Decrease business development illustrations The Cost reduction and coins for Business concept 3d rendering
Free with trial The Cost reduction and coins for Business concept 3d rendering. Decrease business development illustrations The Cost reduction and coins for Business concept 3d rendering
Free with trial The Cost reduction and coins for Business concept 3d rendering. Decrease business development illustrations The Cost reduction and coins for Business concept 3d rendering
Free with trial The Cost reduction and coins for Business concept 3d rendering. Decrease business development illustrations The Cost reduction and coins for Business concept 3d rendering
Free with trial The Cost reduction and coins for Business concept 3d rendering. Decrease business development illustrations The Cost reduction and coins for Business concept 3d rendering
Free with trial The Cost reduction and coins for Business concept 3d rendering. Decrease business development illustrations The Cost reduction and coins for Business concept 3d rendering
Free with trial The Cost reduction and coins for Business concept 3d rendering. Decrease business development illustrations The Cost reduction and coins for Business concept 3d rendering
Free with trial The Cost reduction and coins for Business concept 3d rendering. Decrease business development illustrations The Cost reduction and coins for Business concept 3d rendering
Free with trial The Cost reduction and coins for Business concept 3d rendering. Decrease business development illustrations The Cost reduction and coins for Business concept 3d rendering
Free with trial The Cost reduction and coins for Business concept 3d rendering. Decrease business development illustrations The Cost reduction and coins for Business concept 3d rendering
Free with trial The Cost reduction and coins for Business concept 3d rendering. Decrease business development illustrations The Cost reduction and coins for Business concept 3d rendering
Free with trial The Cost reduction and coins for Business concept 3d rendering. Decrease business development illustrations The Cost reduction and coins for Business concept 3d rendering
Free with trial Red percent decrease arrow and green percent increase arrow. Interest rates inflation economy concept. Up and down arrows for financial market change. Price decrease increase symbol. Decrease business development illustrations Red percent decrease arrow and green percent increase arrow represent interest rates inflation economy. Red percent decrease arrow and green percent increase arrow. Interest rates inflation economy concept. Up and down arrows for financial market change. Price decrease increase symbol
Free with trial This image features a conceptual bar graph, illustrating contrasting trends of growth and decline in business performance, ideal for data analysis presentations. Decrease business development illustrations Growth and Decline: Conceptual Bar Graph Illustrating Positive and Negative Trends in Business Performance Data Visualization. This image features a conceptual bar graph, illustrating contrasting trends of growth and decline in business performance, ideal for data analysis presentations
Free with trial Flopped business icon outline vector. Startup market crisis. Crashed new company. Decrease business development illustrations Flopped business icon outline vector. Startup market crisis
Free with trial Vibrant and colorful bar chart illustrating various data metrics, perfect for business or marketing use, highlighting trends and insights visually engaging for audiences. Decrease business development illustrations Colorful Bar Chart Showing Data Variations in a Bright and Engaging Style Suitable for Business Presentations or Marketing. Vibrant and colorful bar chart illustrating various data metrics, perfect for business or marketing use, highlighting trends and insights visually engaging for audiences
Free with trial This vibrant illustration features colorful bar graphs that visualize business growth and performance metrics, ideal for presentations, reports, and analysis. Decrease business development illustrations Colorful Bar Graphs Representing Business Growth and Performance Metrics in Vibrant Tones of Red, Orange, Yellow, White, and Green. This vibrant illustration features colorful bar graphs that visualize business growth and performance metrics, ideal for presentations, reports, and analysis
Free with trial Bright and colorful bar graph created with blocks illustrates data visualization in a contemporary business context. Ideal for finance and marketing materials. Decrease business development illustrations Colorful bar graph made of building blocks representing data visualization and analysis in modern business graphics on a clean. Bright and colorful bar graph created with blocks illustrates data visualization in a contemporary business context. Ideal for finance and marketing materials
Free with trial Small business fail icon outline vector. Poor marketing strategy. Startup failure collapse. Decrease business development vectors Small business fail icon outline vector. Poor marketing strategy
Free with trial Corporate startup failure icon outline vector. Business collapse. Strategy and finance crisis. Decrease business development illustrations Corporate startup failure icon outline vector. Business collapse
Free with trial Startup development trouble icon outline vector. Crisis explosion. Crashed new project. Decrease business development illustrations Startup development trouble icon outline vector. Crisis explosion
Free with trial Plant growing on coins stacking with carbon reduction sign for carbon credit and footprint can make more business profit and limit global warming from climate change concept. Decrease business development illustrations Plant growing on coins stacking with carbon reduction sign for carbon credit and footprint can make more business profit and
Free with trial Set Financial growth decrease Browser window Create account Search engine Secure your site with HTTPS SSL Cloud technology data transfer and Magnifying glass check mark icon. Vector. Decrease business development vectors Set Financial growth decrease, Browser window, Create account, Search engine, Secure your site with HTTPS, SSL, Cloud. Set Financial growth decrease Browser window Create account Search engine Secure your site with HTTPS SSL Cloud technology data transfer and Magnifying glass check mark icon. Vector.
Free with trial 3D Isometric Flat Vector Illustration of Business Chart, Data and Statistic. Decrease business development vectors 3D Isometric Flat Vector Illustration of Business Chart
Free with trial A business professional displays a digital graph of business growth trends. The graph showcases upward and downward fluctuations, representing the dynamic and complex nature of market analysis. The image is a visual representation of business growth and analysis using technology. The professional is likely studying data to make informed decisions for optimal performance and future growth. Decrease business development illustrations Business Growth Trend Analysis with Digital Graph. A business professional displays a digital graph of business growth trends. The graph showcases upward and downward fluctuations, representing the dynamic and complex nature of market analysis. The image is a visual representation of business growth and analysis using technology. The professional is likely studying data to make informed decisions for optimal performance and future growth
Free with trial Cut or decrease cost to increase profitability by minimizing expenses, eps10. Decrease business development vectors Cut or decrease cost to increase profitability by minimizing expenses
Free with trial Businesspeople handshake of commitment to reduce carbon to net zero by 2050 and sustainable development and business based on renewable energy. Decrease business development illustrations Businesspeople handshake of commitment to reduce carbon to net zero by 2050. AI Generated. Businesspeople handshake of commitment to reduce carbon to net zero by 2050 and sustainable development and business based on renewable energy.
Free with trial Businesspeople handshake of commitment to reduce carbon to net zero by 2050 and sustainable development and business based on renewable energy. Decrease business development illustrations Businesspeople handshake of commitment to reduce carbon to net zero by 2050. AI Generated. Businesspeople handshake of commitment to reduce carbon to net zero by 2050 and sustainable development and business based on renewable energy.
Free with trial A simple line graph illustration showing fluctuations and an upward trend. The graph is drawn on a grid with a black line and red data points, indicating a period of increase, followed by a decrease, and then a final increase. This image can be used to represent business trends, financial analysis, stock market data, or any data that shows changes over time. Decrease business development vectors Line Graph with Fluctuations. A simple line graph illustration showing fluctuations and an upward trend. The graph is drawn on a grid with a black line and red data points, indicating a period of increase, followed by a decrease, and then a final increase. This image can be used to represent business trends, financial analysis, stock market data, or any data that shows changes over time.
Free with trial Color megaphone icon with word decrease in white banner on blue background. Decrease business development vectors Color megaphone with word decrease in white banner on blue background
Free with trial A versatile set of business and finance icons isolated on a white background. This collection features various data visualization elements, including bar charts, line graphs, pie charts, and diagrams. The clean, vector style represents concepts like statistical analysis, market growth, financial reporting, and economic trends. These infographic elements are perfect for presentations, business reports, websites, and marketing materials to illustrate progress, performance, and data-driven insights. Decrease business development vectors Business and Finance Chart and Graph Icon Set. A versatile set of business and finance icons isolated on a white background. This collection features various data visualization elements, including bar charts, line graphs, pie charts, and diagrams. The clean, vector style represents concepts like statistical analysis, market growth, financial reporting, and economic trends. These infographic elements are perfect for presentations, business reports, websites, and marketing materials to illustrate progress, performance, and data-driven insights.
Free with trial Cost and Quality control, business strategy and project management technology concept. Businessman working on digital tablet with quality control growth graph and cost reduction, effective business. Decrease business development illustrations Cost and Quality control, business strategy and project management technology concept.
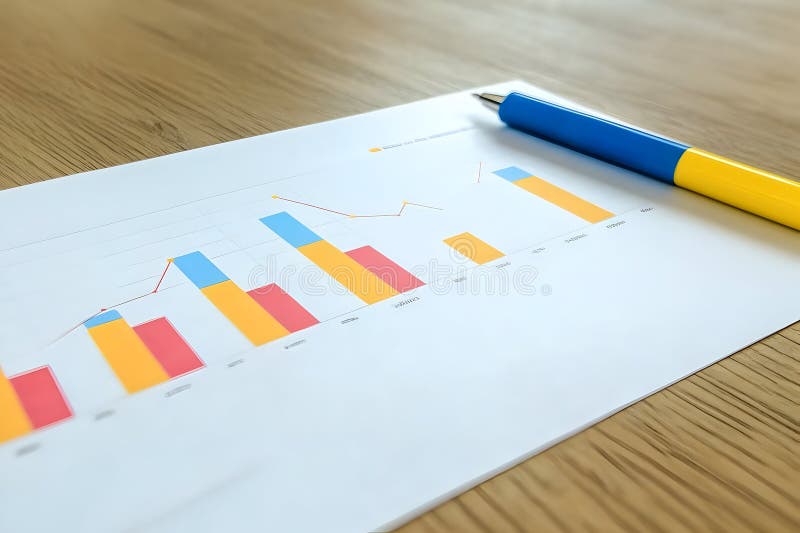
Free with trial Business graph chart report pen on wood table. Decrease business development illustrations Business graph chart report pen on wood table
Free with trial A hand-drawn illustration depicting a presentation on data trends. A stick figure presenter, holding a microphone, points to a chart on a screen labeled "DATA TRENDS. " The chart displays a line graph and bar graphs, suggesting growth and analysis. This image is suitable for illustrating business concepts, data analysis, presentations, and financial reports. It conveys a sense of information, communication, and progress. Decrease business development vectors Data Presentation: Business Trends and Analysis. A hand-drawn illustration depicting a presentation on data trends. A stick figure presenter, holding a microphone, points to a chart on a screen labeled "DATA TRENDS." The chart displays a line graph and bar graphs, suggesting growth and analysis. This image is suitable for illustrating business concepts, data analysis, presentations, and financial reports. It conveys a sense of information, communication, and progress.
Free with trial A modern 3D rendered abstract illustration featuring a prominent light blue downward-pointing arrow as its base. On top, a geometric structure is composed of a rectangular block, two stylized bar chart-like elements, and a central dark grey multifaceted polyhedron. Set against a clean white background, this graphic symbolizes concepts like data analysis, business trends, financial decline, foundational structures, or urban development. Its minimalist and digital aesthetic makes it suitable for technology, finance, and corporate presentations, infographics, and web design. Decrease business development vectors Abstract 3D Data Structure with Downward Arrow. A modern 3D rendered abstract illustration featuring a prominent light blue downward-pointing arrow as its base. On top, a geometric structure is composed of a rectangular block, two stylized bar chart-like elements, and a central dark grey multifaceted polyhedron. Set against a clean white background, this graphic symbolizes concepts like data analysis, business trends, financial decline, foundational structures, or urban development. Its minimalist and digital aesthetic makes it suitable for technology, finance, and corporate presentations, infographics, and web design.
Free with trial Hand holding CO2 reducing icon with environment symbol for decrease CO2,carbon footprint and carbon credit to limit global warming from climate change,Bio Circular Green Economy concept. Decrease business development illustrations Hand holding CO2 reducing icon with environment symbol for decrease CO2 , carbon footprint and carbon credit to limit global. Hand holding CO2 reducing icon with environment symbol for decrease CO2,carbon footprint and carbon credit to limit global warming from climate change,Bio Circular Green Economy concept.
Free with trial A vibrant collection of hand-drawn business charts and graphs, rendered in shades of blue with a sketch-like aesthetic. The set includes various types of visualizations like bar charts, line graphs, pie charts, and donut charts, representing data, growth, and analysis. This versatile illustration is perfect for presentations, reports, infographics, and any project requiring a visual representation of financial or statistical information with a creative, hand-crafted feel. Decrease business development illustrations Hand-Drawn Business Charts and Graphs Collection. A vibrant collection of hand-drawn business charts and graphs, rendered in shades of blue with a sketch-like aesthetic. The set includes various types of visualizations like bar charts, line graphs, pie charts, and donut charts, representing data, growth, and analysis. This versatile illustration is perfect for presentations, reports, infographics, and any project requiring a visual representation of financial or statistical information with a creative, hand-crafted feel.
Free with trial Money crash on chart graph with arrow down, fail financial business invest. Fall dollar. Vector flat illustration. Decrease business development vectors Money crash on chart graph with arrow down, fail financial business invest. Fall dollar. Vector illustration
Free with trial Hand holding green leaf with carbon reduction icon on blue sky background for decrease CO2 , carbon footprint and carbon credit to limit global warming from climate change concept. Decrease business development illustrations Hand holding green leaf with carbon reduction icon on blue sky background for decrease CO2 , carbon footprint and carbon credit to
Free with trial This vector icon set features graph diagrams with arrows indicating growth and decline. The icons represent business metrics and financial performance, with arrows pointing upward for growth and downward for decline. These symbols are ideal for visualizing trends, success, and changes in finance reports or business charts. The clean, simple design ensures clarity, making these icons suitable for use in presentations, reports, or dashboards to effectively communicate financial or business performance. Decrease business development vectors Growing up and down vector icon set. Graph diagram with arrow. Business growth success chart. Finance report symbol. This vector icon set features graph diagrams with arrows indicating growth and decline. The icons represent business metrics and financial performance, with arrows pointing upward for growth and downward for decline. These symbols are ideal for visualizing trends, success, and changes in finance reports or business charts. The clean, simple design ensures clarity, making these icons suitable for use in presentations, reports, or dashboards to effectively communicate financial or business performance.
Free with trial A vector illustration showing a magnifying glass focused on a bar graph and line chart indicating growth. The magnifying glass has a blue frame and red handle. The chart depicts an upward trend, suggesting positive business performance. This image is suitable for illustrating data analysis, business strategy, market research, and financial growth concepts. Decrease business development vectors Analyzing Growth: Magnifying Glass on Business Chart. A vector illustration showing a magnifying glass focused on a bar graph and line chart indicating growth. The magnifying glass has a blue frame and red handle. The chart depicts an upward trend, suggesting positive business performance. This image is suitable for illustrating data analysis, business strategy, market research, and financial growth concepts.
Free with trial Glowing of green up arrow with carbon reduction on businessman until achievement environment target for decrease CO2 , carbon footprint and carbon credit to limit global warming from climate change. Decrease business development illustrations Glowing of green up arrow with carbon reduction on businessman until achievement environment target for decrease CO2 , carbon
Free with trial Laptop displaying a graph, visualizing data analysis and market trends for business decisions ,Generative ai. Decrease business development illustrations Laptop with graph, data analysis for market trends and business decisions. Laptop displaying a graph, visualizing data analysis and market trends for business decisions ,Generative ai
Free with trial A close-up, angled perspective of several printed business reports displaying a variety of financial data. The documents feature colorful pie charts, blue bar graphs, and line graphs tracking performance and statistics. This image is perfect for illustrating concepts such as data analysis, market research, financial planning, investment strategy, and corporate performance review. The detailed charts and figures represent the core of business analytics, accounting, and economic forecasting, making it a versatile background for financial presentations and articles. Decrease business development illustrations Business Analytics Report with Financial Charts and Graphs. A close-up, angled perspective of several printed business reports displaying a variety of financial data. The documents feature colorful pie charts, blue bar graphs, and line graphs tracking performance and statistics. This image is perfect for illustrating concepts such as data analysis, market research, financial planning, investment strategy, and corporate performance review. The detailed charts and figures represent the core of business analytics, accounting, and economic forecasting, making it a versatile background for financial presentations and articles.
Free with trial Yellow cube with arrow up. Business and market growth concept. Close-up. Decrease business development illustrations Yellow cube with arrow up. Business and market growth concept
Free with trial A 3D figure sits on a platform reviewing financial data, using a laptop to analyze bar graphs, pie charts and line graphs representing business performance and growth. Decrease business development illustrations 3D Character Analyzing Business Charts and Graphs on Laptop. A 3D figure sits on a platform reviewing financial data, using a laptop to analyze bar graphs, pie charts and line graphs representing business performance and growth.
Free with trial Smashing interest rates concept for financial decrease and investment opportunity design illustration ai generated. Decrease business development vectors Smashing interest rates concept for financial decrease and investment opportunity design illustration ai generated
Free with trial This image displays a dynamic business analytics dashboard featuring both bar and line graphs. The bar chart illustrates varying percentages (15%, 50%, 75%, 85%), suggesting performance metrics or growth stages. The line chart, with its intersecting blue lines and data points, represents trends, fluctuations, and comparisons over time or across different categories. The clean, modern design makes it ideal for financial reports, business presentations, and data visualization concepts. Decrease business development illustrations Business Growth and Performance Analysis with Bar and Line Charts. This image displays a dynamic business analytics dashboard featuring both bar and line graphs. The bar chart illustrates varying percentages (15%, 50%, 75%, 85%), suggesting performance metrics or growth stages. The line chart, with its intersecting blue lines and data points, represents trends, fluctuations, and comparisons over time or across different categories. The clean, modern design makes it ideal for financial reports, business presentations, and data visualization concepts.
Free with trial Profit and loss infographic template. Simple business presentation profit and loss issue. Decrease business development vectors Profit and loss infographic template. Simple business presentation profit and loss issue
Free with trial A 3D white character cheerfully presents a bar chart showing upward business growth trends, highlighting success and positive development. Decrease business development illustrations 3D Character Presenting Business Growth Bar Chart. A 3D white character cheerfully presents a bar chart showing upward business growth trends, highlighting success and positive development.
Free with trial Profit Icon Line Design Style Simple Business and Financial Vector Perfect Symbol. Decrease business development vectors Profit Icon Line Design Style Simple Business and Financial Vector
Free with trial Path to Business Success: Hands Stack Wooden Blocks for Growth and Development. Decrease business development illustrations Wooden Blocks Forming A Pyramid With Downward Arrow. generative AI. Path to Business Success: Hands Stack Wooden Blocks for Growth and Development
Free with trial Presentation board with decreasing bar graph for business statistics. Decrease business development vectors Presentation board with decreasing bar graph for business statistics
Free with trial A collection of minimalist outline icons representing finance and business data charts, symbols, and indicators for graphic design and web development. Decrease business development vectors Minimalist Outline Finance and Business Data Chart Symbol Icon Set. A collection of minimalist outline icons representing finance and business data charts, symbols, and indicators for graphic design and web development.
Free with trial Isolated illustration of a person with a hoodie and line graph. Perfect for business and investment concepts. Decrease business development vectors Person with Graph in Hoodie Cartoon - Business, Growth, Investment, Trends. Isolated illustration of a person with a hoodie and line graph. Perfect for business and investment concepts.
Free with trial Distributed database logo design with editable slogan. Business card and branding book template. Decrease business development illustrations Distributed database logo design with editable slogan. Branding book and business card template. Distributed database logo design with editable slogan. Business card and branding book template.