Free with trial This striking graphic illustrates a significant economic downturn or market crash with a bold red arrow plunging downwards. Rendered by Ai, the image uses simple colors to maximize impact setting the alarming decline against subtle background charts. It effectively communicates concepts of loss decrease and a strong negative trend in business metrics. Decrease business graph illustrations Red arrow showing sharp financial market decline. This striking graphic illustrates a significant economic downturn or market crash with a bold red arrow plunging downwards. Rendered by Ai, the image uses simple colors to maximize impact setting the alarming decline against subtle background charts. It effectively communicates concepts of loss decrease and a strong negative trend in business metrics
Free with trial A financial chart illustrating a significant downward trend. The chart features two lines, one black and one bold red, both indicating a decline over time. The red line emphasizes the sharp decrease, culminating in a prominent arrow pointing downwards. The background is a simple grid, providing a clear visual representation of the data's movement. This image is suitable for illustrating concepts like market crash, economic recession, or business failure. Decrease business graph vectors Downward Trend Chart. A financial chart illustrating a significant downward trend. The chart features two lines, one black and one bold red, both indicating a decline over time. The red line emphasizes the sharp decrease, culminating in a prominent arrow pointing downwards. The background is a simple grid, providing a clear visual representation of the data's movement. This image is suitable for illustrating concepts like market crash, economic recession, or business failure.
Free with trial A bar chart showing a steady decline with a red downward arrow, symbolizing financial loss, economic downturn, business decline, or negative performance trends. Decrease business graph illustrations Economic Downtrend Bar Chart for Business concept 3d Rendering. A bar chart showing a steady decline with a red downward arrow, symbolizing financial loss, economic downturn, business decline, or negative performance trends
Free with trial Business falling icon isolated on background vector illustration. Non AI Generate. Decrease business graph vectors Business falling icon isolated on background vector illustration.
Free with trial A simple illustration of a bar chart with a downward arrow showing decline, loss, negative growth, or decreasing business and financial performance. Decrease business graph vectors Business Decline Chart Illustration. A simple illustration of a bar chart with a downward arrow showing decline, loss, negative growth, or decreasing business and financial performance
Free with trial Consumer purchasing power and consumption down color line icon, vector economic crisis and inflation. Finance and business recession, bankruptcy outline symbol with shopping cart and down arrow graph. Decrease business graph vectors Consumer purchasing power down color line icon. Consumer purchasing power and consumption down color line icon, vector economic crisis and inflation. Finance and business recession, bankruptcy outline symbol with shopping cart and down arrow graph
Free with trial An adorable, plump orange tabby cat dressed in a blue collar and tie stands beside a presentation screen. The screen displays a bar graph and a line graph indicating a downward financial trend, with a prominent '-25%' marker. To the left, an office desk with a laptop and an ergonomic chair suggest a business or work environment. This whimsical illustration is perfect for conveying concepts related to financial performance, business analysis, or even humorous takes on economic downturns. Decrease business graph illustrations Cartoon Cat Presenting Financial Report with Downward Trend. An adorable, plump orange tabby cat dressed in a blue collar and tie stands beside a presentation screen. The screen displays a bar graph and a line graph indicating a downward financial trend, with a prominent '-25%' marker. To the left, an office desk with a laptop and an ergonomic chair suggest a business or work environment. This whimsical illustration is perfect for conveying concepts related to financial performance, business analysis, or even humorous takes on economic downturns.
Free with trial Abstract financial chart with downtrend line graph and arrow in stock market on red color background. Decrease business graph illustrations Downtrend line graph and arrow in stock market on red color background
Free with trial Abstract financial chart with downtrend line graph and arrow in stock market on red color background. Decrease business graph illustrations Downtrend line graph and arrow in stock market on red color background
Free with trial Illustration of a business activities. Decrease business graph vectors Illustration of a business activities
Free with trial Illustration of a business activities. Decrease business graph vectors Illustration of a business activities
Free with trial Down arrow icon set. Decline decrease symbol. Downward trend sign vector. Decrease business graph vectors Down arrow icon set. Decline decrease symbol. Downward trend sign
Free with trial Business Down Icon - Percentage Rate Loss Icon sing symbol. Decrease business graph vectors Business Down Icon - Percentage Rate Loss Icon
Free with trial Downward trend line on a graph, sad face emotion, and cloudy visuals. Ideal for business loss, financial crisis, economic recession, failure, mood weather metaphor decline. Simple flat metaphor. Decrease business graph vectors Declining Performance Chart with Sad Face and Cloudy Atmosphere. Downward trend line on a graph, sad face emotion, and cloudy visuals. Ideal for business loss, financial crisis, economic recession, failure, mood weather metaphor decline. Simple flat metaphor
Free with trial Decrease: Decrease represents a reduction in value, amount, or performance over time. Decrease business graph illustrations Illustration of Decrease. Decrease: Decrease represents a reduction in value, amount, or performance over time.
Free with trial Futuristic Declining Bar Graph with Downward Arrow on Dark Blue Background, Business Loss and Negative Growth Concept. Decrease business graph vectors Business Loss and Negative Growth Concept
Free with trial Downward graph with trend points, sad face symbolizing poor performance, and a play button. Ideal for business, analytics, finance, marketing, strategy data loss media. Simple flat metaphor. Decrease business graph vectors Declining Trend Chart with Sad Face and Play Button Concept. Downward graph with trend points, sad face symbolizing poor performance, and a play button. Ideal for business, analytics, finance, marketing, strategy data loss media. Simple flat metaphor
Free with trial Recession economic crisis financial downturn woman climbs ladder to lightbulb over declining graph with dollar coins pastel background mobile app screen Vector illustration. Decrease business graph vectors Recession economic crisis financial downturn woman climbs ladder to lightbulb over declining graph with dollar coins
Free with trial A red bear roaring with stock graph, surreal vibrant scene, financial market downturn, dramatic atmosphere, intense emotion. Decrease business graph illustrations Red bear roaring with stock graph, surreal vibrant scene, financial market downturn, dramatic atmosphere, intense emotion
Free with trial Cost reduction, cost efficiency, business concept. Decrease business graph illustrations Cost reduction, cost efficiency, business concept
Free with trial Vibrant vector illustration featuring business data charts and graphs, including bar graphs, line graphs, pie charts, and a roller coaster metaphor for market trends. This eye-catching design is perfect for presentations, infographics, and financial reports. Decrease business graph illustrations Business Data Charts Graphs Vector Illustration, Statistics. Vibrant vector illustration featuring business data charts and graphs, including bar graphs, line graphs, pie charts, and a roller coaster metaphor for market trends. This eye-catching design is perfect for presentations, infographics, and financial reports.
Free with trial A gold bar graph with an arrow pointing down at the end. Decrease business graph illustrations A gold bar graph with an arrow
Free with trial Business arrow up success seamless pattern isolated on color background. Simple background. Decrease business graph vectors Business arrow up success seamless pattern isolated on color background
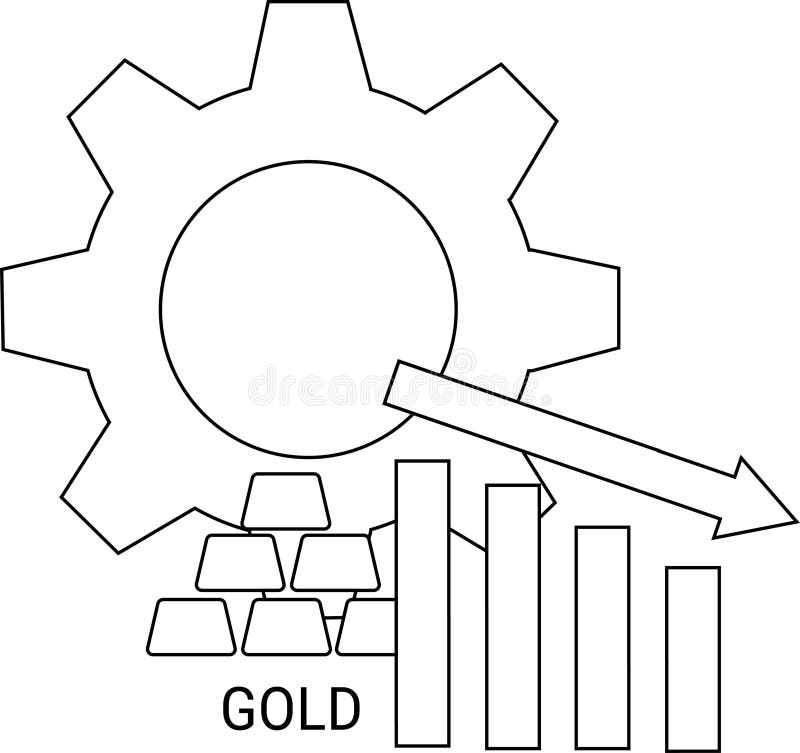
Free with trial Conceptual diagram depicting a decrease in gold production. Decrease business graph illustrations Gold Production Decrease Gear, Bars, Arrow Concept. Conceptual diagram depicting a decrease in gold production.
Free with trial Bankruptcy concept in flat design business. design vector illustration. Decrease business graph vectors Bankruptcy concept in flat vector design business. bankruptcy concept in flat design business.design vector illustration
Free with trial Downward arrow icon set. Decrease direction symbol. Reduction indicator sign vector. Decrease business graph vectors Downward arrow icon set. Decrease direction symbol. Reduction indicator sign
Free with trial Microphone symbol for voice input, bar graph indicating decline, and sad face reaction. Ideal for communication, feedback, analysis, customer service, dissatisfaction, technology simple flat. Decrease business graph vectors Voice Input with Declining Graph and Blue Sad Face Suggesting Negative Feedback. Microphone symbol for voice input, bar graph indicating decline, and sad face reaction. Ideal for communication, feedback, analysis, customer service, dissatisfaction, technology simple flat
Free with trial A red bear standing near water with red candlestick stock graph background, symbolizing bearish market trend and financial downturn. Decrease business graph illustrations Red bear standing near water with red candlestick stock graph background, symbolizing bearish market trend and financial downturn
Free with trial A blue bar chart with four bars of decreasing height and a large blue downward arrow on the left side, indicating a decline or decrease in value. Scalable format print and digital media. Decrease business graph vectors Decreasing bar chart with downward arrow blue graph. A blue bar chart with four bars of decreasing height and a large blue downward arrow on the left side, indicating a decline or decrease in value. Scalable format print and digital media
Free with trial Stack of bitcoin coins. in background a graph showing decrease in value. Falling of cryptocurrency. Decrease business graph vectors Bitcoin, cryptocurrency falling graph, risk, crash, collapse of BTC. Stack of bitcoin coins. in background a graph showing decrease in value. Falling of cryptocurrency.
Free with trial An illustration showing a declining blue bar graph with a sad person icon next to a downward arrow in flat style. Decrease business graph vectors Declining bar graph with a sad person illustration. An illustration showing a declining blue bar graph with a sad person icon next to a downward arrow in flat style.
Free with trial Downward Trend Line Graph Icons for Financial Data vol 34820. Decrease business graph vectors Downward Trend Line Graph Icons for Financial Data
Free with trial Sad face beside a chart showing a downward curve, circular target design, and finger tap icon. Ideal for business losses, failure, feedback, analytics, disappointment usability data trends. Simple. Decrease business graph vectors Declining Trend Displayed with Sad Face, Downward Graph Line, and Finger Tap Icon. Sad face beside a chart showing a downward curve, circular target design, and finger tap icon. Ideal for business losses, failure, feedback, analytics, disappointment usability data trends. Simple
Free with trial Decreasing Bar Chart Icons for Business Analytics vol 34819. Decrease business graph vectors Decreasing Bar Chart Icons for Business Analytics
Free with trial A sad red bear sitting with arms crossed, stock market graph in background, symbolizing financial loss, bearish trend, and emotional impact. Decrease business graph illustrations Sad red bear sitting with arms crossed, stock market graph in background, symbolizing financial loss, bearish trend, and emotional
Free with trial Circular percentage icon indicating a decrease or reduction, useful for financial concepts like interest rate changes, sales, discounts, and data analysis in business and economics. Decrease business graph vectors Decreasing percentage rate circular icon illustration. Circular percentage icon indicating a decrease or reduction, useful for financial concepts like interest rate changes, sales, discounts, and data analysis in business and economics
Free with trial Tax Graph Down : A Tax Graph Down represents a decrease in tax revenue or a financial decline. Decrease business graph vectors Tax Graph Down
Free with trial Simple black and white vector illustration showing bar charts indicating increase and decrease, perfect for financial or data concepts. Decrease business graph vectors Bar chart icon showing increase and decrease data. Simple black and white vector illustration showing bar charts indicating increase and decrease, perfect for financial or data concepts
Free with trial A versatile set of black and white vector icons depicting financial growth, decline, and market trends. Perfect for business, analytics, and finance presentations. Decrease business graph vectors Set of increase and decrease financial data icons. A versatile set of black and white vector icons depicting financial growth, decline, and market trends. Perfect for business, analytics, and finance presentations
Free with trial Professional golden user icon with downward graph symbol for loss or risk analytics, glossy finish suitable for financial reports, deficit tracking, and negative trend indicators. Decrease business graph illustrations Professional golden user icon with downward graph symbol for loss or risk analytics, glossy finish suitable for financial reports
Free with trial This minimalist illustration depicts a downward trending graph superimposed with two stylized power pylons. A vibrant green leaf is positioned near the end of the graph, symbolizing the shift towards renewable or sustainable energy sources. The composition suggests a decline in traditional energy infrastructure or consumption, with an implied transition to eco-friendly alternatives. Ideal for concepts related to energy policy, environmental impact, economic shifts in the power sector, and the future of electricity. Decrease business graph vectors Green Energy Transition and Power Grid Decline Graph. This minimalist illustration depicts a downward trending graph superimposed with two stylized power pylons. A vibrant green leaf is positioned near the end of the graph, symbolizing the shift towards renewable or sustainable energy sources. The composition suggests a decline in traditional energy infrastructure or consumption, with an implied transition to eco-friendly alternatives. Ideal for concepts related to energy policy, environmental impact, economic shifts in the power sector, and the future of electricity.
Free with trial Bar chart showing stock market increase and decrease. Decrease business graph vectors Bar chart showing stock market increase and decrease.
Free with trial Decrease bar chart icon on circle line. Statistic sign symbol illustration. Decrease business graph vectors Decrease bar chart icon on circle line. Statistic sign symbol
Free with trial Bankruptcy concept in flat design business. design vector illustration. Decrease business graph vectors Bankruptcy finance business concept flat vector design. bankruptcy concept in flat design business.design vector illustration
Free with trial A line art icon depicting business performance analysis. Decrease business graph illustrations Gear, Chart, Envelope Business Performance Analysis Icon. A line art icon depicting business performance analysis.
Free with trial A flat design vector illustration showing a graph with rising and falling bars, marked by green and red arrows indicating increase and decrease. Ideal for financial concepts. Decrease business graph vectors Bar chart showing positive and negative data trends. A flat design vector illustration showing a graph with rising and falling bars, marked by green and red arrows indicating increase and decrease. Ideal for financial concepts
Free with trial A stylized illustration of a descending bar graph within a website window, rendered in a flat, minimalist design. Decrease business graph vectors Decreasing bar graph inside a website window interface. A stylized illustration of a descending bar graph within a website window, rendered in a flat, minimalist design.
Free with trial Downward line graph with data points, red sad emoticon, error message box, and cloud. Ideal for business loss, mistakes, failure, analytics issues, disappointment error handling or recovery. Decrease business graph vectors Declining Trend with Error Message and Sad Emoticon Representing Failure or Loss. Downward line graph with data points, red sad emoticon, error message box, and cloud. Ideal for business loss, mistakes, failure, analytics issues, disappointment error handling or recovery
Free with trial Line graph with downward trend, sad face for dissatisfaction, alert bell for warning, and magnifier symbolizing evaluation. Ideal for data analysis, performance tracking, decline, warning, failure. Decrease business graph vectors Declining Graph with Sad Face, Alert Bell, and Magnifier Indicating Negative Trends. Line graph with downward trend, sad face for dissatisfaction, alert bell for warning, and magnifier symbolizing evaluation. Ideal for data analysis, performance tracking, decline, warning, failure
Free with trial This graphic displays two circular icons, one depicting a downward-pointing arrow with a dollar sign, symbolizing a decrease in value, and the other an upward arrow with a dollar sign, representing an increase. Decrease business graph vectors Cost decrease or increase icon. Downward vs upward dollar signs. This graphic displays two circular icons, one depicting a downward-pointing arrow with a dollar sign, symbolizing a decrease in value, and the other an upward arrow with a dollar sign, representing an increase.
Free with trial 3D graph going up and down with red arrows, blue bar chart icon vector, sales chart with 3D arrow down and arrow up, financial analytics symbol, EPS 10. Decrease business graph vectors 3D graph going up and down with red arrows, blue bar chart icon vector, sales chart symbol. 3D graph going up and down with red arrows, blue bar chart icon vector, sales chart with 3D arrow down and arrow up, financial analytics symbol, EPS 10
Free with trial Business analysis, performance tracking, resource management, environmental monitoring, sustainability, decline. Declining arrow with graph and water droplet. Business analysis and environmental. Decrease business graph vectors Data Analysis Concept with Decline Arrow, Chart, and Blue Water Droplet Icon. Business analysis, performance tracking, resource management, environmental monitoring, sustainability, decline. Declining arrow with graph and water droplet. Business analysis and environmental
Free with trial Euro Currency Decrease Icon Set: Financial Decline Symbol vol 34475. Decrease business graph vectors Euro Currency Decrease Icon Set: Financial Decline Symbol
Free with trial Flat design illustration showing downward trend with graph, coins and descending arrow. Demonstrates financial loss and market decline. Decrease business graph vectors Declining financial graph with downward trend and currency. Flat design illustration showing downward trend with graph, coins and descending arrow. Demonstrates financial loss and market decline.
Free with trial Cardboard box with label beside a fluctuating line graph, denoting analytics, efficiency, shipment tracking, or delivery trends. Ideal for logistics, e-commerce, data trends, analysis operations. Decrease business graph vectors Box with Shipping Label and Data Graph Representing Logistics and Performance Trends. Cardboard box with label beside a fluctuating line graph, denoting analytics, efficiency, shipment tracking, or delivery trends. Ideal for logistics, e-commerce, data trends, analysis operations
Free with trial Sad face next to a declining line graph indicating falling satisfaction levels. Green, orange, and red happy faces for feedback. Ideal for data trends, surveys, reports, performance, analysis. Decrease business graph illustrations Declining satisfaction levels represented with happy faces and a downward trend graph. Sad face next to a declining line graph indicating falling satisfaction levels. Green, orange, and red happy faces for feedback. Ideal for data trends, surveys, reports, performance, analysis
Free with trial A bar chart showing a steady decline with a red downward arrow, symbolizing financial loss, economic downturn, business decline, or negative performance trends. Decrease business graph illustrations Economic Downtrend Bar Chart for Business concept 3d Rendering. A bar chart showing a steady decline with a red downward arrow, symbolizing financial loss, economic downturn, business decline, or negative performance trends
Free with trial A bar chart showing a steady decline with a red downward arrow, symbolizing financial loss, economic downturn, business decline, or negative performance trends. Decrease business graph illustrations Economic Downtrend Bar Chart for Business concept 3d Rendering. A bar chart showing a steady decline with a red downward arrow, symbolizing financial loss, economic downturn, business decline, or negative performance trends
Free with trial A bar chart showing a steady decline with a red downward arrow, symbolizing financial loss, economic downturn, business decline, or negative performance trends. Decrease business graph illustrations Economic Downtrend Bar Chart for Business concept 3d Rendering. A bar chart showing a steady decline with a red downward arrow, symbolizing financial loss, economic downturn, business decline, or negative performance trends
Free with trial Data analysis. Visualizing analytics through a chart and declining arrow downward trends. Data analysis for business reporting, statistics, forecasting, and presentations. Decrease business graph vectors Data Analysis and Declining Metrics by Graphs and Arrows for Business Reporting. Data analysis. Visualizing analytics through a chart and declining arrow downward trends. Data analysis for business reporting, statistics, forecasting, and presentations
Free with trial A simplified flat style icon displays a declining bar graph with arrow. Focuses on business and financial themes. Decrease business graph vectors Flat icon illustration showing bar chart trending downwards. A simplified flat style icon displays a declining bar graph with arrow. Focuses on business and financial themes.
Free with trial Flat vector illustration of a colorful bar graph showing a decreasing trend with an arrow on a black backdrop. Decrease business graph vectors Decreasing bar graph with downward arrow on black background. Flat vector illustration of a colorful bar graph showing a decreasing trend with an arrow on a black backdrop.
Free with trial A flat design shows a bar graph depicting decreasing sales, with a downward trending red arrow. Decrease business graph vectors Decreasing Business Chart Shows a Dramatic Downturn in Sales. A flat design shows a bar graph depicting decreasing sales, with a downward trending red arrow.
Free with trial Economic crisis line icon of investment decline with arrow down, vector outline symbol. Global economy downturn and bankruptcy or world crisis in banking business and stock exchange decrease. Decrease business graph vectors Economic crisis line icon of investment decline
Free with trial A dark blue bar chart with four bars and a large blue downward arrow crossing through it, indicating a downward trend or decrease in value. Scalable format print and digital media. Decrease business graph vectors Bar chart with downward trend line blue arrow graph statistics. A dark blue bar chart with four bars and a large blue downward arrow crossing through it, indicating a downward trend or decrease in value. Scalable format print and digital media
Free with trial Decrease growth arrow with Rupee sign. decrease in Indian Rupee value concept. 3d illustration. Decrease business graph illustrations Decrease growth arrow with Rupee sign. decrease in Indian Rupee value concept. 3d illustration
Free with trial A flat style graph depicting a downward trend with declining bars and arrow. Strong use of contrasting colors. Decrease business graph vectors Declining bar graph showing negative trend with falling arrow. A flat style graph depicting a downward trend with declining bars and arrow. Strong use of contrasting colors.
Free with trial Minimalist style gradient blue diagram showing downward trend line graph on black background representing economic decline or loss. Decrease business graph vectors Downward trend line graph on black background for infographic. Minimalist style gradient blue diagram showing downward trend line graph on black background representing economic decline or loss.
Free with trial Stock market correction concept. Bankrupt financial information. Descending trading graph. Decrease business graph vectors Stock market correction concept. Bankrupt financial information. Descending trading graph
Free with trial Colorful pie chart is showing positive statistics and business growth, target and financial analysis and marketing report, data with copy space. Decrease business graph vectors Colorful pie chart is showing positive statistics and business growth, target and financial analysis and marketing
Free with trial A simple flat style bar graph shows a negative trend, with a downward arrow on a black background. Decrease business graph vectors Decreasing bar graph with downward arrow over black background. A simple flat style bar graph shows a negative trend, with a downward arrow on a black background.
Free with trial Someone is taking notes, the graph looks down. Decrease business graph illustrations Is recording a downward graph. someone is taking notes, the graph looks down
Free with trial An abstract visual representation of data, featuring a vibrant red bar chart resembling a cityscape or sound wave, overlaid with a line graph and connecting dots. This dynamic graphic is ideal for concepts related to financial analysis, business intelligence, or data visualization. Decrease business graph illustrations Red Abstract Bar Chart Waveform with Connecting Dots and Lines - Data Analysis. An abstract visual representation of data, featuring a vibrant red bar chart resembling a cityscape or sound wave, overlaid with a line graph and connecting dots. This dynamic graphic is ideal for concepts related to financial analysis, business intelligence, or data visualization.
Free with trial A line graph showing a downward trend with two colored lines on a grid background. The graph represents data analysis and statistics. Decrease business graph illustrations Downward Trend Line Graph. A line graph showing a downward trend with two colored lines on a grid background. The graph represents data analysis and statistics.
Free with trial A bar chart showing a steady decline with a red downward arrow, symbolizing financial loss, economic downturn, business decline, or negative performance trends. Decrease business graph illustrations Economic Downtrend Bar Chart for Business concept 3d Rendering. A bar chart showing a steady decline with a red downward arrow, symbolizing financial loss, economic downturn, business decline, or negative performance trends
Free with trial Sad face beside a descending line graph with plotted points, accompanied by a robot holding a data file. Ideal for technology, analytics, business insights, AI impact, performance review. Decrease business graph vectors Declining Trends Analyzed by AI Robot with Sad Face Indicating Negative Performance. Sad face beside a descending line graph with plotted points, accompanied by a robot holding a data file. Ideal for technology, analytics, business insights, AI impact, performance review
Free with trial A bar chart showing a steady decline with a red downward arrow, symbolizing financial loss, economic downturn, business decline, or negative performance trends. Decrease business graph illustrations Economic Downtrend Bar Chart for Business concept 3d Rendering. A bar chart showing a steady decline with a red downward arrow, symbolizing financial loss, economic downturn, business decline, or negative performance trends
Free with trial Bar graph with an upward trend, blue downward arrow, and percentage sign. Ideal for business analysis, finance, growth, decline trends, statistics economics comparison. Flat simple metaphor. Decrease business graph vectors Financial chart with growth trend, declining arrow, and percentage symbol representing data analysis. Bar graph with an upward trend, blue downward arrow, and percentage sign. Ideal for business analysis, finance, growth, decline trends, statistics economics comparison. Flat simple metaphor
Free with trial Decrease and increase chart icon with arrow. Negative and positive trend symbol illustration. Decrease business graph vectors Decrease and increase chart icon with arrow. Negative and positive trend symbol