Free with trial Financial crisis impact concept with stressed individual and red stock market graph in urban setting. Generative AI. Decrease business graph illustrations Financial crisis impact concept with stressed individual and red stock market graph in urban setting
Free with trial This abstract illustration depicts the dynamic nature of financial markets, showcasing both significant volatility and an overall upward growth trend. A prominent red line graph indicates positive development, while underlying grey jagged lines and vertical bars represent frequent fluctuations and market uncertainty. To the right, orange up and down arrows symbolize the opposing forces and constant changes within the market. This visual is ideal for conveying concepts related to stock market performance, economic indicators, investment risks, and business analysis. Decrease business graph vectors Financial Market Volatility and Growth Trend. This abstract illustration depicts the dynamic nature of financial markets, showcasing both significant volatility and an overall upward growth trend. A prominent red line graph indicates positive development, while underlying grey jagged lines and vertical bars represent frequent fluctuations and market uncertainty. To the right, orange up and down arrows symbolize the opposing forces and constant changes within the market. This visual is ideal for conveying concepts related to stock market performance, economic indicators, investment risks, and business analysis.
Free with trial Chart decline icon. Business loss symbol. Vector trend design. Black background shape. EPS 10. Decrease business graph vectors Chart decline icon. Business loss symbol. Vector trend design. Black background shape.
Free with trial Stock market downturn red graph line falls financial crisis background business news illustration. Decrease business graph illustrations Financial Stock Market Chart Downward Trend, Recession, Economy Crisis Background. Stock market downturn red graph line falls financial crisis background business news illustration
Free with trial A minimalist line graph depicts a significant downward trend with a sharp, jagged line indicating a decline. Decrease business graph illustrations Simple line graph illustrating a sharp downward trend and decline. A minimalist line graph depicts a significant downward trend with a sharp, jagged line indicating a decline
Free with trial Statistic Bar Chart Outline Sign Data Stats Business Performance Market Analysis Economic Trend Line Icon Presentation Display Board Symbol. Decrease business graph vectors Statistic Bar Chart Outline Sign Data Stats Business Performance Market Analysis Economic Trend Line Icon Presentation Display
Free with trial Financial crisis recession falling graph chart warning declining bar and line graph red exclamation coins documents cityscape abstract background Vector illustration. Decrease business graph vectors Financial crisis recession falling graph chart warning declining bar and line graph red exclamation coins documents cityscape
Free with trial Uptrend and downtrend business chart icon vector. Economic growth and decline arrow symbol in black circle. Decrease business graph vectors Uptrend and downtrend business chart icon. Economic growth and decline arrow symbol in black circle
Free with trial Multiple Downward Arrows Showing Declining Trend, Business Loss Concept with Gradient Arrows on White Background. Decrease business graph vectors Multiple Downward Arrows Showing Declining Trend, Business Loss Concept
Free with trial Economic crisis recession financial downturn concept sad person sitting near falling graph stacks of documents world map background Vector illustration. Decrease business graph vectors Economic crisis recession financial downturn concept sad person sitting near falling graph stacks of documents world map
Free with trial Intersecting colorful lines trending up and down across a graph illustrate weekly progress from monday to sunday, capturing fluctuations in performance over time. Decrease business graph vectors Intersecting colorful lines trending up and down across a graph illustrate weekly progress from monday to sunday
Free with trial Stylized gradient bar graph with downward arrow inside a square. Represents financial loss and economic decline with flat design. Decrease business graph vectors Decreasing graph icon representing financial loss or economic decline. Stylized gradient bar graph with downward arrow inside a square. Represents financial loss and economic decline with flat design.
Free with trial Colorful bar charts are presenting statistical trends and business performance data across different time periods. Possibly days of the week. Using a vibrant color scheme of blue. Purple. And orange. Decrease business graph vectors Colorful bar charts are presenting statistical trends and business performance data across different time periods
Free with trial Stock market crash graph line icon with color down arrow, vector economic crisis, finance and business recession. Outline laptop screen with financial chart of declining stock prices, bankruptcy. Decrease business graph vectors Stock market crash line icon, economic crisis. Stock market crash graph line icon with color down arrow, vector economic crisis, finance and business recession. Outline laptop screen with financial chart of declining stock prices, bankruptcy
Free with trial A graphic illustration featuring a black jagged downward-pointing arrow overlapping a black Indian Rupee symbol and a decreasing line graph on a white background, symbolizing financial loss, market crash, and currency depreciation. Decrease business graph illustrations Black Downward Arrow with Indian Rupee Symbol and Declining Line Graph. A graphic illustration featuring a black jagged downward-pointing arrow overlapping a black Indian Rupee symbol and a decreasing line graph on a white background, symbolizing financial loss, market crash, and currency depreciation.
Free with trial Zigzag downward arrow representing financial loss, market decline, and negative business performance. Ideal for economic reports and risk analysis. Decrease business graph vectors Zigzag Down Arrow Business Decline Financial Loss Concept Illustration. Zigzag downward arrow representing financial loss, market decline, and negative business performance. Ideal for economic reports and risk analysis.
Free with trial Set line Mind map infographic, Financial growth decrease and icon. Vector. Decrease business graph illustrations Set line Mind map infographic, Financial growth decrease and icon. Vector
Free with trial Green graph with arrows and dollar sign on white background transparent background. Green graph with arrows and dollar sign on white background. Decrease business graph illustrations Green graph with arrows and dollar sign on white background transparent background. Green graph with arrows and dollar sign on white background
Free with trial Six simple line graphs showcase various data trends, including upward, downward, and fluctuating patterns. Each graph features key data points marked with letters. Decrease business graph illustrations Six Line Graph Charts Data Visualization, Trends, Growth, Analysis. Six simple line graphs showcase various data trends, including upward, downward, and fluctuating patterns. Each graph features key data points marked with letters
Free with trial Red downward arrow symbolizing financial loss, market decline, and negative business trends. Ideal for risk and crisis visuals. Decrease business graph vectors Red Downward Arrow Financial Loss Business Decline Concept Illustration. Red downward arrow symbolizing financial loss, market decline, and negative business trends. Ideal for risk and crisis visuals.
Free with trial Arrow icon with percent symbol, economic growth, increase, decrease arrow, up and down arrow icon. Decrease business graph vectors Arrow icon with percent symbol, economic growth, increase, decrease arrow, up and down arrow icon
Free with trial Arrow icon with percent symbol, economic growth, increase, decrease arrow, up and down arrow icon. Decrease business graph vectors Arrow icon with percent symbol, economic growth, increase, decrease arrow, up and down arrow icon
Free with trial Business finance and growth icons illustrating statistics charts trends progress and success. Decrease business graph vectors Finance and growth icons showing progress and business performance blue navy. Business finance and growth icons illustrating statistics charts trends progress and success
Free with trial Percentage Decrease Bar Chart Icons for Financial Reports and Analytics vol 34492. Decrease business graph vectors Percentage Decrease Bar Chart Icons for Financial Reports and Analytics
Free with trial Business man with floating icon show uptrend of petrochemical industrial. Decrease business graph illustrations Business man with floating icon show uptrend of petrochemical industrial
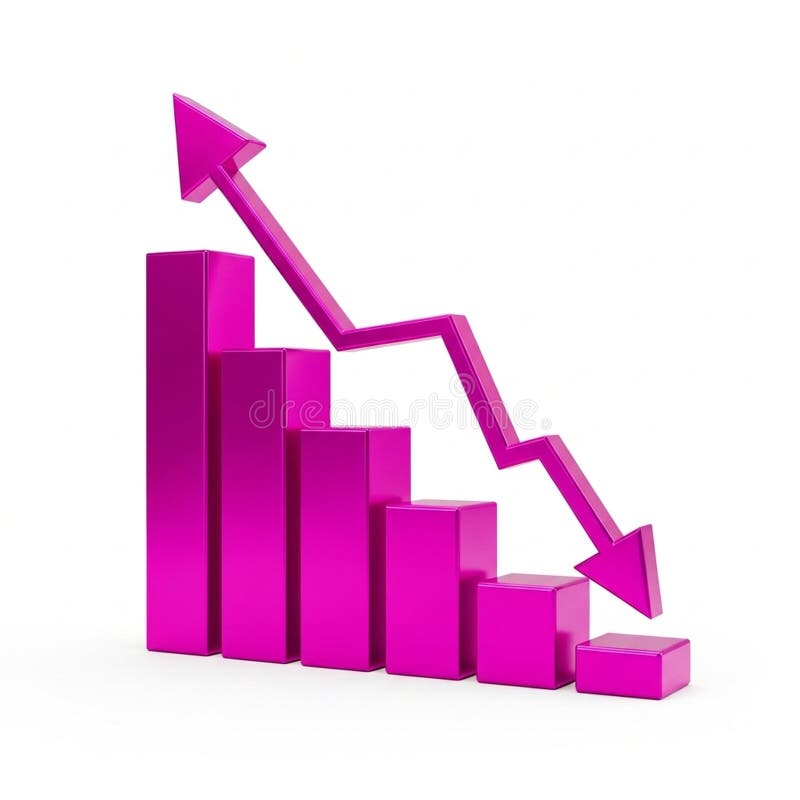
Free with trial A vibrant pink 3D bar chart illustrates financial data with a prominent downward-trending arrow superimposed. The bars decrease in height from left to right, signifying a decline. An upward-pointing arrow is positioned at the top left, indicating a contrasting upward trend. The graphic is isolated on a white background, making it suitable for presentations on financial performance, market trends,. Decrease business graph illustrations 3D Pink Bar Chart with Downward Trend Arrow and Upward Trend Arrow graph statistics. A vibrant pink 3D bar chart illustrates financial data with a prominent downward-trending arrow superimposed. The bars decrease in height from left to right, signifying a decline. An upward-pointing arrow is positioned at the top left, indicating a contrasting upward trend. The graphic is isolated on a white background, making it suitable for presentations on financial performance, market trends,
Free with trial This image features a collection of various financial and business growth icons. It includes symbols representing money, graphs, charts, and other financial metrics. The icons are colorful and designed to illustrate concepts such as investment, profit, growth, and financial planning. Decrease business graph illustrations Financial and business growth icons
Free with trial A simple and clean line graph icon illustration, perfect for illustrating financial data, growth charts, and statistical analysis. Ideal for use in presentations, reports, and websites. Decrease business graph vectors Minimalist Line Graph Icon Design for Financial Data Analysis Presentation. A simple and clean line graph icon illustration, perfect for illustrating financial data, growth charts, and statistical analysis. Ideal for use in presentations, reports, and websites.
Free with trial Building wooden bar graph with hand, representing growth and progress -. Decrease business graph illustrations Building wooden bar graph with hand, representing growth and progress
Free with trial Zigzag downward arrow representing financial loss, business decline, and negative market trends. Perfect for risk analysis, crisis reports, and economic downturn visuals. Decrease business graph vectors Downward Zigzag Arrow Business Decline Concept Financial Loss Illustration. Zigzag downward arrow representing financial loss, business decline, and negative market trends. Perfect for risk analysis, crisis reports, and economic downturn visuals.
Free with trial Abstract dotted financial graph chart sparkling background. Vector minimal tech design. Decrease business graph vectors Abstract dotted financial graph chart sparkling background
Free with trial Decreased freight traffic color line icon, vector economic crisis, business and finance recession, bankruptcy, international trade drop. Outline delivery truck with down arrow graph and import cargo. Decrease business graph vectors Decreased freight traffic line icon, cargo truck. Decreased freight traffic color line icon, vector economic crisis, business and finance recession, bankruptcy, international trade drop. Outline delivery truck with down arrow graph and import cargo
Free with trial Financial difficulties, decrease in value of business or company shares, stock market crash, economic crisis, business failure, loss of cash, lose investments, businessman running across the word crisis. Decrease business graph vectors Financial difficulties
Free with trial 3d render of stand holding tablet showing bright red descending graph, isolated on a transparent background. Decrease business graph vectors 3d render of stand holding tablet showing bright red descending graph
Free with trial Bankruptcy showing red 3d percentage symbol with downward arrow indicating decrease. Decrease business graph illustrations Red 3D Percentage Symbol with Downward Arrow Indicating Decrease
Free with trial A character lies defeated on a plunging red arrow over a financial chart, symbolizing a business failure, investment loss, or a market crash concept. Decrease business graph illustrations Business Failure and Financial Market Crash. A character lies defeated on a plunging red arrow over a financial chart, symbolizing a business failure, investment loss, or a market crash concept
Free with trial Computer monitor next to red error mark and downward graph. Ideal for themes of error, data analysis, poor performance, system failure, troubleshooting, warnings, technology issues. Simple flat. Decrease business graph vectors Computer screen with error mark and declining graph symbolizing technical issues or performance drop. Computer monitor next to red error mark and downward graph. Ideal for themes of error, data analysis, poor performance, system failure, troubleshooting, warnings, technology issues. Simple flat
Free with trial A 3D rendered bar chart illustrating a significant downward trend. Three blue, rounded bars are displayed on a clean white background with subtle grid lines. A prominent, bold red arrow sharply descends across the bars, clearly indicating a decline, decrease, or negative progression. This graphic is ideal for representing financial losses, market downturns, business challenges, economic recession, or any statistical data showing a negative trend. It conveys concepts of risk, failure, and reduction in a clear, impactful visual manner for presentations, reports, and analytical content. Decrease business graph vectors Downward Trend Bar Chart with Red Arrow. A 3D rendered bar chart illustrating a significant downward trend. Three blue, rounded bars are displayed on a clean white background with subtle grid lines. A prominent, bold red arrow sharply descends across the bars, clearly indicating a decline, decrease, or negative progression. This graphic is ideal for representing financial losses, market downturns, business challenges, economic recession, or any statistical data showing a negative trend. It conveys concepts of risk, failure, and reduction in a clear, impactful visual manner for presentations, reports, and analytical content.
Free with trial Bankruptcy and inflation business, man in depression. Vector of crisis finance bankruptcy, business economy inflation illustration. Decrease business graph vectors Bankruptcy and inflation business, man in depression
Free with trial This image displays a 3D bar graph with five vertical bars of decreasing height, rendered in a vibrant pink color. A pink line graph with a sharp downward trajectory originates from the top of the tallest bar and descends across the bars, ending at the base of the shortest bar. The entire composition is isolated on a clean white background, clearly illustrating a negative trend or decline. Decrease business graph illustrations A pink 3D bar graph with a descending line graph on a white background chart. This image displays a 3D bar graph with five vertical bars of decreasing height, rendered in a vibrant pink color. A pink line graph with a sharp downward trajectory originates from the top of the tallest bar and descends across the bars, ending at the base of the shortest bar. The entire composition is isolated on a clean white background, clearly illustrating a negative trend or decline
Free with trial A bold, three-dimensional red percentage symbol (%) is depicted against a clean white background. The symbol is stylized with a downward-pointing arrow integrated into its design, suggesting a decrease or reduction. This graphic is ideal for illustrating concepts related to discounts, sales, negative growth, financial losses, or declining trends in various business and economic contexts. Decrease business graph vectors Red Percentage Symbol with Downward Arrow. A bold, three-dimensional red percentage symbol (%) is depicted against a clean white background. The symbol is stylized with a downward-pointing arrow integrated into its design, suggesting a decrease or reduction. This graphic is ideal for illustrating concepts related to discounts, sales, negative growth, financial losses, or declining trends in various business and economic contexts.
Free with trial A bar graph displaying a downward trend with a large arrow pointing downwards, indicating a decline in values. Decrease business graph illustrations Decreasing bar graph with downward arrow. A bar graph displaying a downward trend with a large arrow pointing downwards, indicating a decline in values
Free with trial A 3D bar graph showing a downward trend with a red arrow indicating a decline. Decrease business graph illustrations Decreasing bar graph with downward trend. A 3D bar graph showing a downward trend with a red arrow indicating a decline
Free with trial Business balance, opportunity and development concept. Young businessman cartoon character standing and balancing in bar charts vector illustration. Decrease business graph vectors Business balance, opportunity and development concept
Free with trial A collection of five distinct black and white graphic representations of data. From left to right, the first is a line graph with dots, showing fluctuations. The second is a zig-zag line graph with dots and an upward arrow. The third is a series of ascending vertical bars. The fourth is a bar chart with a single dot above one of the bars. The fifth is a pie chart divided into four sections, with. Decrease business graph vectors Collection of black and white business and data charts and graphs statistics analytics. A collection of five distinct black and white graphic representations of data. From left to right, the first is a line graph with dots, showing fluctuations. The second is a zig-zag line graph with dots and an upward arrow. The third is a series of ascending vertical bars. The fourth is a bar chart with a single dot above one of the bars. The fifth is a pie chart divided into four sections, with
Free with trial Economic crisis icon of price decrease for oil barrel in global economy downturn, line vector. Stock exchange trade at world crisis with price index decrease in investments and financial recession. Decrease business graph vectors Economic crisis icon, price decrease of oil barrel. Economic crisis icon of price decrease for oil barrel in global economy downturn, line vector. Stock exchange trade at world crisis with price index decrease in investments and financial recession
Free with trial Financial problem color line icon with money and recession graph. Vector economic crisis, bankruptcy, money loss and poverty outline symbol with decline chart arrow, dollar currency bill and coins. Decrease business graph vectors Financial problem color line icon, money and graph. Financial problem color line icon with money and recession graph. Vector economic crisis, bankruptcy, money loss and poverty outline symbol with decline chart arrow, dollar currency bill and coins
Free with trial Rejection, negative feedback, failure, financial loss, poor performance, declining trends. Hand raised in stop gesture, sad face and declining bar graph. Rejection and negative feedback concept. Decrease business graph illustrations Hand Gesture with Sad Face and Declining Bar Graph Rejection, Negative Trends, or Failure Concepts. Rejection, negative feedback, failure, financial loss, poor performance, declining trends. Hand raised in stop gesture, sad face and declining bar graph. Rejection and negative feedback concept
Free with trial Economic crisis icon of price low down or stock market depreciation, vector line symbol. Global economy and business downturn with financial crisis and prices decrease or percent down low. Decrease business graph illustrations Economic crisis icon, price low down, stock market. Economic crisis icon of price low down or stock market depreciation, vector line symbol. Global economy and business downturn with financial crisis and prices decrease or percent down low
Free with trial A visual representation of an energy efficiency rating system is displayed on a white background. It consists of seven horizontal arrows, each labeled with a letter from A (green) at the top to G (red) at the bottom. The arrows decrease in size as they go down the scale, with intermediate colors like yellow and orange representing intermediate ratings. Decrease business graph illustrations Energy Efficiency Rating Chart with Colored Arrows from A to G graph. A visual representation of an energy efficiency rating system is displayed on a white background. It consists of seven horizontal arrows, each labeled with a letter from A (green) at the top to G (red) at the bottom. The arrows decrease in size as they go down the scale, with intermediate colors like yellow and orange representing intermediate ratings
Free with trial A 3D rendered image shows a large, red percentage symbol accompanied by a downward-pointing red arrow. This graphic represents a decrease in percentage, often used to illustrate concepts like price drops, discounts, interest rate reductions, or economic downturns. The simple, clean design with a neutral background makes it suitable for various business and financial contexts. Decrease business graph illustrations Red Percentage Drop. A 3D rendered image shows a large, red percentage symbol accompanied by a downward-pointing red arrow. This graphic represents a decrease in percentage, often used to illustrate concepts like price drops, discounts, interest rate reductions, or economic downturns. The simple, clean design with a neutral background makes it suitable for various business and financial contexts.
Free with trial Set line Financial growth decrease, Data analysis, and Server on black and white. Vector. Decrease business graph illustrations Set line Financial growth decrease, Data analysis, and Server on black and white. Vector
Free with trial Business charts, data visualization, financial analysis, progress tracking, statistics, graphs, analysis, charts bar in line, orange. Decrease business graph vectors Collection of diverse orange bar charts and line graph against a white background. Business charts, data visualization, financial analysis, progress tracking, statistics, graphs, analysis, charts bar in line, orange
Free with trial A 3D bar chart rendered in a vibrant pink color illustrates a significant downward trend. The bars decrease in height from left to right, culminating in a very short bar. A bold pink arrow, also in 3D, starts high on the left and sharply descends to the right, mirroring the decline shown by the bars. The entire graphic is isolated on a clean white background. Decrease business graph illustrations Pink 3D Bar Chart Showing a Downward Trend with an Arrow graph decline. A 3D bar chart rendered in a vibrant pink color illustrates a significant downward trend. The bars decrease in height from left to right, culminating in a very short bar. A bold pink arrow, also in 3D, starts high on the left and sharply descends to the right, mirroring the decline shown by the bars. The entire graphic is isolated on a clean white background
Free with trial A comprehensive collection of 12 modern, abstract vector icons designed for business, finance, and data analytics themes. This vibrant set features geometric shapes, upward-trending bar charts, risk indicators, decision-making prompts like "YES" and "NO," and numerical data representations. Perfect for enhancing presentations, reports, websites, mobile applications, and infographics, these versatile symbols convey concepts of growth, strategy, risk management, market analysis, and progress with a clean, contemporary aesthetic. Decrease business graph vectors Business and Data Analytics Abstract Icon Set. A comprehensive collection of 12 modern, abstract vector icons designed for business, finance, and data analytics themes. This vibrant set features geometric shapes, upward-trending bar charts, risk indicators, decision-making prompts like "YES" and "NO," and numerical data representations. Perfect for enhancing presentations, reports, websites, mobile applications, and infographics, these versatile symbols convey concepts of growth, strategy, risk management, market analysis, and progress with a clean, contemporary aesthetic.
Free with trial Set of circular dollar currency icons with up and down arrows representing profit, loss, exchange and rate changes flat and glyph styles in black, red and green for business and finance use. Decrease business graph vectors Money Currency Icons With Up And Down Arrows Showing Increase And Decrease Financial Trends. Set of circular dollar currency icons with up and down arrows representing profit, loss, exchange and rate changes flat and glyph styles in black, red and green for business and finance use.
Free with trial Growth and decline chart icon in flat design. Business trend arrow symbol illustration. Profit and loss concept. Decrease business graph vectors Growth and decline chart icon in flat design. Business trend arrow symbol. Profit and loss concept
Free with trial A 3D bar graph shows a downward trend in sales, accompanied by a sale ribbon and a gold coin. Decrease business graph illustrations Declining sales graph with sale ribbon and coin. A 3D bar graph shows a downward trend in sales, accompanied by a sale ribbon and a gold coin
Free with trial Climate change, sustainability, carbon tracking, CO2 emissions reduction, environmental impact, data visualization. Line graph tracking data. Climate change and sustainability concepts. Decrease business graph vectors Carbon Footprint Reduction Concept with Line Graph, CO2 Symbol, and Decreasing Temperature Indicator. Climate change, sustainability, carbon tracking, CO2 emissions reduction, environmental impact, data visualization. Line graph tracking data. Climate change and sustainability concepts
Free with trial A stark red arrow plunges downwards across a blue bar graph, visually representing a significant economic downturn or loss. Decrease business graph illustrations Red arrow graph showing sharp financial decline. A stark red arrow plunges downwards across a blue bar graph, visually representing a significant economic downturn or loss
Free with trial A clean, minimalist 3D bar chart made of translucent blue blocks illustrates a steady decline. This powerful visual represents concepts like economic downturn, financial recession, reduced sales, or negative performance data, making it ideal for business reports and presentations. Decrease business graph illustrations Economic Downturn Concept with Blue Bar Graph. A clean, minimalist 3D bar chart made of translucent blue blocks illustrates a steady decline. This powerful visual represents concepts like economic downturn, financial recession, reduced sales, or negative performance data, making it ideal for business reports and presentations
Free with trial A magnifying glass highlights glowing red business growth chart on dark background. Decrease business graph illustrations Magnifying glass highlights glowing red business growth chart on dark background
Free with trial A stark red arrow plunges downwards across a gray bar graph, symbolizing a significant financial or economic downturn. Decrease business graph illustrations Red arrow shows steep decline on gray bar graph. A stark red arrow plunges downwards across a gray bar graph, symbolizing a significant financial or economic downturn
Free with trial European Union trade war tariffs war economic downturn red declining graph chart yellow EU stars blue grid background financial crisis Vector illustration. Decrease business graph illustrations European Union trade war tariffs war economic downturn red declining graph chart yellow EU stars blue grid background
Free with trial Downward arrow graph on grid background symbolizing financial decline, loss, or negative performance. Ideal for business analytics and economic reports. Decrease business graph vectors Red downward trend arrow on grid background representing financial loss and decline. Downward arrow graph on grid background symbolizing financial decline, loss, or negative performance. Ideal for business analytics and economic reports
Free with trial A bar graph with a red downward arrow illustrates a decline in data over time. Decrease business graph illustrations Decline in bar graph indicates downward trend. A bar graph with a red downward arrow illustrates a decline in data over time
Free with trial Decline bar chart with downward trend arrow outline icon vector. Decrease, loss, and financial drop symbol in black circle. Decrease business graph vectors Decline bar chart with downward trend arrow outline icon. Decrease, loss, and financial drop symbol in black circle
Free with trial Global crisis economic downturn trade war concept businessman analyzing falling graph chart earth background modern website banner Vector illustration. Decrease business graph vectors Global crisis economic downturn trade war concept businessman analyzing falling graph chart earth background modern
Free with trial A minimalist vector icon illustrating market volatility and financial trends. The graphic features two distinct line graphs on a coordinate system: a jagged, highly fluctuating upper line representing high volatility, and a smoother lower line with marked points indicating a general trend. Up-down arrows and separate up down indicators further emphasize market movement and unpredictable changes. Ideal for financial reports, business presentations, data visualization, and economic analysis. Decrease business graph vectors Market Volatility and Financial Trend Graph Icon. A minimalist vector icon illustrating market volatility and financial trends. The graphic features two distinct line graphs on a coordinate system: a jagged, highly fluctuating upper line representing high volatility, and a smoother lower line with marked points indicating a general trend. Up-down arrows and separate up down indicators further emphasize market movement and unpredictable changes. Ideal for financial reports, business presentations, data visualization, and economic analysis.
Free with trial A simple and clear illustration depicting a downward trend. The image features a bar graph with decreasing values, indicated by bars of different heights. A prominent red arrow points downwards, visually emphasizing the negative trend. This graphic is suitable for representing financial losses, declining sales, economic downturns, or any concept of decrease. The clean design and use of color make it easily understandable and versatile for various applications. Decrease business graph vectors Downward Trend Chart with Red Arrow. A simple and clear illustration depicting a downward trend. The image features a bar graph with decreasing values, indicated by bars of different heights. A prominent red arrow points downwards, visually emphasizing the negative trend. This graphic is suitable for representing financial losses, declining sales, economic downturns, or any concept of decrease. The clean design and use of color make it easily understandable and versatile for various applications.
Free with trial A bright red arrow points diagonally downwards against a clean white background. The arrow is rendered with a slight 3D effect, casting a soft shadow beneath it, suggesting depth and movement. This universally recognized symbol represents decline, decrease, or a negative trend, making it ideal for financial, business, or data-related concepts. Decrease business graph illustrations Red Downward Arrow Symbol. A bright red arrow points diagonally downwards against a clean white background. The arrow is rendered with a slight 3D effect, casting a soft shadow beneath it, suggesting depth and movement. This universally recognized symbol represents decline, decrease, or a negative trend, making it ideal for financial, business, or data-related concepts.
Free with trial Concept of red arrow 8k digital technology against blurry background. Illustration for business decrease, loss, and failure with electronic circuit motherboard design. Decrease business graph illustrations Abstract red arrow 8k digital technology concept. Concept of red arrow 8k digital technology against blurry background. Illustration for business decrease, loss, and failure with electronic circuit motherboard design
Free with trial This 3D render depicts a stark red downward trend line superimposed over a grid background, with a bar chart showing declining values. The composition visually represents financial loss, economic downturn, market crash, or negative performance. The bold red color and sharp angles convey urgency and a sense of crisis, making it ideal for illustrating concepts related to business failure, stock market decline, or any situation involving a significant negative trajectory. Decrease business graph illustrations Red Downward Trend Graph with Bar Chart. This 3D render depicts a stark red downward trend line superimposed over a grid background, with a bar chart showing declining values. The composition visually represents financial loss, economic downturn, market crash, or negative performance. The bold red color and sharp angles convey urgency and a sense of crisis, making it ideal for illustrating concepts related to business failure, stock market decline, or any situation involving a significant negative trajectory.
Free with trial Set line Pie chart infographic, Financial growth decrease and Data analysis icon. Vector. Decrease business graph vectors Set line Pie chart infographic, Financial growth decrease and Data analysis icon. Vector
Free with trial Business arrow up success seamless pattern isolated on black background. Simple background. Decrease business graph vectors Business arrow up success seamless pattern isolated on black background
Free with trial Business arrow up success seamless pattern isolated on white background. Simple background. Decrease business graph vectors Business arrow up success seamless pattern isolated on white background
Free with trial An isolated graphic illustration featuring a red downward-trending jagged arrow overlapping an outlined Indian Rupee symbol and a decreasing line graph, symbolizing financial loss, market decline, and currency depreciation. Delivered with an alpha transparent background. Decrease business graph vectors Red Downward Arrow with Indian Rupee Symbol and Declining Line Graph Alpha Transparent. An isolated graphic illustration featuring a red downward-trending jagged arrow overlapping an outlined Indian Rupee symbol and a decreasing line graph, symbolizing financial loss, market decline, and currency depreciation. Delivered with an alpha transparent background.
Free with trial A stark white line graph depicts a significant downward trend with sharp fluctuations against a dark grid. Decrease business graph illustrations Sharp downward trend illustrated by a jagged white line graph on a black grid background. A stark white line graph depicts a significant downward trend with sharp fluctuations against a dark grid
Free with trial Set line Data analysis, Financial growth, Calculator, Folder and lock, decrease and icon. Vector. Decrease business graph illustrations Set line Data analysis, Financial growth, Calculator, Folder and lock, decrease and icon. Vector