Free with trial Set Sales funnel with chart, Financial growth decrease, Server and Calculator icon. Vector. Decrease business graph illustrations Set Sales funnel with chart, Financial growth decrease, Server and Calculator icon. Vector
Free with trial Data metallic style declining sales graph illustration report forecast, revenue market, performance downturn data metallic style declining sales graph. Decrease business graph illustrations Data metallic style declining sales graph
Free with trial Set Drop in crude oil price, Dollar rate decrease, and Global economic crisis on seamless pattern. Vector. Decrease business graph vectors Set Drop in crude oil price, Dollar rate decrease, and Global economic crisis on seamless pattern. Vector
Free with trial A comprehensive vector icon set featuring essential symbols for business, finance, and data analysis. This collection includes various arrows for indicating growth and decline, wavy lines representing market trends, checkmarks for success or approval, X marks for errors or rejection, stopwatches for time management and efficiency, and stacks of coins with dollar signs for financial concepts. Ideal for presentations, infographics, web design, and reports to visually communicate progress, status, and economic indicators. Decrease business graph vectors Business, Finance, and Data Analytics Vector Icon Set. A comprehensive vector icon set featuring essential symbols for business, finance, and data analysis. This collection includes various arrows for indicating growth and decline, wavy lines representing market trends, checkmarks for success or approval, X marks for errors or rejection, stopwatches for time management and efficiency, and stacks of coins with dollar signs for financial concepts. Ideal for presentations, infographics, web design, and reports to visually communicate progress, status, and economic indicators.
Free with trial A bar graph illustrating growth trends with notable peaks and valleys, highlighting significant increases and decreases over time. Decrease business graph illustrations Graph showing steady growth with peaks and valleys. A bar graph illustrating growth trends with notable peaks and valleys, highlighting significant increases and decreases over time
Free with trial A black icon depicts a bar graph with four ascending bars. An upward-trending curved arrow originates from the left and sweeps over the bars, indicating growth. A downward-pointing arrow is positioned below the bars on the right. The text "APERTURE F 1. 4 ISO 1600" is visible below the graphic. Decrease business graph illustrations Black Bar Graph with Upward Trending Arrow and Downward Arrow Icon chart statistics. A black icon depicts a bar graph with four ascending bars. An upward-trending curved arrow originates from the left and sweeps over the bars, indicating growth. A downward-pointing arrow is positioned below the bars on the right. The text "APERTURE F 1.4 ISO 1600" is visible below the graphic
Free with trial Percentage arrow. rate increase and decrease concept. Decrease business graph vectors Percentage arrow. rate increase and decrease concept.
Free with trial A close-up view of a red stock market chart displaying a strong downward trend. Candlestick bars and a fluctuating line graph indicate a significant decline in stock prices. Red arrows point downwards, emphasizing the negative movement. The background is dark with a subtle grid pattern and a bright light source on the left. Decrease business graph illustrations Red Stock Market Chart Showing Downward Trend graph. A close-up view of a red stock market chart displaying a strong downward trend. Candlestick bars and a fluctuating line graph indicate a significant decline in stock prices. Red arrows point downwards, emphasizing the negative movement. The background is dark with a subtle grid pattern and a bright light source on the left
Free with trial A shiny golden arrow forms a path that initially moves upward, then dips down, and finally turns upward again, presented in a 3D render against a clean white background. This abstract representation symbolizes financial growth, market fluctuations, and business progress. Decrease business graph illustrations Golden Arrow Graph Showing Upward Trend and Downturn on White Background chart. A shiny golden arrow forms a path that initially moves upward, then dips down, and finally turns upward again, presented in a 3D render against a clean white background. This abstract representation symbolizes financial growth, market fluctuations, and business progress
Free with trial This vector graphic depicts declining performance with a gear, descending graph, downward arrow, and a 24-hour clock. Decrease business graph illustrations Declining Performance Gear, Graph, Arrow, 24 Hours Icon. This vector graphic depicts declining performance with a gear, descending graph, downward arrow, and a 24-hour clock.
Free with trial A detailed red financial graph illustrates a sharp downward trend in stock prices. Candlestick bars and a wavy line graph show a significant decline, with red arrows reinforcing the negative movement. The dark background features a grid, and a bright light emanates from the left side of the image. Decrease business graph illustrations Red Financial Graph with Falling Stock Prices stock market. A detailed red financial graph illustrates a sharp downward trend in stock prices. Candlestick bars and a wavy line graph show a significant decline, with red arrows reinforcing the negative movement. The dark background features a grid, and a bright light emanates from the left side of the image
Free with trial Reduce costs concept, business and company to keep cost low, cut spending or expense deduction in budget plan, businessman breaking the graph cost. Decrease business graph vectors Reduce costs concept
Free with trial A 3D rendering of a bar chart featuring three colorful columns: blue, orange, and green, increasing in height from left to right. Two prominent red downward arrows are positioned above the tallest green bar, clearly indicating a decline, decrease, or negative trend. The minimalist design on a clean white background makes it ideal for illustrating business performance, financial reports, economic downturns, sales drops, or any data visualization requiring a clear representation of a negative change or warning. Perfect for presentations, infographics, and analytical content. Decrease business graph vectors 3D Bar Chart with Red Downward Arrows Showing Decline. A 3D rendering of a bar chart featuring three colorful columns: blue, orange, and green, increasing in height from left to right. Two prominent red downward arrows are positioned above the tallest green bar, clearly indicating a decline, decrease, or negative trend. The minimalist design on a clean white background makes it ideal for illustrating business performance, financial reports, economic downturns, sales drops, or any data visualization requiring a clear representation of a negative change or warning. Perfect for presentations, infographics, and analytical content.
Free with trial Set Isometric Financial growth decrease Data analysis and Pie chart infographic icon. Vector. Decrease business graph vectors Set Isometric Financial growth decrease, Data analysis and Pie chart infographic icon. Vector
Free with trial A 3D bar chart rendered in a vibrant pink color illustrates a downward trend. The bars decrease in height from left to right, representing a decline in data or performance. A thick pink arrow with a sharp point follows the descending path of the bars, reinforcing the concept of a decrease. The chart is presented in isolation against a clean white background, making the visual elements stand out. Decrease business graph illustrations Pink Bar Chart with a Downward Trending Arrow Symbolizing Decline graph magenta. A 3D bar chart rendered in a vibrant pink color illustrates a downward trend. The bars decrease in height from left to right, representing a decline in data or performance. A thick pink arrow with a sharp point follows the descending path of the bars, reinforcing the concept of a decrease. The chart is presented in isolation against a clean white background, making the visual elements stand out
Free with trial Graph going Up and Down sign with green and red arrows vector. Flat design vector illustration concept of sales bar chart symbol icon with arrow moving down and sales bar chart with arrow moving up. Decrease business graph illustrations Graph going Up and Down sign with green and red arrows vector. Flat design vector illustration concept of sales bar chart symbol. Graph going Up and Down sign with green and red arrows vector. Flat design vector illustration concept of sales bar chart symbol icon with arrow moving down and sales bar chart with arrow moving up.
Free with trial Sophisticated finance graph. Detailed chart Vector. Success failure symbol. Sophisticated growth reduction icon. EPS 10. Decrease business graph vectors Sophisticated finance graph. Detailed chart Vector. Success failure symbol. Sophisticated growth reduction icon.
Free with trial This dynamic digital artwork displays a vibrant abstract representation of a financial stock market trading chart. Featuring prominent candlestick bars in shades of orange and green, alongside a delicate line graph, it conveys concepts of market volatility, data analytics, and economic trends. Decrease business graph illustrations Abstract financial stock market graph with trading candlesticks and line chart, digital data visualization. This dynamic digital artwork displays a vibrant abstract representation of a financial stock market trading chart. Featuring prominent candlestick bars in shades of orange and green, alongside a delicate line graph, it conveys concepts of market volatility, data analytics, and economic trends.
Free with trial Falling bar chart with downward arrow representing business decline and financial problems. Ideal for risk, loss, and economic downturn concepts. Decrease business graph vectors Business decline chart downward trend problem failure vector silhouette illustration design. Falling bar chart with downward arrow representing business decline and financial problems. Ideal for risk, loss, and economic downturn concepts
Free with trial Declining business graph. Financial crisis chart. Negative market trend. Black and white economic vector icons. Decrease business graph vectors Financial loss bar chart icon set with falling arrow and dollar sign for economic recession. Declining business graph. Financial crisis chart. Negative market trend. Black and white economic vector icons
Free with trial Declining business graph. Financial crisis chart. Negative market trend. Black and white economic vector icons. Decrease business graph illustrations Financial loss bar chart icon set with falling arrow and dollar sign for economic recession. Declining business graph. Financial crisis chart. Negative market trend. Black and white economic vector icons.
Free with trial Set line Shopping cart and dollar Piggy bank with coin and Financial growth decrease icon. Vector. Decrease business graph illustrations Set line Shopping cart and dollar, Piggy bank with coin and Financial growth decrease icon. Vector
Free with trial Set Isometric Global economic crisis, Dollar rate decrease, Contract money and pen and icon. Vector. Decrease business graph vectors Set Isometric Global economic crisis, Dollar rate decrease, Contract money and pen and icon. Vector
Free with trial This graphic depicts supply and demand curves balanced by a scale, illustrating economic principles and market equilibrium. It's suitable for business presentations and educational materials. Decrease business graph vectors Supply and demand graph with balance scale illustration. This graphic depicts supply and demand curves balanced by a scale, illustrating economic principles and market equilibrium. It's suitable for business presentations and educational materials
Free with trial Set line Location, Financial growth decrease, Old hourglass with sand and increase icon. Vector. Decrease business graph illustrations Set line Location, Financial growth decrease, Old hourglass with sand and increase icon. Vector
Free with trial Pop art Financial growth decrease icon isolated on color background. Increasing revenue. Vector. Decrease business graph vectors Pop art Financial growth decrease icon isolated on color background. Increasing revenue. Vector
Free with trial A circular golden coin with a black glossy face. On the black surface, a golden bar graph shows a downward trend, with the bars decreasing in height from left to right. A golden arrow points downwards, emphasizing the decline. The coin is isolated on a white background. Decrease business graph illustrations Golden Coin with Black Background Featuring a Falling Bar Graph and Downward Arrow falling graph. A circular golden coin with a black glossy face. On the black surface, a golden bar graph shows a downward trend, with the bars decreasing in height from left to right. A golden arrow points downwards, emphasizing the decline. The coin is isolated on a white background
Free with trial Corn price going down decrease cheaper in commodity market international trading market vector. Decrease business graph vectors Corn price going down decrease cheaper in commodity market international trading market
Free with trial A dynamic digital illustration of a financial chart on a dark, high-tech background. The image features two contrasting lines: a vibrant green line trending upwards with an arrow, symbolizing growth, profit, and success, and a blue line moving downwards with an arrow, representing decline, loss, and risk. Glowing data points and a network grid enhance the futuristic feel. This versatile graphic is perfect for concepts related to stock market analysis, business performance, investment volatility, economic forecasting, big data, and financial technology (fintech). Decrease business graph illustrations Futuristic Financial Graph with Growth and Decline Arrows. A dynamic digital illustration of a financial chart on a dark, high-tech background. The image features two contrasting lines: a vibrant green line trending upwards with an arrow, symbolizing growth, profit, and success, and a blue line moving downwards with an arrow, representing decline, loss, and risk. Glowing data points and a network grid enhance the futuristic feel. This versatile graphic is perfect for concepts related to stock market analysis, business performance, investment volatility, economic forecasting, big data, and financial technology (fintech).
Free with trial A 3D illustration of a financial chart showing a dramatic downward trend. A large red arrow points sharply down over a series of declining blue bar graphs, symbolizing a stock market crash, economic recession, or business failure. The background features complex data and grids, representing financial analysis and market data. This image is perfect for concepts related to economic crisis, investment loss, financial risk, bankruptcy, and negative business reports. Decrease business graph illustrations Stock Market Crash Financial Graph. A 3D illustration of a financial chart showing a dramatic downward trend. A large red arrow points sharply down over a series of declining blue bar graphs, symbolizing a stock market crash, economic recession, or business failure. The background features complex data and grids, representing financial analysis and market data. This image is perfect for concepts related to economic crisis, investment loss, financial risk, bankruptcy, and negative business reports.
Free with trial A black and white line drawing depicts a magnifying glass focusing on a gear, a descending bar graph, and a. Decrease business graph illustrations Decline Analysis Magnifying Glass, Gear, and Downward Graph. A black and white line drawing depicts a magnifying glass focusing on a gear, a descending bar graph, and a.
Free with trial A simple line drawing depicts a declining bar graph with an arrow pointing downwards, all viewed through a magnifying. Decrease business graph illustrations Declining Graph Under Magnifying Glass Loss Analysis Icon. A simple line drawing depicts a declining bar graph with an arrow pointing downwards, all viewed through a magnifying.
Free with trial A digital representation of a blue line graph showing a significant downward trend with fluctuations against a dark grid. Decrease business graph illustrations Abstract blue line graph depicting a sharp decline and volatile trend on a black grid background. A digital representation of a blue line graph showing a significant downward trend with fluctuations against a dark grid
Free with trial Set line Search cloud computing, Financial growth decrease and Pie chart infographic icon. Vector. Decrease business graph vectors Set line Search cloud computing, Financial growth decrease and Pie chart infographic icon. Vector
Free with trial A green arrow graph displaying a sharp decline, indicating a downward trend. Decrease business graph vectors Green arrow decline graph showing downward trend. A green arrow graph displaying a sharp decline, indicating a downward trend.
Free with trial A stark red arrow graph descends sharply, symbolizing a significant downturn or loss, set against a minimalist blue backdrop. Decrease business graph illustrations Red arrow graph shows steep decline against blue background. A stark red arrow graph descends sharply, symbolizing a significant downturn or loss, set against a minimalist blue backdrop
Free with trial Coffee bean price commodity market low going down production decrease global trade vector. Decrease business graph vectors Coffee bean price commodity market low going down production decrease global trade
Free with trial A 3D cartoon illustration depicts a stylized hand in a black suit jacket and white shirt cuff pointing its index finger downwards towards a red bar graph. The bar graph features several vertical bars of varying heights and colors, including green, yellow, orange, and red, arranged in a descending order from left to right, visually representing a decline. The entire graphic is presented on a clean. Decrease business graph illustrations 3D Cartoon Hand Pointing Down at Declining Bar Graph on White Background image photo. A 3D cartoon illustration depicts a stylized hand in a black suit jacket and white shirt cuff pointing its index finger downwards towards a red bar graph. The bar graph features several vertical bars of varying heights and colors, including green, yellow, orange, and red, arranged in a descending order from left to right, visually representing a decline. The entire graphic is presented on a clean
Free with trial A simple and bold icon illustration of a bar graph. This can be used to represent data, statistics, growth, or trends. The icon is designed in a clean and minimalist style, making it versatile for various applications. Decrease business graph vectors Simple Bold Bar Graph Sign Shape Icon for Data Presentation. A simple and bold icon illustration of a bar graph. This can be used to represent data, statistics, growth, or trends. The icon is designed in a clean and minimalist style, making it versatile for various applications.
Free with trial Data analytics dashboard illustrating a mix of line graphs, bar charts, and data summaries, representing business growth, financial trends, and statistical insights for market analysis. Decrease business graph vectors Data analytics dashboard showing business growth and decline. Data analytics dashboard illustrating a mix of line graphs, bar charts, and data summaries, representing business growth, financial trends, and statistical insights for market analysis
Free with trial Set of alpha transparent business and finance icons drawn in white chalk, illustrating net asset value rising and falling alongside a market chart and Indian currency notation. Decrease business graph vectors Sketch of mutual fund NAV increase and decrease icons with Indian rupee symbol alpha transparent. Set of alpha transparent business and finance icons drawn in white chalk, illustrating net asset value rising and falling alongside a market chart and Indian currency notation.
Free with trial A graph shows a sharp decline in the value of the euro currency, symbolized by the euro sign surrounded by stars. Decrease business graph illustrations Euro Currency Value Decreasing Graph. A graph shows a sharp decline in the value of the euro currency, symbolized by the euro sign surrounded by stars
Free with trial Graph Declining with Arrow Line Art Minimalist Representation. Decrease business graph vectors Graph Declining with Arrow Line Art Minimalist Representation
Free with trial Interest rate going down decrease cost of fund and inflation money market percentage vector. Decrease business graph illustrations Interest rate going down decrease cost of fund and inflation money market percentage
Free with trial A 3D rendered graphic depicts a simplified bar chart with pastel colored bars in pink, yellow, and blue. A line graph with white lines and orange and yellow nodes crosses diagonally above the bars. The elements are set against a light blue background with a light tan border, all isolated on a white background. Decrease business graph vectors 3 D cartoon bar chart with line graph on blue background data. A 3D rendered graphic depicts a simplified bar chart with pastel colored bars in pink, yellow, and blue. A line graph with white lines and orange and yellow nodes crosses diagonally above the bars. The elements are set against a light blue background with a light tan border, all isolated on a white background
Free with trial 3D yellow arrow graph descending sharply on a teal blue background, representing financial loss or negative trend. Decrease business graph illustrations 3D yellow arrow graph descending sharply on a teal blue background, representing financial loss or negative trend
Free with trial Doodle Graph icon. Blue pen hand drawn infographic symbol on a notepaper piece. Line art style graphic design element. Web button with shadow. Decline, save on expences concept. Decrease business graph vectors Doodle Graph icon
Free with trial Orange bar chart with downward arrow vector illustration. Financial loss, economic recession, market crash, business failure, negative growth, data analysis. Declining graph with falling trend. Decrease business graph vectors Decreasing bar chart with downward arrow showing financial loss and economic recession vector illustration. Orange bar chart with downward arrow vector illustration. Financial loss, economic recession, market crash, business failure, negative growth, data analysis. Declining graph with falling trend
Free with trial A dollar bill connected to a bar graph resembling a sound wave with an arrow. Clear details and vibrant colors. Decrease business graph illustrations Dollar Bill and Sound Wave Bar Graph with Arrow money finance. A dollar bill connected to a bar graph resembling a sound wave with an arrow. Clear details and vibrant colors
Free with trial Rice grain price going down decrease cheaper in commodity market international trading market vector. Decrease business graph illustrations Rice grain price going down decrease cheaper in commodity market international trading market
Free with trial A simple line art icon of a decreasing bar chart with a trend arrow, representing negative growth or loss in business. Decrease business graph vectors Line Art Outline Decreasing Bar Chart Trend Arrow Business Icon. A simple line art icon of a decreasing bar chart with a trend arrow, representing negative growth or loss in business.
Free with trial A blue holographic graph showing a downward trend with bars and a line chart is projected over a dark conference table and chairs. Decrease business graph illustrations Holographic graph displaying insurance reimbursement delays over a conference table chart. A blue holographic graph showing a downward trend with bars and a line chart is projected over a dark conference table and chairs
Free with trial This image presents a detailed analysis of business performance metrics, including market share, quarterly sales, and key performance indicators (KPIs. Decrease business graph illustrations Comprehensive business performance metrics and growth analysis. This image presents a detailed analysis of business performance metrics, including market share, quarterly sales, and key performance indicators (KPIs
Free with trial A vibrant, pixelated pink arrow points downwards, set against a dark, textured background with subtle horizontal grey lines. This retro 8-bit style graphic symbolizes decrease, decline, download, or a negative trend. Ideal for illustrating financial data, market downturns, digital alerts, gaming interfaces, or any concept requiring a clear downward direction indicator. Its bold color and distinct pixel art aesthetic make it a versatile design element for technology, business, or creative projects. Decrease business graph illustrations Pixel Art Down Arrow on Dark Background. A vibrant, pixelated pink arrow points downwards, set against a dark, textured background with subtle horizontal grey lines. This retro 8-bit style graphic symbolizes decrease, decline, download, or a negative trend. Ideal for illustrating financial data, market downturns, digital alerts, gaming interfaces, or any concept requiring a clear downward direction indicator. Its bold color and distinct pixel art aesthetic make it a versatile design element for technology, business, or creative projects.
Free with trial An artistic creation that reflects beauty in simplicity. The design highlights precision, clean details, and a harmonious flow, resulting in a versatile and professional visual outcome. Decrease business graph vectors Business lion Presenting bar graph chart. An artistic creation that reflects beauty in simplicity. The design highlights precision, clean details, and a harmonious flow, resulting in a versatile and professional visual outcome
Free with trial Professional business man holding pie chart showing negative trend with loss. Economic crisis, recession, market crash, financial planning. Decrease business graph illustrations Business man holding pie chart showing negative trend with loss
Free with trial A black graph displays a downward curving line within a rectangular frame. Clear details and vibrant colors en. Decrease business graph illustrations Black graph showing a downward curve within a frame chart decline. A black graph displays a downward curving line within a rectangular frame. Clear details and vibrant colors en
Free with trial Dollar price up and down icon in outline style. Dollar coin graph up and down symbol. Money cost arrow growth, decline. Currency investment. Up and down dollar arrow. illustration. Decrease business graph vectors Dollar price up and down icon in outline style. Dollar coin graph up and down symbol. Money cost arrow growth, decline. Currency. Investment. Up and down dollar
Free with trial A series of golden, metallic bars are arranged in a descending order, forming a bar chart that clearly illustrates a downward trend. The bars decrease in height from left to right, with the leftmost bar being the tallest and the rightmost bar being the shortest and widest. The reflective golden surface of the bars catches the light, highlighting their three-dimensional form. The chart is presented. Decrease business graph illustrations Golden Bar Chart Showing A Downward Trend On A White Background graph financial. A series of golden, metallic bars are arranged in a descending order, forming a bar chart that clearly illustrates a downward trend. The bars decrease in height from left to right, with the leftmost bar being the tallest and the rightmost bar being the shortest and widest. The reflective golden surface of the bars catches the light, highlighting their three-dimensional form. The chart is presented
Free with trial A hand adjusting wooden blocks with cost letters and a graph showing a decrease in expenses, symbolizing effective financial management and planning. Decrease business graph illustrations Controlling expenses and managing costs with strategic planning. A hand adjusting wooden blocks with cost letters and a graph showing a decrease in expenses, symbolizing effective financial management and planning
Free with trial Arrow Direction and Percentage Icons for Business Growth Concept. Decrease business graph illustrations Arrow Direction and Percentage Icons for Business Growth Concept
Free with trial A 3D rendered icon depicting a blue document with a raised bar graph. The bar graph features alternating blue, orange, and yellow bars of varying heights. White lines and a circular orange and white element are also present on the blue document surface. The icon is isolated on a white background. Decrease business graph vectors 3 D blue document icon with orange and blue bar graph and white lines image. A 3D rendered icon depicting a blue document with a raised bar graph. The bar graph features alternating blue, orange, and yellow bars of varying heights. White lines and a circular orange and white element are also present on the blue document surface. The icon is isolated on a white background
Free with trial A 3D rendered red bar chart and line graph show a downward trend against a white grid background. The graph reflects a decline with a red arrow pointing down. Decrease business graph illustrations Red downward trending bar chart and line graph on white grid image. A 3D rendered red bar chart and line graph show a downward trend against a white grid background. The graph reflects a decline with a red arrow pointing down
Free with trial Blue bar chart with a black arrow bouncing backward vector illustration. Economic recession, financial loss, market crash, business failure, negative growth, setback. Data graph with falling pointer. Decrease business graph vectors Financial bar chart with a bouncing arrow pointing down economic recession and market loss vector illustration. Blue bar chart with a black arrow bouncing backward vector illustration. Economic recession, financial loss, market crash, business failure, negative growth, setback. Data graph with falling pointer
Free with trial Black and white icon of a bar graph with a diagonal arrow indicating a sharp decline. Decrease business graph illustrations Falling bar graph with diagonal arrow showing sharp decline bar chart. Black and white icon of a bar graph with a diagonal arrow indicating a sharp decline
Free with trial Financial crisis, business bankruptcy, money loss, and economy collapse concepts. Vector of crisis financial, bankruptcy and recession illustration. Decrease business graph vectors Financial crisis, business bankruptcy, money loss, and economy collapse concepts
Free with trial Black line graph showing upward and downward trends with arrows on a white background. Decrease business graph illustrations Black line graph with upward and downward trends and arrows chart data. Black line graph showing upward and downward trends with arrows on a white background
Free with trial An isolated vector illustration featuring two prominent, stylized arrows on a clean white background. One arrow, colored in shades of red and pink, points diagonally upwards and to the right, symbolizing growth, increase, or positive trends. The other arrow, rendered in blue and cyan tones, points diagonally downwards and to the left, representing decline, decrease, or negative movement. Both arrows have a modern, slightly textured or sketchy appearance, making them ideal for infographics, business presentations, financial reports, or conceptual designs illustrating contrasting directions, market changes, or comparative data. Decrease business graph illustrations Growth and Decline Arrows with Sketchy Style. An isolated vector illustration featuring two prominent, stylized arrows on a clean white background. One arrow, colored in shades of red and pink, points diagonally upwards and to the right, symbolizing growth, increase, or positive trends. The other arrow, rendered in blue and cyan tones, points diagonally downwards and to the left, representing decline, decrease, or negative movement. Both arrows have a modern, slightly textured or sketchy appearance, making them ideal for infographics, business presentations, financial reports, or conceptual designs illustrating contrasting directions, market changes, or comparative data.
Free with trial Bear market business vector concept. Symbol of finance, downturn, trading. Minimal design eps10 illustration. Decrease business graph vectors Bear market business vector concept. Symbol of finance, downturn, trading. Minimal illustration
Free with trial Set line Financial growth decrease, Data analysis, Pie chart infographic, Server, Binary code, and icon. Vector. Decrease business graph illustrations Set line Financial growth decrease, Data analysis, Pie chart infographic, Server, Binary code, and icon. Vector
Free with trial Set line Pie chart infographic, Financial growth increase, decrease and Old hourglass with sand icon. Vector. Decrease business graph vectors Set line Pie chart infographic, Financial growth increase, decrease and Old hourglass with sand icon. Vector
Free with trial A striking 3D rendering depicts a significant financial market decline, symbolized by a bold red arrow sharply pointing downwards across a dark grey background. The scene includes a subtle line graph and bar charts in shades of red and grey, illustrating a negative trend in data. This image effectively conveys concepts of economic recession, stock market crash, business losses, and financial crisis. Ideal for articles, presentations, and reports discussing market downturns, investment risks, or economic challenges. Decrease business graph illustrations Financial Market Decline with Red Arrow Chart. A striking 3D rendering depicts a significant financial market decline, symbolized by a bold red arrow sharply pointing downwards across a dark grey background. The scene includes a subtle line graph and bar charts in shades of red and grey, illustrating a negative trend in data. This image effectively conveys concepts of economic recession, stock market crash, business losses, and financial crisis. Ideal for articles, presentations, and reports discussing market downturns, investment risks, or economic challenges.
Free with trial Green Financial growth decrease icon isolated on black background. Increasing revenue. Black square button. Vector. Decrease business graph vectors Green Financial growth decrease icon isolated on black background. Increasing revenue. Black square button. Vector
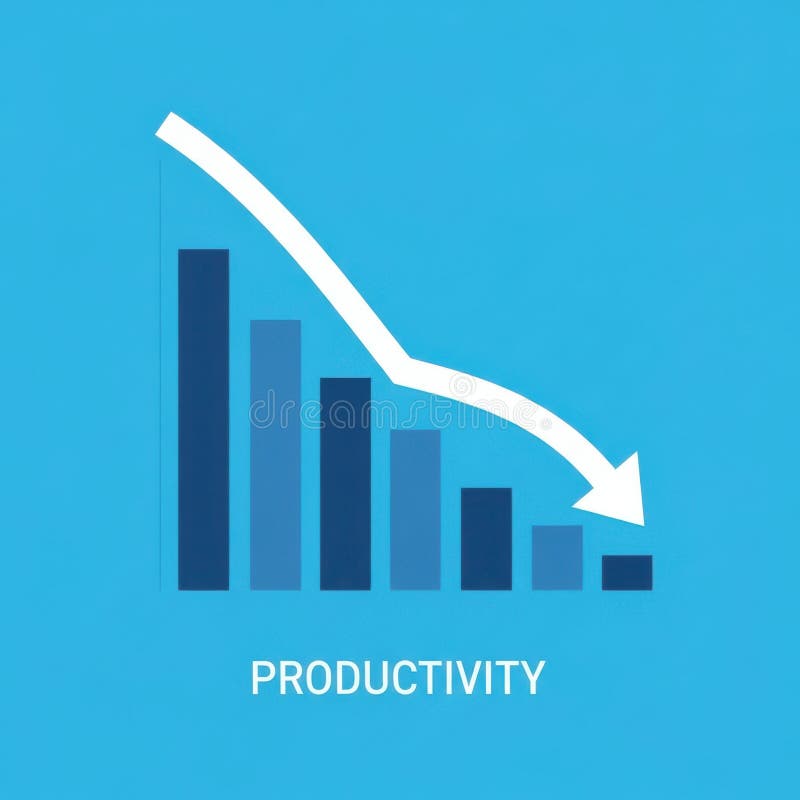
Free with trial A bar graph visually represents a downward trend in productivity over time, indicating a decline in efficiency or output. Decrease business graph illustrations Decreasing Productivity Graph Showing Decline. A bar graph visually represents a downward trend in productivity over time, indicating a decline in efficiency or output
Free with trial Pink Financial growth decrease icon isolated on pink background. Increasing revenue. Minimalism concept. 3D render illustration. Decrease business graph illustrations Pink Financial growth decrease icon isolated on pink background. Increasing revenue. Minimalism concept. 3D render
Free with trial This image features a minimalist and modern vector icon of a jagged downward trending line graph, sharply declining from left to right, symbolizing financial loss, economic downturn, or market decline, set against a clean and uncluttered white background suitable for use in presentations, reports, infographics, or digital media to visually communicate negative trends or decreasing performance. Decrease business graph illustrations Sharp downward trending line graph icon isolated on white background representing financial loss or market decline vector. This image features a minimalist and modern vector icon of a jagged downward trending line graph, sharply declining from left to right, symbolizing financial loss, economic downturn, or market decline, set against a clean and uncluttered white background suitable for use in presentations, reports, infographics, or digital media to visually communicate negative trends or decreasing performance
Free with trial A vibrant red arrow graph sharply declining against a dark, textured background, symbolizing a significant financial downturn or economic crisis. Decrease business graph illustrations Red downward arrow graph on dark background showing financial crisis. A vibrant red arrow graph sharply declining against a dark, textured background, symbolizing a significant financial downturn or economic crisis
Free with trial Percent Arrow Icons Set: Growth, Increase, Decrease Filled Up and Down Arrows. Decrease business graph vectors Percent Arrow Icons Set: Growth, Increase, Decrease Filled Up and Down Arrows
Free with trial Gold price going down decrease cheaper in golden metal commodity market international trading market vector. Decrease business graph illustrations Gold price going down decrease cheaper in golden metal commodity market international trading market
Free with trial A collection of nine simple black icons on a white background depicting concepts of decrease loss and downward trends using graphs charts and arrows. Decrease business graph vectors Set of black decline icons showing business failure and data reduction. A collection of nine simple black icons on a white background depicting concepts of decrease loss and downward trends using graphs charts and arrows