Free with trial Hammer breaking Piggy Bank, 3D rendering isolated on white background. Decrease crash illustrations Hammer breaking Piggy Bank, 3D rendering
Free with trial Speech bubble with a downward arrow and Bitcoin symbol indicates decreased value. Below, a simple landscape icon represents digital art or NFTs. Both elements are in black and white, highlighting financial and digital market themes. Decrease crash vectors NFT Prices Down. Speech bubble with a downward arrow and Bitcoin symbol indicates decreased value. Below, a simple landscape icon represents digital art or NFTs. Both elements are in black and white, highlighting financial and digital market themes.
Free with trial Impact of Pandemic on Business with People in Crisis Vector Set. Man and Woman Suffer Coronavirus Market Risk. Decrease crash vectors Impact of Pandemic on Business with People in Crisis Vector Set
Free with trial Stock exchange market trade bull vs bear concept vector. Decrease crash vectors Stock exchange market trade bull vs bear concept
Free with trial Line Global economic crisis icon isolated on white background. World finance crisis. Abstract banner with liquid shapes. Vector. Decrease crash illustrations Line Global economic crisis icon isolated on white background. World finance crisis. Abstract banner with liquid shapes
Free with trial Global finacial market tariffs ban symbol design vector. Decrease crash vectors Global finacial market tariffs ban symbol design
Free with trial International tariff trade war ban symbol in set vector. Decrease crash vectors International tariff trade war ban symbol in set
Free with trial Global market tariff trade war grungy background vector. Decrease crash vectors Global market tariff trade war grungy background
Free with trial Collapse stock market is seen by man invested money, standing near collapsing financial chart. Crisis in stock market and sharp stop in growth or beginning of decline in prices for stocks and bonds. Decrease crash vectors Collapse of stock market is seen by man invested money, standing near collapsing financial chart. Collapse stock market is seen by man invested money, standing near collapsing financial chart. Crisis in stock market and sharp stop in growth or beginning of decline in prices for stocks and bonds
Free with trial Set of economy trade war sign on white background vector. Decrease crash vectors Set of economy trade war sign on white background
Free with trial Global financial market tariff free grungy in set vector. Decrease crash vectors Global financial market tariff free grungy in set
Free with trial Global trade war economy crisis background design vector. Decrease crash vectors Global trade war economy crisis background design
Free with trial PhotoStock Pile of cardboard boxes with red arrow down, economic downturn concept Generative AI. Decrease crash illustrations PhotoStock Pile of cardboard boxes with red arrow down, economic downturn concept
Free with trial PhotoStock Pile of cardboard boxes with red arrow down, economic downturn concept Generative AI. Decrease crash illustrations PhotoStock Pile of cardboard boxes with red arrow down, economic downturn concept
Free with trial 3d bull vs bear stock market volatility background vector. Decrease crash vectors 3d bull vs bear stock market volatility background
Free with trial International trade war conflict background design vector. Decrease crash vectors International trade war conflict background design
Free with trial World economy decline trade war concept background vector. Decrease crash vectors World economy decline trade war concept background
Free with trial Tariff Sanction trade war rubber stamp label design vector. Decrease crash vectors Tariff Sanction trade war rubber stamp label design
Free with trial Statistics and analysis concept with bottom view on graphs and stats indicators on dark squared background. 3D rendering. Decrease crash illustrations Statistics and analysis concept
Free with trial International trade war economy downfall background vector. Decrease crash vectors International trade war economy downfall background
Free with trial Global economy trade war dispute concept background vector. Decrease crash vectors Global economy trade war dispute concept background
Free with trial Global economy decline trade war concept background vector. Decrease crash vectors Global economy decline trade war concept background
Free with trial A glowing red circuit board with a declining stock market graph, symbolizing challenges in the semiconductor and tech industry - AI-generated. Decrease crash illustrations A glowing red circuit board with a declining stock market graph, symbolizing challenges in the semiconductor and tech industry
Free with trial A glowing red circuit board with a declining stock market graph, symbolizing challenges in the semiconductor and tech industry - AI-generated. Decrease crash illustrations A glowing red circuit board with a declining stock market graph, symbolizing challenges in the semiconductor and tech industry
Free with trial Illustration of a red downward trend arrow with falling money on a dark red background. Concept of financial loss and stock market decline. 3D Rendering. Decrease crash illustrations Downward trend with falling money illustration. 3D Rendering. Illustration of a red downward trend arrow with falling money on a dark red background. Concept of financial loss and stock market decline. 3D Rendering
Free with trial Global trade war economic conflict background design vector. Decrease crash vectors Global trade war economic conflict background design
Free with trial Global financial crisis trade war concept background vector. Decrease crash vectors Global financial crisis trade war concept background
Free with trial Economic downturn shown with large red arrow pointing down, financial decline and recession graph concept. Decrease crash illustrations Economic downturn shown with large red arrow pointing down
Free with trial Global economy tariff ban conflict concept background vector. Decrease crash vectors Global economy tariff ban conflict concept background
Free with trial Businessman are sit down on a business graph. Chart in the fall. Business falling down. Negative trend. Crisis impact. economy going down. vector, illustration. Decrease crash illustrations Businessman are sit down on a business graph. Chart in the fall. Business falling down. Negative trend. Crisis impact. economy
Free with trial Recession concept. Falling market. The trading broker is horrified at the falling market. Financial graph down. Vector illustration isometric design. Decrease crash illustrations Recession concept. Falling market. Vector illustration isometric design. Recession concept. Falling market. The trading broker is horrified at the falling market. Financial graph down. Vector illustration isometric design.
Free with trial Recession concept. Falling market. The trading broker is horrified at the falling market. Financial graph down. Vector illustration isometric design. Decrease crash vectors Recession concept. Falling market. Vector illustration isometric design. Recession concept. Falling market. The trading broker is horrified at the falling market. Financial graph down. Vector illustration isometric design.
Free with trial Recession concept. Falling market. The trading broker is horrified at the falling market. Financial graph down. Vector illustration isometric design. Decrease crash vectors Recession concept. Falling market. Vector illustration isometric design. Recession concept. Falling market. The trading broker is horrified at the falling market. Financial graph down. Vector illustration isometric design.
Free with trial Global financial crisis trade war downfall graph design vector. Decrease crash vectors Global financial crisis trade war downfall graph design
Free with trial Glowing neon bullish vs bearish stock trading background vector. Decrease crash illustrations Glowing neon bullish vs bearish stock trading background
Free with trial International financial market tariff free sticker in set vector. Decrease crash vectors International financial market tariff free sticker in set
Free with trial Bullish growth vs bearish decline money trading background vector. Decrease crash vectors Bullish growth vs bearish decline money trading background
Free with trial Bearish vs bullish money trade strategy concept background vector. Decrease crash vectors Bearish vs bullish money trade strategy concept background
Free with trial Stock market or forex trading candlestick graph in graphic design for financial investment concept. Motion. Financial data and diagrams showing increase and decrease in profits. Decrease crash illustrations Stock market or forex trading candlestick graph in graphic design for financial investment concept. Motion. Financial
Free with trial Bull growth vs bear decline market trend concept background vector. Decrease crash vectors Bull growth vs bear decline market trend concept background
Free with trial Businessman in suit jumps between cliffs with red downward arrow on left and green upward arrow on right, symbolizing financial recovery and growth. Decrease crash illustrations Businessman jumping from financial decline to success. Businessman in suit jumps between cliffs with red downward arrow on left and green upward arrow on right, symbolizing financial recovery and growth
Free with trial This image depicts a global economic downturn using a visual representation. A large, white downward-pointing arrow dominates the scene, positioned over a grayscale world map. The map is overlaid on a dark red background, which further emphasizes the negative trend. Red bar graphs, scattered across the map, visually represent the economic decline in different regions, highlighting the severity of the situation. Numerical data points on the graph add to the visual impact and sense of decline. The overall effect creates a powerful and alarming visual metaphor for a worldwide economic crisis or recession. Decrease crash illustrations Global Economic Downturn Illustrated with World Map and Charts. This image depicts a global economic downturn using a visual representation. A large, white downward-pointing arrow dominates the scene, positioned over a grayscale world map. The map is overlaid on a dark red background, which further emphasizes the negative trend. Red bar graphs, scattered across the map, visually represent the economic decline in different regions, highlighting the severity of the situation. Numerical data points on the graph add to the visual impact and sense of decline. The overall effect creates a powerful and alarming visual metaphor for a worldwide economic crisis or recession.
Free with trial Business failure. Symbol of loss. Unsuccessful business investment. Businessman standing looking at a falling arrow graph. vector illustration flat. Decrease crash illustrations Business failure. Symbol of loss. Unsuccessful business investment
Free with trial Woman with economic slowdown. Young girl with falling graphs and diagrams. Recession and depression, banruptcy and crysis. Landing webpage design. Cartoon flat vector illustration. Decrease crash vectors Woman with economic slowdown vector. Woman with economic slowdown. Young girl with falling graphs and diagrams. Recession and depression, banruptcy and crysis. Landing webpage design. Cartoon flat vector illustration
Free with trial Global stock market bear vs bull volatility with dollar symbol vector. Decrease crash illustrations Global stock market bear vs bull volatility with dollar symbol
Free with trial Chat arrow down icon Vector set on white background. EPS 10. Decrease crash vectors Chart arrow down icon set. decline downward chart vector symbol. stock trend downturn graph sign. negative economy bar Chart. Chat arrow down icon Vector set on white background. EPS 10
Free with trial Flat bullish vs bearish upward downward market trend background vector. Decrease crash illustrations Flat bullish vs bearish upward downward market trend background
Free with trial Chat arrow down icon Vector set on white background. EPS 10. Decrease crash vectors Chart arrow down icon set. decline downward chart vector symbol. stock trend downturn graph sign. negative economy bar Chart. Chat arrow down icon Vector set on white background. EPS 10
Free with trial International trade war dispute concept background vector. Decrease crash vectors International trade war dispute concept background
Free with trial A vibrant red arrow points downward, resting on a silver coin, signifying a market decline. This 3D rendering, generated by AI, visually represents economic downturn or price reduction. Use it to illustrate concepts related to financial loss, market trends, and economic instability. Decrease crash illustrations Falling Prices. A vibrant red arrow points downward, resting on a silver coin, signifying a market decline. This 3D rendering, generated by AI, visually represents economic downturn or price reduction. Use it to illustrate concepts related to financial loss, market trends, and economic instability.
Free with trial Professional conceptual 3D render of a falling red financial graph on a dark background. The chart shows a sharp downward trend with a "CRISIS" tag at the lowest point, representing stock market failure, business bankruptcy, inflation, and economic downturn. Decrease crash illustrations Red line graph showing a sharp decline and economic crisis on a dark grid background. Professional conceptual 3D render of a falling red financial graph on a. Professional conceptual 3D render of a falling red financial graph on a dark background. The chart shows a sharp downward trend with a "CRISIS" tag at the lowest point, representing stock market failure, business bankruptcy, inflation, and economic downturn.
Free with trial Stock market bull vs bear volatility trade background vector. Decrease crash vectors Stock market bull vs bear volatility trade background
Free with trial Cartoon stickman drawing conceptual illustration of happy family with growing arrow, Generative AI illustrations. Decrease crash illustrations Cartoon stickman drawing conceptual illustration of happy family with growing arrow, Generative AI illustrations
Free with trial Rugged Ice big mountains. Winter sky snow. Generate Ai. Decrease crash illustrations Rugged Ice big mountains. Generate Ai. Rugged Ice big mountains. Winter sky snow. Generate Ai
Free with trial This image shows a 3D model of a bar graph, where one bar is falling, symbolizing decline or failure. This striking visual representation was generated by AI, offering a unique perspective on downward trends and economic instability. The clean design makes it ideal for illustrating various concepts. Decrease crash illustrations Falling Bar Graph. This image shows a 3D model of a bar graph, where one bar is falling, symbolizing decline or failure. This striking visual representation was generated by AI, offering a unique perspective on downward trends and economic instability. The clean design makes it ideal for illustrating various concepts
Free with trial Bullish profit vs bearish loss stock market trend concept background vector. Decrease crash vectors Bullish profit vs bearish loss stock market trend concept background
Free with trial Red down arrow with white house, 3d rendering. Decrease crash illustrations Red down arrow with white house
Free with trial Strategy for surviving economic crisis or recession, finding way out of business problems, maintaining financial position and cash during stock market crash, risky investments, man holds graph column. Decrease crash vectors Man holds graph column
Free with trial Chat arrow down icon Vector set on white background. EPS 10. Decrease crash vectors Chart arrow down icon set. decline downward chart vector symbol. stock trend downturn graph sign. negative economy bar Chart. Chat arrow down icon Vector set on white background. EPS 10
Free with trial Red arrow is pointing down over a cliff, representing failure and decline in business. 3D render. Decrease crash illustrations Red arrow pointing down over a cliff representing failure. Red arrow is pointing down over a cliff, representing failure and decline in business. 3D render
Free with trial Vector Illustration. Stock Price Fall. Arrow On Chart Pointing Down. Bear Head. Stock Market Concept. Decrease crash vectors Bear Market Icon Color. Vector Illustration. Stock Price Fall. Arrow On Chart Pointing Down. Bear Head. Stock Market Concept
Free with trial Majestic Ice big mountains. Winter sky snow. Generate Ai. Decrease crash illustrations Majestic Ice big mountains. Generate Ai. Majestic Ice big mountains. Winter sky snow. Generate Ai
Free with trial This image, generated by AI, depicts a downward trending graph inside a caged cube, symbolizing economic downturn. A jar of coins nearby further emphasizes the financial implications. The red arrow dramatically highlights the severity of the decline. Decrease crash illustrations Declining Economy: AI. This image, generated by AI, depicts a downward trending graph inside a caged cube, symbolizing economic downturn. A jar of coins nearby further emphasizes the financial implications. The red arrow dramatically highlights the severity of the decline.
Free with trial Colorful Searching for food in trash can on streets outdoors icon isolated on black background. Homelessness and poverty concept. Minimalism concept. 3D render illustration. Decrease crash illustrations Colorful Searching for food in trash can on streets outdoors icon isolated on black background. Homelessness and poverty
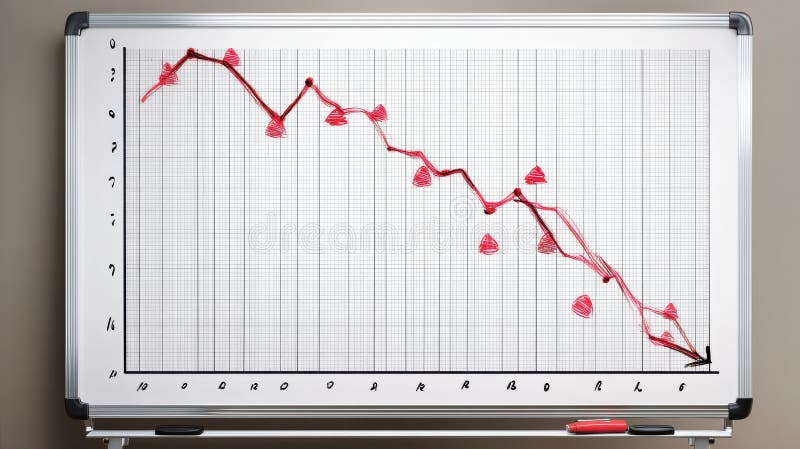
Free with trial A whiteboard displays a hand-drawn graph depicting a significant downward trend, marked by red triangles indicating decreasing values. This visual representation of a negative trend was generated by AI for illustrative purposes, possibly showcasing market decline or economic downturn. Decrease crash illustrations Downward Trend Graph. A whiteboard displays a hand-drawn graph depicting a significant downward trend, marked by red triangles indicating decreasing values. This visual representation of a negative trend was generated by AI for illustrative purposes, possibly showcasing market decline or economic downturn.
Free with trial This AI-generated image depicts a bar graph where the bars are covered in a melting, metallic substance, suggesting a market downturn. The dripping metal symbolizes loss and decline, generated by AI for visual representation. Decrease crash illustrations Melting Market Graph. This AI-generated image depicts a bar graph where the bars are covered in a melting, metallic substance, suggesting a market downturn. The dripping metal symbolizes loss and decline, generated by AI for visual representation.
Free with trial High-Quality Vector Icons. Decrease crash vectors Recession icon vector. High-Quality Vector Icons
Free with trial Downward zigzag arrow line icon vector on black circle. Decrease crash vectors Downward zigzag arrow line icon on black circle
Free with trial Analyzing the business failure and decline. White magnifying glass analyzing a growth chart on a blue background, representing market analysis and business growth. 3D render. Decrease crash illustrations Magnifying glass analyzing growth chart on blue background. Analyzing the business failure and decline. White magnifying glass analyzing a growth chart on a blue background, representing market analysis and business growth. 3D render
Free with trial Cartoon stickman drawing conceptual illustration of businessman standing on top of a graph, Generative AI illustrations. Decrease crash illustrations Cartoon stickman drawing conceptual illustration of businessman standing on top of a graph, Generative AI illustrations
Free with trial Analyzing causes of financial difficulties, finding survival strategy during economic crisis or market crash, team brainstorm to solve problems of declining business value, men near broken euro sign. Decrease crash vectors Men near broken euro sign
Free with trial Bearish red down arrows illustration selloff recession, loss panic, volatility plummet bearish red down arrows. Decrease crash illustrations Bearish red down arrows
Free with trial Formidable Ice big mountains. Winter sky snow. Generate Ai. Decrease crash illustrations Formidable Ice big mountains. Generate Ai. Formidable Ice big mountains. Winter sky snow. Generate Ai
Free with trial A 3D rendering shows a red arrow plummeting downwards, disintegrating into particles. This dramatic visualization, generated by AI, symbolizes market decline and financial instability. The image is perfect for illustrating economic downturns or similar concepts. Decrease crash illustrations Crumbling Market Trends. A 3D rendering shows a red arrow plummeting downwards, disintegrating into particles. This dramatic visualization, generated by AI, symbolizes market decline and financial instability. The image is perfect for illustrating economic downturns or similar concepts.
Free with trial A hand adds to a graph depicting a sharp decline in the global economy, shown as a cracked map. This AI-generated image symbolizes the fragility of the world's financial systems and the potential for widespread economic crisis. The red line emphasizes the severity of the downturn. Decrease crash illustrations Global Economic Decline. A hand adds to a graph depicting a sharp decline in the global economy, shown as a cracked map. This AI-generated image symbolizes the fragility of the world's financial systems and the potential for widespread economic crisis. The red line emphasizes the severity of the downturn.
Free with trial A minimalist bar chart with a descending line graph overlay, symbolizing financial loss, performance decline, or negative data trends. Ideal for presentations, dashboards, economic reports, and warning visuals. Decrease crash vectors Downward Trend Bar Chart Icon. A minimalist bar chart with a descending line graph overlay, symbolizing financial loss, performance decline, or negative data trends. Ideal for presentations, dashboards, economic reports, and warning visuals
Free with trial A stock market graph depicting a downturn is shown through a rain-covered window. The image, generated by AI, creates a mood of economic uncertainty and pessimism. The blurred background adds to the overall sense of ambiguity. Decrease crash illustrations Rainy Day Market Decline. A stock market graph depicting a downturn is shown through a rain-covered window. The image, generated by AI, creates a mood of economic uncertainty and pessimism. The blurred background adds to the overall sense of ambiguity.
Free with trial Financial and economic improvement during stock market crash, stabilizing value of foreign currency, rising incomes and wages, countering inflation, preserving savings, man protects euro from arrow. Decrease crash vectors Man protects euro from arrow
Free with trial This image shows a detailed close-up of a stock market graph depicting a significant decline. The red color emphasizes the negative trend, illustrating potential losses or economic downturn. This visualization was generated by AI for analysis and presentation purposes. Decrease crash illustrations Red Market Decline Graph. This image shows a detailed close-up of a stock market graph depicting a significant decline. The red color emphasizes the negative trend, illustrating potential losses or economic downturn. This visualization was generated by AI for analysis and presentation purposes.
Free with trial Illustrating the concept of wasting money with stylized flames above dollar bills. Decrease crash vectors Money burning a hole in your pocket. Illustrating the concept of wasting money with stylized flames above dollar bills