Free with trial Descending bar chart or graph on white background. Economic crisis, declining profit, recession and bankruptcy. 3d render. Decrease crash illustrations Descending bar chart or graph on white background
Free with trial Financial crisis, loss money and capital, sad man and economy loss, man concept failure, down graph, investment stock bankruptcy, problem fall, vector illustration. Decrease crash vectors Financial crisis, loss money and capital, sad man
Free with trial A 3D rendering depicts a green money bag with a dollar sign, symbolizing wealth or investment, positioned to the right. To its left, a jagged green arrow points downwards, indicating a decline or loss. The background is black, emphasizing the financial concept of a falling market or economic downturn. Decrease crash illustrations Falling Stock Market and Money Bag Icon. A 3D rendering depicts a green money bag with a dollar sign, symbolizing wealth or investment, positioned to the right. To its left, a jagged green arrow points downwards, indicating a decline or loss. The background is black, emphasizing the financial concept of a falling market or economic downturn
Free with trial The impact of a global economic meltdown on small businesses. Generative AI. Decrease crash illustrations The impact of a global economic meltdown on small businesses
Free with trial A 3D rendering depicts a scale with a dollar sign on one side, breaking apart and falling. The other side is empty, symbolizing financial instability or loss of value. The image is clean and minimalistic. Decrease crash illustrations Crumbling Dollar on Scales. A 3D rendering depicts a scale with a dollar sign on one side, breaking apart and falling. The other side is empty, symbolizing financial instability or loss of value. The image is clean and minimalistic.
Free with trial Financial and economic improvement during stock market crash, stabilizing value of foreign currency, rising incomes and wages, countering inflation, preserving savings, man protects dollar from arrow. Decrease crash vectors Man protects dollar from arrow
Free with trial A hand holds a piece of paper showing a sharply declining graph, representing a downturn in the market. The image is generated by AI and symbolizes financial loss or economic recession. Decrease crash illustrations Falling Stock Market Graph. A hand holds a piece of paper showing a sharply declining graph, representing a downturn in the market. The image is generated by AI and symbolizes financial loss or economic recession.
Free with trial Graph Down glyph vector icon isolated. Graph Down stock vector icon for web, mobile app and ui design. Decrease crash vectors Graph Down glyph vector icon
Free with trial Top view of hands using laptop with symbol of crisis concept. Decrease crash illustrations Concept of crisis. Top view of hands using laptop with symbol of crisis concept
Free with trial Conceptual image illustrating falling rent prices. A wooden house and the word 'RENT' constructed from blocks are shown falling from the sky, accompanied by scattered coins. A large red arrow points downwards, emphasizing the downward trend. In the background, a city skyline emerges from a sea of clouds, bathed in the warm light of a sunset or sunrise. This image can be used to represent economic downturns, housing market fluctuations, or financial challenges related to renting. Decrease crash illustrations Falling Rent Prices Concept. Conceptual image illustrating falling rent prices. A wooden house and the word 'RENT' constructed from blocks are shown falling from the sky, accompanied by scattered coins. A large red arrow points downwards, emphasizing the downward trend. In the background, a city skyline emerges from a sea of clouds, bathed in the warm light of a sunset or sunrise. This image can be used to represent economic downturns, housing market fluctuations, or financial challenges related to renting.
Free with trial This 3D rendering shows a circular arrangement of red arrows pointing downwards, illustrating a negative trend. The image is generated by AI and is perfect for representing concepts like market decline, economic downturn, or loss. Decrease crash illustrations Circular Red Downward Arrow. This 3D rendering shows a circular arrangement of red arrows pointing downwards, illustrating a negative trend. The image is generated by AI and is perfect for representing concepts like market decline, economic downturn, or loss.
Free with trial Colorful Searching for food in trash can on streets outdoors icon isolated on white background. Homelessness and poverty concept. Square button. 3D render illustration. Decrease crash illustrations Colorful Searching for food in trash can on streets outdoors icon isolated on white background. Homelessness and poverty
Free with trial A 3D red arrow pointing downwards in a zigzag pattern, symbolizing a decline or loss, isolated on a white background. Decrease crash illustrations Red downward trend arrow isolated on white background. A 3D red arrow pointing downwards in a zigzag pattern, symbolizing a decline or loss, isolated on a white background
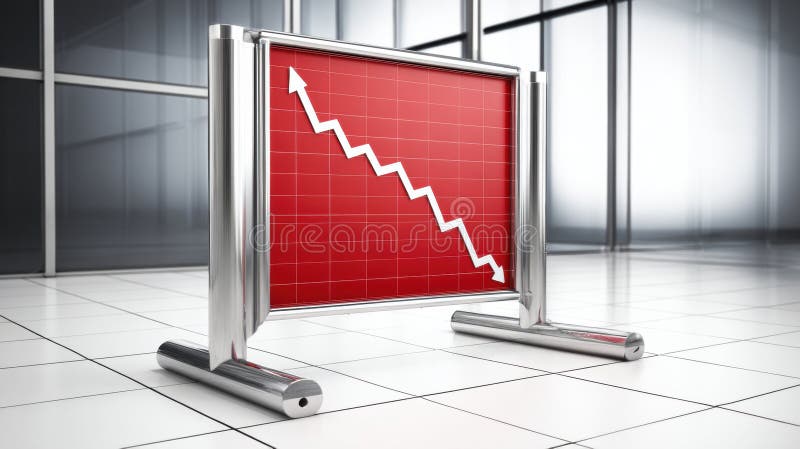
Free with trial This image shows a red graph displaying a downward trend, generated by AI. The graph is presented on a freestanding, metallic sign, suggesting a public display of economic or market data indicating a decline or downturn. The clean, modern setting adds to the professional feel, implying a serious fi. Decrease crash illustrations AI-Generated Declining Graph. This image shows a red graph displaying a downward trend, generated by AI. The graph is presented on a freestanding, metallic sign, suggesting a public display of economic or market data indicating a decline or downturn. The clean, modern setting adds to the professional feel, implying a serious fi
Free with trial Financial crisis concept with digital blue glowing downward candlestick on dark background with dots. 3D rendering. Decrease crash illustrations Financial crisis concept with digital blue glowing downward candlestick
Free with trial JPY currency on the display board with red arrow down, 3d rendering. Decrease crash illustrations JPY currency on the display board with red arrow down
Free with trial INR currency on the display board with red arrow down, 3d rendering. Decrease crash illustrations INR currency on the display board with red arrow down
Free with trial This image depicts a dramatic stock market decline, visualized as a falling graph in intense orange and red hues, generated by AI. The dark background emphasizes the severity of the downturn, suggesting potential financial instability or market volatility. The bokeh effect adds a sense of depth and. Decrease crash illustrations AI-Generated Stock Market Dip. This image depicts a dramatic stock market decline, visualized as a falling graph in intense orange and red hues, generated by AI. The dark background emphasizes the severity of the downturn, suggesting potential financial instability or market volatility. The bokeh effect adds a sense of depth and
Free with trial Red bar graph on a dark background depicts a downward trend, highlighted by a descending arrow. Accompanied by bold text reading "ECONOMIC CRISIS" at the bottom. The bars decrease in height from left to right, illustrating a decline, with strong visual emphasis through the use of a vibrant red against a muted backdrop. The style is straightforward and impactful, conveying a sense of financial downturn or economic challenges. Decrease crash illustrations Economic Crisis Chart with Declining Bar Graph and Arrow. Red bar graph on a dark background depicts a downward trend, highlighted by a descending arrow. Accompanied by bold text reading "ECONOMIC CRISIS" at the bottom. The bars decrease in height from left to right, illustrating a decline, with strong visual emphasis through the use of a vibrant red against a muted backdrop. The style is straightforward and impactful, conveying a sense of financial downturn or economic challenges.
Free with trial EUR currency on the display board with red arrow down, 3d rendering. Decrease crash illustrations EUR currency on the display board with red arrow down
Free with trial This image shows a red arrow sinking into clear water, creating a splash. The arrow, generated by AI, symbolizes a downward trend or decline, perhaps in market values or other metrics. The high-quality rendering emphasizes the impact and visual appeal. Decrease crash illustrations Red Arrow Plunging into Water. This image shows a red arrow sinking into clear water, creating a splash. The arrow, generated by AI, symbolizes a downward trend or decline, perhaps in market values or other metrics. The high-quality rendering emphasizes the impact and visual appeal.
Free with trial This image shows a 3D rendering of a red line graph sharply declining, resting on a white cube. The graphic is generated by AI, and visually represents a negative trend or downturn, suitable for presentations or reports on market analysis, economic forecasts, or business performance. Decrease crash illustrations Declining Trend Visualization. This image shows a 3D rendering of a red line graph sharply declining, resting on a white cube. The graphic is generated by AI, and visually represents a negative trend or downturn, suitable for presentations or reports on market analysis, economic forecasts, or business performance.
Free with trial Businessman in suit running off a breaking cliff with a red downward arrow, symbolizing financial crisis and market collapse, on cityscape background. Decrease crash illustrations Businessman running off a cliff with a red downward arrow in the background. Businessman in suit running off a breaking cliff with a red downward arrow, symbolizing financial crisis and market collapse, on cityscape background
Free with trial USD currency on the display board with red arrow down, 3d rendering. Decrease crash illustrations USD currency on the display board with red arrow down
Free with trial Financial and economic improvement during stock market crash, stabilization of foreign currency, financial instruments to increase income, fight against inflation, woman holding umbrella over dollar. Decrease crash vectors Woman holding umbrella over dollar
Free with trial Cartoon stickman drawing conceptual illustration of two happy businessmen standing on top of a chart, Generative AI illustrations. Decrease crash illustrations Cartoon stickman drawing conceptual illustration of two happy businessmen standing on top of a chart, Generative AI illustrations
Free with trial Downward zigzag arrow icon vector with long shadow. Decrease crash vectors Downward zigzag arrow icon with long shadow
Free with trial This image depicts a long line of miniature people following a downward trending stock market graph, generated by AI. It visually represents economic downturn and its impact on a large population. The contrast between the dense crowd and the falling graph is striking. Decrease crash illustrations People and Stock Market Decline. This image depicts a long line of miniature people following a downward trending stock market graph, generated by AI. It visually represents economic downturn and its impact on a large population. The contrast between the dense crowd and the falling graph is striking.
Free with trial Concept of financial crisis with big arrow pointing down near a stack of coins. Decrease crash vectors Big purple arrow pointing down near stack of coins. Concept of financial crisis with big arrow pointing down near a stack of coins
Free with trial Stacks of transparent glass coins depict a downward trend, generated by AI, symbolizing financial downturn or economic recession. The image uses a dark background to highlight the contrast between the fragility of the glass coins and the severity of the market decline. Decrease crash illustrations AI-Generated Glass Coin Decline. Stacks of transparent glass coins depict a downward trend, generated by AI, symbolizing financial downturn or economic recession. The image uses a dark background to highlight the contrast between the fragility of the glass coins and the severity of the market decline.
Free with trial A 3D render shows two gold coins and a red downward trending arrow on a black surface within an open beige case. The case is angled with the lid open, revealing a dark interior. The objects are rendered with a smooth, glossy finish against a clean white background. Decrease crash illustrations Gold coins red down arrow red arrow down trend. A 3D render shows two gold coins and a red downward trending arrow on a black surface within an open beige case. The case is angled with the lid open, revealing a dark interior. The objects are rendered with a smooth, glossy finish against a clean white background
Free with trial USD dollar value decline and devaluation. Bar graph made of holes in yellow paper is revealing us dollar banknotes of decreasing values. 3d render. Decrease crash illustrations Us dollar decreasing value concept with bar graph on yellow background. USD dollar value decline and devaluation. Bar graph made of holes in yellow paper is revealing us dollar banknotes of decreasing values. 3d render
Free with trial This image shows a 3D red arrow pointing downwards, disintegrating into cubes. It's a powerful visual representation of decline or failure, generated by AI, ideal for illustrating concepts like market crashes or economic downturns. Decrease crash illustrations Collapsing Red Arrow. This image shows a 3D red arrow pointing downwards, disintegrating into cubes. It's a powerful visual representation of decline or failure, generated by AI, ideal for illustrating concepts like market crashes or economic downturns.
Free with trial This image depicts a white pillar with a red downward trending arrow, generated by AI. It symbolizes economic decline, market instability, or a negative trend in a specific industry. The clean, minimalist style emphasizes the severity of the drop. Decrease crash illustrations Falling Market Trend. This image depicts a white pillar with a red downward trending arrow, generated by AI. It symbolizes economic decline, market instability, or a negative trend in a specific industry. The clean, minimalist style emphasizes the severity of the drop.
Free with trial Finance stock market crisis and chart arrow down red background. vector illustration fantastic technology. Decrease crash vectors Finance stock market crisis and chart arrow down red background.
Free with trial A minimalist vector icon representing a downturn in the housing market. Decrease crash vectors Real Estate Price Reduction Symbol. A minimalist vector icon representing a downturn in the housing market
Free with trial Decline red stock chart illustration drop bearish, selloff panic, plummet collapse decline red stock chart. Decrease crash illustrations Decline red stock chart
Free with trial Top view of hands using laptop with symbol of economic crisis concept. Decrease crash illustrations Concept of economic crisis. Top view of hands using laptop with symbol of economic crisis concept
Free with trial Wooden blocks with symbol of economic crisis concept on blue background. Decrease crash illustrations Concept of economic crisis. Wooden blocks with symbol of economic crisis concept on blue background
Free with trial Crashed coin doodle icon sketch vector. crashed coin sign. isolated symbol illustration. Decrease crash vectors Crashed coin icon doodle illustration. crashed coin doodle icon sketch vector. crashed coin sign. isolated symbol illustration
Free with trial This image depicts a 3D rendering of a downward trending graph, generated by AI, showcasing a clear visual representation of market decline or economic downturn. The red bars and arrow emphasize the severity of the fall, suggesting potential financial instability or crisis. Decrease crash illustrations Declining Market Trends. This image depicts a 3D rendering of a downward trending graph, generated by AI, showcasing a clear visual representation of market decline or economic downturn. The red bars and arrow emphasize the severity of the fall, suggesting potential financial instability or crisis.
Free with trial Strategy for surviving economic crisis, finding way out of business problems, maintaining financial position during stock market crash, risky investments, man tries not to fall from growing arrow. Decrease crash vectors Man tries not to fall from growing arrow
Free with trial This image depicts a downward trending graph, generated by AI, illustrating a sharp decline in market performance. The 3D rendered red arrow emphasizes the severity of the fall. It symbolizes economic downturn, financial crisis, or market instability. Decrease crash illustrations Declining Market Trends. This image depicts a downward trending graph, generated by AI, illustrating a sharp decline in market performance. The 3D rendered red arrow emphasizes the severity of the fall. It symbolizes economic downturn, financial crisis, or market instability.
Free with trial Concept of financial crisis with connected icons. Decrease crash illustrations Concept of financial crisis
Free with trial Concept of financial crisis with icons on hexagons. Decrease crash illustrations Concept of financial crisis
Free with trial Concept of financial crisis with icons on squares. Decrease crash illustrations Concept of financial crisis
Free with trial Concept of financial crisis. With icons on speech bubbles. Decrease crash illustrations Concept of financial crisis. With icons on speech bubbles
Free with trial A graph with a red arrow pointing upward. The graph is orange and blue. The graph is a representation of a trend or growth. Decrease crash vectors A graph with a red arrow pointing upward
Free with trial A worrying business report showing a sharp decline, generated by AI, rests on a wooden desk in an office setting. The red graph line dramatically falls, symbolizing potential losses or market downturn. This AI-generated image is perfect for illustrating financial instability or economic crisis. Decrease crash illustrations Declining Business Graph. A worrying business report showing a sharp decline, generated by AI, rests on a wooden desk in an office setting. The red graph line dramatically falls, symbolizing potential losses or market downturn. This AI-generated image is perfect for illustrating financial instability or economic crisis.
Free with trial Concept of economic collapse with connected icons. Decrease crash illustrations Concept of economic collapse
Free with trial Graph and arrow red stock marketing fall background. economy finance crisis low investment. Decrease crash vectors Graph and arrow red stock marketing fall background. economy finance
Free with trial Vector illustration of a red downward trend line graph showing economic crisis, financial loss, or business decline. Concept of recession, risk, and negative performance. Decrease crash vectors Downward trend red graph illustration. Vector illustration of a red downward trend line graph showing economic crisis, financial loss, or business decline. Concept of recession, risk, and negative performance.
Free with trial This image vividly illustrates the concept of inflation with banknotes cascading down from tall buildings, symbolizing the devaluation of currency and economic instability. The urban backdrop, with its towering structures, represents the financial sector and its vulnerability to market forces. Decrease crash illustrations Inflation: Money Falling from Buildings.. Generative Ai. This image vividly illustrates the concept of inflation with banknotes cascading down from tall buildings, symbolizing the devaluation of currency and economic instability. The urban backdrop, with its towering structures, represents the financial sector and its vulnerability to market forces
Free with trial A red down arrow alongside houses, symbolizing a falling real estate market, reduced prices, and a potential crisis in the housing industry. Decrease crash illustrations Red down arrow and houses. A red down arrow alongside houses, symbolizing a falling real estate market, reduced prices, and a potential crisis in the housing industry
Free with trial A red down arrow alongside houses, symbolizing a falling real estate market, reduced prices, and a potential crisis in the housing industry. Decrease crash illustrations Red down arrow and houses. A red down arrow alongside houses, symbolizing a falling real estate market, reduced prices, and a potential crisis in the housing industry
Free with trial Red arrow down, falling markets, economic crisis. Generative AI. Decrease crash illustrations Red arrow down, falling markets, economic crisis. Generative AI
Free with trial People lost job doodle icon sketch vector. people lost job sign. isolated symbol illustration. Decrease crash illustrations People lost job icon doodle illustration. people lost job doodle icon sketch vector. people lost job sign. isolated symbol illustration
Free with trial A bar chart representing a sharp decline makes a dramatic splash in clear water. This conceptual image visualizes a financial crisis, liquidity problems, or the impactful consequences of negative data and market failure. Decrease crash illustrations Economic Downturn Graph Splashing Down. A bar chart representing a sharp decline makes a dramatic splash in clear water. This conceptual image visualizes a financial crisis, liquidity problems, or the impactful consequences of negative data and market failure
Free with trial Stock prices falling during trading session on a laptop at the nyse. Decrease crash illustrations Stock market crashing on laptop at new york stock exchange. Stock prices falling during trading session on a laptop at the nyse
Free with trial This striking image depicts a downward arrow crashing through a globe, symbolizing market decline. The glowing red elements evoke urgency in financial analytics. Decrease crash illustrations Downward Arrow Crashing Through the Globe Concept. This striking image depicts a downward arrow crashing through a globe, symbolizing market decline. The glowing red elements evoke urgency in financial analytics
Free with trial A candlestick chart showing a significant downward trend. The chart features black candlesticks indicating price fluctuations over time, with red, green, and orange lines tracing different moving averages. A bar graph at the bottom provides additional data. This image can be used to represent financial loss, market downturns, or economic recession. Decrease crash illustrations Downward Trend Candlestick Chart. A candlestick chart showing a significant downward trend. The chart features black candlesticks indicating price fluctuations over time, with red, green, and orange lines tracing different moving averages. A bar graph at the bottom provides additional data. This image can be used to represent financial loss, market downturns, or economic recession.
Free with trial 3D icon featuring a golden bear and a descending red arrow above blue bars, symbolizing a bearish trend in financial markets. Decrease crash vectors Bear Market Graph with Downward Trend 3D Icon. 3D icon featuring a golden bear and a descending red arrow above blue bars, symbolizing a bearish trend in financial markets
Free with trial Economic crisis icon of economy depreciation and business downturn, vector line symbol. Banking investment recession, stock exchange trade fall and money value inflation icon of financial crisis. Decrease crash vectors Economic crisis icon economy business depreciation. Economic crisis icon of economy depreciation and business downturn, vector line symbol. Banking investment recession, stock exchange trade fall and money value inflation icon of financial crisis
Free with trial Damaged money box doodle icon sketch vector. damaged money box sign. isolated symbol illustration. Decrease crash vectors Damaged money box icon doodle illustration. damaged money box doodle icon sketch vector. damaged money box sign. isolated symbol illustration
Free with trial A powerful graphic illustration captures the essence of a financial bear market. A formidable bear stands against a red backdrop as a sharp arrow trends downwards, symbolizing economic recession, stock market downturns, and the inherent risks of investment. This modern and stylized design is perfect for concepts related to financial crisis, economic challenges, and trading. Decrease crash illustrations Bear Market Trend Financial Illustration. A powerful graphic illustration captures the essence of a financial bear market. A formidable bear stands against a red backdrop as a sharp arrow trends downwards, symbolizing economic recession, stock market downturns, and the inherent risks of investment. This modern and stylized design is perfect for concepts related to financial crisis, economic challenges, and trading
Free with trial A whiteboard displays a hand-drawn graph showing a significant downward trend. The graph illustrates a sharp decline, suggesting a negative market trend or economic downturn. Red markers and erasers are visible at the bottom. Decrease crash illustrations Downward Trend on Whiteboard. A whiteboard displays a hand-drawn graph showing a significant downward trend. The graph illustrates a sharp decline, suggesting a negative market trend or economic downturn. Red markers and erasers are visible at the bottom.
Free with trial This image shows a hand-drawn graph depicting a sharp decline, generated by AI for illustrative purposes. It's a simple yet effective visual representation of negative growth or market downturn, useful for presentations or reports. Decrease crash illustrations Downward Trend on Whiteboard. This image shows a hand-drawn graph depicting a sharp decline, generated by AI for illustrative purposes. It's a simple yet effective visual representation of negative growth or market downturn, useful for presentations or reports.
Free with trial Gold coin with a dollar sign is next to a red arrow pointing down, representing economic decline. Decrease crash illustrations Dollar coin value decreasing showing financial crisis. Gold coin with a dollar sign is next to a red arrow pointing down, representing economic decline
Free with trial Bankruptcy and inflation business, man in depression. Vector of crisis finance bankruptcy, business economy inflation illustration. Decrease crash illustrations Bankruptcy and inflation business, man in depression
Free with trial A minimalist icon representing a downturn in the housing market. Decrease crash vectors Real Estate Market Decline Vector Icon (3. A minimalist icon representing a downturn in the housing market
Free with trial A conceptual vector illustration symbolizing a downturn in the housing market. Decrease crash vectors Real Estate Market Decline Vector Icon (4. A conceptual vector illustration symbolizing a downturn in the housing market
Free with trial A simple vector icon representing a downturn in the housing market. Decrease crash vectors Real Estate Market Decline Vector Icon (2. A simple vector icon representing a downturn in the housing market
Free with trial This image shows a whiteboard displaying a graph with a downward trending red line, generated by AI. The visual clearly represents a negative trend or decline in a certain metric. The use of a whiteboard suggests a presentation or meeting context. Decrease crash illustrations Declining Trend on Whiteboard. This image shows a whiteboard displaying a graph with a downward trending red line, generated by AI. The visual clearly represents a negative trend or decline in a certain metric. The use of a whiteboard suggests a presentation or meeting context.
Free with trial Laptop displaying a graph with a red arrow pointing down, illustrating a financial crisis. Decrease crash vectors Laptop showing graph going down representing financial crisis. Laptop displaying a graph with a red arrow pointing down, illustrating a financial crisis
Free with trial Unhappy young businessman hold arrow facing down. Flat Vector Illustration isolated on White Background. Decrease crash illustrations Unhappy young businessman hold arrow facing down
Free with trial Broken circle arrow chart is representing negative growth and failure to meet targets. Decrease crash illustrations Broken circle arrow chart showing negative growth data. Broken circle arrow chart is representing negative growth and failure to meet targets
Free with trial The girl is discussing the business loss with a concerned expression, explaining the financial downturn, challenges faced, and the steps needed to recover. Her tone is serious and reflective. Decrease crash illustrations The girl is telling about the loss in the business. The girl is discussing the business loss with a concerned expression, explaining the financial downturn, challenges faced, and the steps needed to recover. Her tone is serious and reflective.
Free with trial A bold, modern vector illustration symbolizing a bear market. The powerful red bear head combined with a downward arrow creates a clear and impactful icon for financial news, investment blogs, and presentations about economic recession, stock market downturns, and bearish trading strategies. Decrease crash illustrations Bear Market Financial Downturn Vector Icon. A bold, modern vector illustration symbolizing a bear market. The powerful red bear head combined with a downward arrow creates a clear and impactful icon for financial news, investment blogs, and presentations about economic recession, stock market downturns, and bearish trading strategies
Free with trial The downfall of a once thriving tourism industry. Generative AI. Decrease crash illustrations The downfall of a once thriving tourism industry
Free with trial White downtrend arrow on black asphalt,. Decrease crash illustrations Downtrend economic arrow on blacktop, AI generated. White downtrend arrow on black asphalt,