Free with trial Stock market. The rise and fall of securities. Successful trading. Market trend up green and red down arrows, financial graphs. Business investment growth and loss arrow. Graph going up and down symbol vector illustration. Decrease diagram vector vectors Stock market. The rise and fall of securities. Successful trading. Market trend up green and red down arrows, financial graphs.
Free with trial Conceptual image depicting a decrease in the value of gold. Decrease diagram vector illustrations Gold Price Drop Magnifying Glass on Falling Gold Value. Conceptual image depicting a decrease in the value of gold.
Free with trial A line graph depicting a downward trend, symbolizing a decline in performance, sales, or economic activity, often used in business and financial contexts. Decrease diagram vector vectors Vector art of a line graph showing a downward trend, , indicating a decline in performance, sales, or economic activity in a. A line graph depicting a downward trend, symbolizing a decline in performance, sales, or economic activity, often used in business and financial contexts
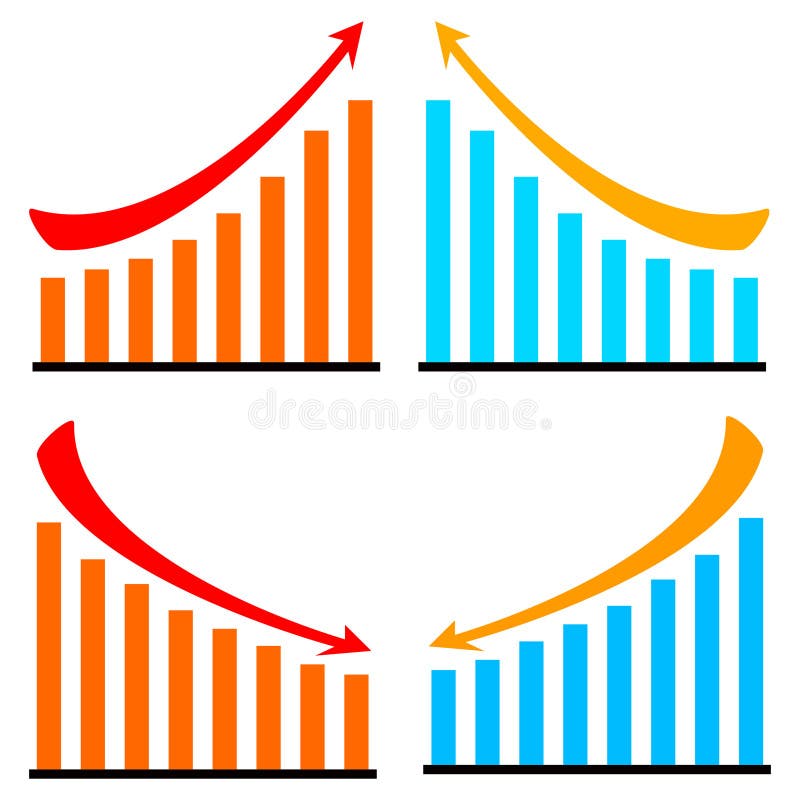
Free with trial Ascending and descending graph set. Vector illustration. Decrease diagram vector vectors Ascending and descending graph set.
Free with trial Ascending and descending graph set. Vector illustration. Decrease diagram vector vectors Ascending and descending graph set.
Free with trial Growth chart line icon. Neumorphic, Flat shadow, 3d buttons. Column graph sign. Market analytics symbol. Line growth chart icon. Social media icons. Vector. Decrease diagram vector vectors Growth chart line icon. Column graph sign. Neumorphic buttons. Vector. Growth chart line icon. Neumorphic, Flat shadow, 3d buttons. Column graph sign. Market analytics symbol. Line growth chart icon. Social media icons. Vector
Free with trial Set Browser with stocks market Financial growth Pie chart infographic Binary code Cloud computing lock Search data analysis and Data icon. Vector. Decrease diagram vector vectors Set Browser with stocks market, Financial growth, Pie chart infographic, Binary code, Cloud computing lock, Search data. Set Browser with stocks market Financial. Set Browser with stocks market Financial growth Pie chart infographic Binary code Cloud computing lock Search data analysis and Data icon. Vector.
Free with trial Sixteen simple yellow candlestick charts with black lines on a white background, arranged in a four by four grid. Decrease diagram vector vectors Vector illustration of sixteen yellow candlestick charts. Sixteen simple yellow candlestick charts with black lines on a white background, arranged in a four by four grid
Free with trial A visual creation that highlights a balanced composition with interesting details and style, presenting a harmonious and aesthetic blend of elements, suitable for various creative purposes. Decrease diagram vector vectors Colorful vector icons depicting growth, flow, and transition. A visual creation that highlights a balanced composition with interesting details and style, presenting a harmonious and aesthetic blend of elements, suitable for various creative purposes.
Free with trial This set contains business chart, magnifying glass. Good for market research and investment data collection concept design. Decrease diagram vector vectors Set of business chart statistic icon vector illustration on transparent background. This set contains business chart, magnifying glass. Good for market research and investment data collection concept design
Free with trial Up and Down sign with golden arrows isolated on a black, vector illustration. Concept of sales bar chart symbol icon with arrow moving down and sales bar chart with gold arrows moving up and down. Decrease diagram vector vectors Up and Down sign with golden arrows isolated on a black, vector illustration. Concept of sales bar chart symbol
Free with trial Financial crisis concept, losses, falling stock prices. Red Japanese candlestick chart and down arrow, and piggy bank losing money due to falling quotes. Flat vector cartoon illustration. Decrease diagram vector vectors Financial crisis concept, losses, falling stock prices. Red Japanese candlestick chart and down arrow, and piggy bank
Free with trial Planner studying graphs of development planning vector illustration. Company business and management strategy colourful picture in cartoon style, isolated. Decrease diagram vector illustrations Manager studying graphs of development plan. Planner studying graphs of development planning vector illustration. Company business and management strategy colourful picture in cartoon style, isolated
Free with trial Economic crisis banner website icon vector illustration concept with icons of market crash, economic bubble, bank run, inflation, pandemic, currency fall, unemployment, recession. Decrease diagram vector vectors Economic crisis banner website icon vector illustration concept with icons of market crash
Free with trial Isolated showing simple line graph showing downward trend on white background keywords: graph, chart, line graph, downward trend, decline, decrease. Decrease diagram vector illustrations Simple Line Graph Showing Downward Trend on White Background Keywords: graph, chart, line graph, downward trend
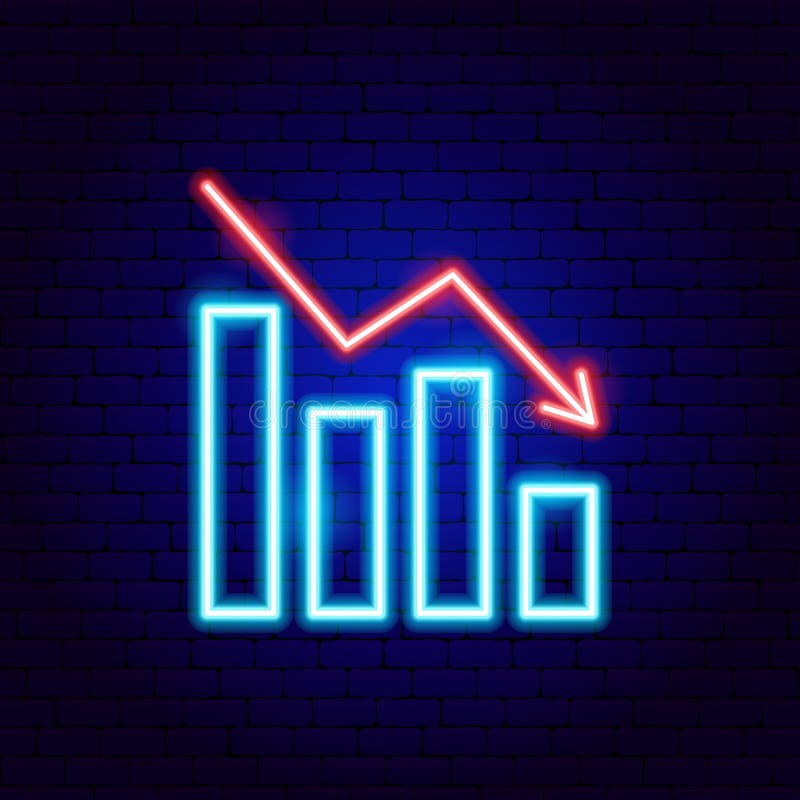
Free with trial Loss Graph Neon Sign. Vector Illustration of Analytics Data Symbol. Decrease diagram vector vectors Loss Graph Neon Sign
Free with trial A set of nine minimalist vector icons depicting various types of charts and graphs including bar charts, progress bars, and trend lines for data visualization and analytics. Decrease diagram vector vectors Collection of simple black glyph icons representing business charts graphs and data analysis. A set of nine minimalist vector icons depicting various types of charts and graphs including bar charts, progress bars, and trend lines for data visualization and analytics
Free with trial Business performance decline icon vector. Productivity drop and process efficiency loss symbol. Decrease diagram vector vectors Business performance decline icon. Productivity drop and process efficiency loss symbol
Free with trial Black And White Vector Illustrations. Stock Price Fall. Arrow On Chart Pointing Down. Bear Head. Stock Market Concept. Decrease diagram vector vectors Bear Market Icons. Black And White Vector Illustrations. Stock Price Fall. Arrow On Chart Pointing Down. Bear Head. Stock Market Concept
Free with trial A simple black vector illustration of a simple checkmark inside a circle, set against a white background, composed of basic geometric shapes, large circle, two perpendicular lines --chaos 30 --ar 16:9 --v 7 Job ID: e5716674-c7ae-40bc-b54b-07f4d0cf3160. Decrease diagram vector illustrations Black Circle with Inner V Symbol. a simple black vector illustration of a simple checkmark inside a circle, set against a white background, composed of basic geometric shapes, large circle, two perpendicular lines --chaos 30 --ar 16:9 --v 7 Job ID: e5716674-c7ae-40bc-b54b-07f4d0cf3160
Free with trial Set Bank building Mobile stock trading Money bag Credit card Contract money and pen Global economic crisis and Employee dismissal icon. Vector. Decrease diagram vector vectors Set Bank building, Mobile stock trading, Money bag, Credit card, Contract money and pen, Global economic crisis and. Set Bank building Mobile stock trading Money bag Credit card Contract money and pen Global economic crisis and Employee dismissal icon. Vector.
Free with trial Horizontal chart line icon. Neumorphic, Flat shadow, 3d buttons. Column graph sign. Market analytics symbol. Line horizontal chart icon. Social media icons. Vector. Decrease diagram vector illustrations Horizontal chart line icon. Column graph sign. Neumorphic buttons. Vector. Horizontal chart line icon. Neumorphic, Flat shadow, 3d buttons. Column graph sign. Market analytics symbol. Line horizontal chart icon. Social media icons. Vector
Free with trial Hand-drawn financial charts, graphs, and calculators perfect for business, finance, and accounting illustrations. These vector illustrations depict various tools used for data analysis and financial calculations. Decrease diagram vector vectors Collection of Hand Drawn Financial Charts and Calculators. Hand-drawn financial charts, graphs, and calculators perfect for business, finance, and accounting illustrations. These vector illustrations depict various tools used for data analysis and financial calculations.
Free with trial Bar chart collapse icon with downward arrow. Decline and negative trend sign symbol vector. Decrease diagram vector vectors Bar chart collapse icon with downward arrow. Decline and negative trend sign symbol
Free with trial A conceptual vector illustration depicting business analysis and market research. A hand holds a magnifying glass, focusing on a colorful financial chart with bar and line graphs labeled 'Market Trends'. Surrounding icons represent key business metrics like growth, decline, market share, and innovation. This flat design graphic is ideal for presentations, reports, and web content related to data analytics, strategic planning, and financial performance evaluation, symbolizing the scrutiny of data to identify opportunities and understand market dynamics. Decrease diagram vector illustrations Business Analysis and Market Trends Concept with Magnifying Glass. A conceptual vector illustration depicting business analysis and market research. A hand holds a magnifying glass, focusing on a colorful financial chart with bar and line graphs labeled 'Market Trends'. Surrounding icons represent key business metrics like growth, decline, market share, and innovation. This flat design graphic is ideal for presentations, reports, and web content related to data analytics, strategic planning, and financial performance evaluation, symbolizing the scrutiny of data to identify opportunities and understand market dynamics.
Free with trial Pie chart line icon. Neumorphic, Flat shadow, 3d buttons. Presentation 3d graph sign. Market analytics symbol. Line pie chart icon. Social media icons. Vector. Decrease diagram vector vectors Pie chart line icon. Presentation 3d graph sign. Neumorphic buttons. Vector. Pie chart line icon. Neumorphic, Flat shadow, 3d buttons. Presentation 3d graph sign. Market analytics symbol. Line pie chart icon. Social media icons. Vector
Free with trial Viewing Progress Icon Line Design Style Finance and Business Symbol Vector Illustrations. Decrease diagram vector vectors Viewing Progress Icon Line Design Style Finance and Business Symbol
Free with trial Bitcoin failing graph crypto currency. Coin B symbol finance economy banking system. Blockchain extra crash with lightning negative forecast for decline in value vector illustration. Decrease diagram vector vectors Bitcoin failing graph crypto currency. Coin B symbol finance economy banking system. Blockchain extra crash with
Free with trial Simple line graph illustrating a negative trend, representing a decrease or decline in data. Perfect for presentations, reports, or website design. Decrease diagram vector vectors Downward Trending Line Graph, Showing Negative Growth or Decline. Simple line graph illustrating a negative trend, representing a decrease or decline in data. Perfect for presentations, reports, or website design.
Free with trial Illustrative line graph charting downward trend, representing losses, recession or market decline, isolated stock diagram. Decrease diagram vector vectors Illustrative line graph charting downward trend, representing losses, recession or market decline, isolated stock
Free with trial A conceptual vector illustration depicting the duality of business performance. On a modern teal background, two reports are shown side-by-side. One features a rising red graph symbolizing growth, profit, and success, while the other displays a descending graph representing decline, loss, and failure. This flat design graphic is ideal for financial analysis, market trend comparisons, business presentations, and infographics illustrating opposite outcomes or strategic choices. The long shadow effect adds a contemporary feel to the design. Decrease diagram vector vectors Growth and Decline Business Charts Comparison. A conceptual vector illustration depicting the duality of business performance. On a modern teal background, two reports are shown side-by-side. One features a rising red graph symbolizing growth, profit, and success, while the other displays a descending graph representing decline, loss, and failure. This flat design graphic is ideal for financial analysis, market trend comparisons, business presentations, and infographics illustrating opposite outcomes or strategic choices. The long shadow effect adds a contemporary feel to the design.
Free with trial An optical illusion featuring a geometric, 3D tunneling effect created with a red and white checkered pattern. The squares decrease in size toward the center, enhancing the illusion of depth and perspective. The design is framed by thin red lines, emphasizing the rectangular shape. Clean lines and contrasting colors contribute to the visual impact of the artwork. Decrease diagram vector vectors Vector art of data analysis and business analytics concept, business people analyzing financial graph and chart. An optical illusion featuring a geometric, 3D tunneling effect created with a red and white checkered pattern. The squares decrease in size toward the center, enhancing the illusion of depth and perspective. The design is framed by thin red lines, emphasizing the rectangular shape. Clean lines and contrasting colors contribute to the visual impact of the artwork.
Free with trial Business graph data in a bar chart showing increase and decrease with blue line illustration on plain background. Decrease diagram vector vectors Business graph data in a bar chart showing increase and decrease with blue line illustration on plain background
Free with trial A minimalist, black and white vector icon representing a bar chart or graph. The icon features a series of vertical bars of varying heights, set against a base of horizontal lines. This clean and modern design is ideal for representing data, statistics, progress, growth, or financial information in digital and print media. Its simple aesthetic makes it versatile for use in presentations, websites, apps, and infographics. Decrease diagram vector vectors Abstract Bar Chart Icon. A minimalist, black and white vector icon representing a bar chart or graph. The icon features a series of vertical bars of varying heights, set against a base of horizontal lines. This clean and modern design is ideal for representing data, statistics, progress, growth, or financial information in digital and print media. Its simple aesthetic makes it versatile for use in presentations, websites, apps, and infographics.
Free with trial A bold, black arrow pointing diagonally downwards against a clean white background. The arrow is stylized with broken lines suggesting rapid decline or disruption. This versatile graphic can represent economic downturn, market crash, failure, decrease, or negative trends. It's suitable for business presentations, financial reports, and website design. Decrease diagram vector illustrations Downward Trend Arrow Icon. A bold, black arrow pointing diagonally downwards against a clean white background. The arrow is stylized with broken lines suggesting rapid decline or disruption. This versatile graphic can represent economic downturn, market crash, failure, decrease, or negative trends. It's suitable for business presentations, financial reports, and website design.
Free with trial Business decline icon vector with downward arrow. Loss, failure, or economic crisis symbol with long shadow. Decrease diagram vector vectors Business decline icon with downward arrow. Loss, failure, or economic crisis symbol with long shadow
Free with trial Downward trend bar chart with red arrow icon. Financial loss, decline, or economic crisis symbol vector. Decrease diagram vector vectors Downward trend bar chart with red arrow icon. Financial loss, decline, or economic crisis symbol
Free with trial A minimalist black icon depicting an arrow that features a distinct wavy, oscillating curve before straightening and pointing downwards. This graphic symbolizes a fluctuating decline, an unstable downward trend, or a challenging path with variations. Ideal for illustrating concepts such as market volatility, data fluctuations, difficult progress, or any process involving an unstable decrease. Isolated on a white background for versatile use in web, print, and presentations. Generated by AI. Decrease diagram vector vectors Black Wavy Down Arrow Icon. A minimalist black icon depicting an arrow that features a distinct wavy, oscillating curve before straightening and pointing downwards. This graphic symbolizes a fluctuating decline, an unstable downward trend, or a challenging path with variations. Ideal for illustrating concepts such as market volatility, data fluctuations, difficult progress, or any process involving an unstable decrease. Isolated on a white background for versatile use in web, print, and presentations. Generated by AI
Free with trial Up and down graph icon on black circle. Outline bar chart with uptrend and downtrend arrow symbol vector. Decrease diagram vector vectors Up and down graph icon on black circle. Outline bar chart with uptrend and downtrend arrow symbol
Free with trial Set line Mobile stock trading, Global economic crisis news, Glass money jar with coin and Bank building. Glowing neon icon. Vector. Decrease diagram vector illustrations Set line Mobile stock trading, Global economic crisis news, Glass money jar with coin and Bank building. Glowing neon
Free with trial Line Graph Trend Analysis Line And Solid Icon Set. Data Visualization, Business Growth, Statistical Analysis Symbol Collection. Financial And Market Insights. Isolated Vector Illustration. Decrease diagram vector vectors Line Graph Trend Analysis Line And Solid Icon Set. Data Visualization, Business Growth, Statistical Analysis Symbol
Free with trial A clean and modern vector illustration of a line graph, isolated on a white background. This flat design icon features two distinct lines, one blue and one brown, plotting various data points to show trends and comparisons over time. It's a versatile graphic representing concepts like data analysis, business analytics, financial statistics, market research, and performance tracking. Ideal for use in presentations, infographics, websites, business reports, and marketing materials to visualize progress, growth, or economic fluctuations. Decrease diagram vector vectors Data Analysis Line Graph Icon. A clean and modern vector illustration of a line graph, isolated on a white background. This flat design icon features two distinct lines, one blue and one brown, plotting various data points to show trends and comparisons over time. It's a versatile graphic representing concepts like data analysis, business analytics, financial statistics, market research, and performance tracking. Ideal for use in presentations, infographics, websites, business reports, and marketing materials to visualize progress, growth, or economic fluctuations.
Free with trial Graph going down and up sign with green and red arrows vector. Bar chart symbol icon with arrow moving down and sales bar chart with arrow moving up. Decrease diagram vector vectors Graph going down and up sign with green and red arrows vector. Bar chart symbol icon with arrow moving down and sales bar chart
Free with trial Arrow down and up percent outline icon on circle line. Percentage downward and upward arrows sign symbol vector. Decrease diagram vector vectors Arrow down and up percent outline icon on circle line. Percentage downward and upward arrows sign symbol
Free with trial A clean, minimalist vector illustration of a bar chart featuring three distinct columns. The columns are colored in vibrant orange, teal, and yellow, representing different data points or categories. The chart is set against a white background with a dark blue axis line, making it ideal for presentations, reports, and infographics focused on data visualization, business growth, or financial analysis. Decrease diagram vector vectors Simple Bar Chart with Three Columns. A clean, minimalist vector illustration of a bar chart featuring three distinct columns. The columns are colored in vibrant orange, teal, and yellow, representing different data points or categories. The chart is set against a white background with a dark blue axis line, making it ideal for presentations, reports, and infographics focused on data visualization, business growth, or financial analysis.
Free with trial An illustration depicting periodic table trends, including ionization energy, electronegativity, metallic character, atomic radius, and electron affinity, for education. Decrease diagram vector vectors Vector art of periodic table trends with ionization energy, electronegativity, and metallic character. An illustration depicting periodic table trends, including ionization energy, electronegativity, metallic character, atomic radius, and electron affinity, for education
Free with trial A collection of business-related icons illustrating various aspects of business, including target achievement, growth, decline, and organizational structure. Decrease diagram vector vectors Vector art of a set of business icons, , representing target achievement, growth, decline, and structure in a business or. A collection of business-related icons illustrating various aspects of business, including target achievement, growth, decline, and organizational structure
Free with trial Business decline icon with downward arrow. Loss, failure, or economic crisis symbol vector. Decrease diagram vector vectors Business decline icon with downward arrow. Loss, failure, or economic crisis symbol
Free with trial A set of three distinct candlestick chart icons, rendered in a clean, flat vector style against a white background. The green candle typically represents a bullish trend or price increase, the red candle signifies a bearish trend or price decrease, and the gray candle can denote neutrality or indecision in the market. These versatile symbols are ideal for illustrating financial concepts, stock market analysis, trading platforms, investment apps, economic reports, and educational materials related to forex, cryptocurrency, and general business trends. Decrease diagram vector vectors Candlestick Chart Icons for Financial Analysis. A set of three distinct candlestick chart icons, rendered in a clean, flat vector style against a white background. The green candle typically represents a bullish trend or price increase, the red candle signifies a bearish trend or price decrease, and the gray candle can denote neutrality or indecision in the market. These versatile symbols are ideal for illustrating financial concepts, stock market analysis, trading platforms, investment apps, economic reports, and educational materials related to forex, cryptocurrency, and general business trends.
Free with trial A clean vector illustration of a descending bar graph, symbolizing a period of financial decline, economic recession, or poor business performance. Decrease diagram vector vectors Descending Bar Chart Showing Financial Decline. A clean vector illustration of a descending bar graph, symbolizing a period of financial decline, economic recession, or poor business performance
Free with trial A minimalist black vector icon illustrating a significant decline or negative trend. The image features three bar chart elements, progressively decreasing in height from left to right, symbolizing a fall in data or performance. A prominent, thick downward-pointing arrow diagonally overlays the bars, reinforcing the concept of reduction, loss, or economic downturn. Isolated on a clean white background, this graphic is ideal for financial reports, business presentations, economic analysis, or any visual communication requiring a clear representation of falling statistics or poor results. Decrease diagram vector vectors Business Decline Bar Chart with Down Arrow Icon. A minimalist black vector icon illustrating a significant decline or negative trend. The image features three bar chart elements, progressively decreasing in height from left to right, symbolizing a fall in data or performance. A prominent, thick downward-pointing arrow diagonally overlays the bars, reinforcing the concept of reduction, loss, or economic downturn. Isolated on a clean white background, this graphic is ideal for financial reports, business presentations, economic analysis, or any visual communication requiring a clear representation of falling statistics or poor results.
Free with trial Illustration of a growing budget efficiency with a simple money bag closing tightly, a stylized downward-pointing cost arrow, and a stream of saved coins. Vector flat icon design on a white background for a cost control illustration --chaos 30 --ar 16:9 --v 7 Job ID: 35adf769-e45b-43cf-a8e7-0b2af69479b3. Decrease diagram vector illustrations Money Bag Downward Arrow, Financial Crisis, Economic Downturn, Falling Value. Illustration of a growing budget efficiency with a simple money bag closing tightly, a stylized downward-pointing cost arrow, and a stream of saved coins. Vector flat icon design on a white background for a cost control illustration --chaos 30 --ar 16:9 --v 7 Job ID: 35adf769-e45b-43cf-a8e7-0b2af69479b3
Free with trial Bar chart with downward arrow icon vector. Financial crisis concept. Economy downturn and loss symbol in black circle. Decrease diagram vector vectors Bar chart with downward arrow icon. Financial crisis concept. Economy downturn and loss symbol in black circle
Free with trial A line art illustration isolated on white background displays business performance indicators: a speedometer, arrows, a bar graph, and a line graph, all in a minimalist style. Decrease diagram vector vectors Vector art of line art illustration of business performance indicators featuring a speedometer, arrows, bar graph, and line graph. A line art illustration isolated on white background displays business performance indicators: a speedometer, arrows, a bar graph, and a line graph, all in a minimalist style
Free with trial Economic crisis icon of economy depreciation and business downturn, vector line symbol. Banking investment recession, stock exchange trade fall and money value inflation icon of financial crisis. Decrease diagram vector vectors Economic crisis icon economy business depreciation. Economic crisis icon of economy depreciation and business downturn, vector line symbol. Banking investment recession, stock exchange trade fall and money value inflation icon of financial crisis
Free with trial World financial crisis color line icon of down arrow graph, globe and money vector outline symbol. Economic crisis, money loss and finance decline, business recession, stock market crash or bankruptcy. Decrease diagram vector vectors World financial crisis icon, down graph and globe. World financial crisis color line icon of down arrow graph, globe and money vector outline symbol. Economic crisis, money loss and finance decline, business recession, stock market crash or bankruptcy
Free with trial Unemployment line icon of unemployed man on labor market, vector symbol. Economic crisis, global financial downturn and bankruptcy icon of economy recession and unemployment problem. Decrease diagram vector vectors Unemployment line icon, economic financial crisis. Unemployment line icon of unemployed man on labor market, vector symbol. Economic crisis, global financial downturn and bankruptcy icon of economy recession and unemployment problem
Free with trial Graph of Fixed cost, variable costs, mixed cost to compare vector. Decrease diagram vector vectors Graph of Fixed cost, variable costs, mixed cost to compare
Free with trial Three blue apple icons are depicted. The top apple stands alone, and the two below have arrows beside them. The left apple has a downward arrow, indicating a decrease, while the right apple is paired with an upward arrow, suggesting an increase. Each apple is solid blue with a small leaf, symbolizing fruit-related data or trends. The arrangement is simple and symmetrical on a white background, with the icons representing changes in quantity or direction. Decrease diagram vector vectors Apples with up and down arrows with fruit icon with directional arrows. Three blue apple icons are depicted. The top apple stands alone, and the two below have arrows beside them. The left apple has a downward arrow, indicating a decrease, while the right apple is paired with an upward arrow, suggesting an increase. Each apple is solid blue with a small leaf, symbolizing fruit-related data or trends. The arrangement is simple and symmetrical on a white background, with the icons representing changes in quantity or direction.
Free with trial Economic crisis line icon of savings depreciation, economy downturn and bankruptcy, vector symbol. Banking business and money savings depreciation icon of piggy bank and arrow down of financial crisis. Decrease diagram vector vectors Economic crisis line icon of savings depreciation
Free with trial This vector illustration features a comprehensive set of modern infographic and decision-making elements, isolated on a clean white background with subtle reflections. The collection includes stylized casino chips marked "YES" and "NO" for choices, various bar charts depicting growth and data, and segmented donut pie charts representing proportions. An abstract 3D shape adds a contemporary touch. Ideal for presentations, business reports, websites, and applications requiring visual representation of data, statistics, polls, and strategic decisions in a clean, professional design. Decrease diagram vector vectors Business Infographics and Decision Making Elements Set. This vector illustration features a comprehensive set of modern infographic and decision-making elements, isolated on a clean white background with subtle reflections. The collection includes stylized casino chips marked "YES" and "NO" for choices, various bar charts depicting growth and data, and segmented donut pie charts representing proportions. An abstract 3D shape adds a contemporary touch. Ideal for presentations, business reports, websites, and applications requiring visual representation of data, statistics, polls, and strategic decisions in a clean, professional design.
Free with trial A collection of nine flat vector icons for data visualization including bar graphs, line charts, pie charts, and performance meters isolated on a white background. Decrease diagram vector vectors Simple black data analysis and business chart icon set. A collection of nine flat vector icons for data visualization including bar graphs, line charts, pie charts, and performance meters isolated on a white background
Free with trial Bar chart with downward arrow icon vector. Financial crisis concept. Economy downturn and loss symbol in circular outline. Decrease diagram vector vectors Bar chart with downward arrow icon. Financial crisis concept. Economy downturn and loss symbol in circular outline
Free with trial Outline bar chart icon with upward and downward trend arrow. Uptrend and downtrend business graph symbol vector. Decrease diagram vector vectors Outline bar chart icon with upward and downward trend arrow. Uptrend and downtrend business graph symbol
Free with trial This image shows two pie charts, representing data segments and fractions. Perfect for business presentations, reports, and statistical analysis. Clean and simple. Decrease diagram vector vectors Vector art of pie chart showing data segments isolated on white background for business analysis and presentation. This image shows two pie charts, representing data segments and fractions. Perfect for business presentations, reports, and statistical analysis. Clean and simple
Free with trial The image displays two black arrows positioned side by side. The arrow on the left points upward, symbolizing an increase or upward direction, while the arrow on the right points downward, indicating a decrease or downward direction. Both arrows are simple and bold, with no additional embellishments. Decrease diagram vector illustrations Upward and downward arrows indicating opposing directions. The image displays two black arrows positioned side by side. The arrow on the left points upward, symbolizing an increase or upward direction, while the arrow on the right points downward, indicating a decrease or downward direction. Both arrows are simple and bold, with no additional embellishments
Free with trial This image features a collection of data visualization icons, including charts, graphs, and organizational structures, perfect for illustrating data analysis and reporting. Decrease diagram vector vectors Vector art of collection of data visualization icons showcasing various chart types and organizational structures for data. This image features a collection of data visualization icons, including charts, graphs, and organizational structures, perfect for illustrating data analysis and reporting
Free with trial Reduction chart icon Vector symbol or sign set collection in black and white outline. Decrease diagram vector vectors Reduction chart icon flat line symbol set. Reduction chart icon Vector symbol or sign set collection in black and white outline
Free with trial This illustration depicts a black piggy bank with a bitcoin logo positioned in front of a falling graph, symbolizing financial loss and investment risk. Decrease diagram vector vectors Vector art of piggy bank with bitcoin logo in front of a falling graph illustrating financial loss and investment risk. This illustration depicts a black piggy bank with a bitcoin logo positioned in front of a falling graph, symbolizing financial loss and investment risk
Free with trial Illustration of a growing budget efficiency with a simple money bag closing tightly, a stylized downward-pointing cost arrow, and a stream of saved coins. Vector flat icon design on a white background for a cost control illustration --chaos 30 --ar 16:9 --v 7 Job ID: 35adf769-e45b-43cf-a8e7-0b2af69479b3. Decrease diagram vector illustrations Money Bag with Falling Coins and Downward Arrow, Symbolizing Financial Loss or Decrease. Illustration of a growing budget efficiency with a simple money bag closing tightly, a stylized downward-pointing cost arrow, and a stream of saved coins. Vector flat icon design on a white background for a cost control illustration --chaos 30 --ar 16:9 --v 7 Job ID: 35adf769-e45b-43cf-a8e7-0b2af69479b3
Free with trial Conceptual vector icon representing declining popularity or a downward trend in love or affection. Decrease diagram vector illustrations Declining Popularity Search Heart, Graph, Magnifying Glass Icon. Conceptual vector icon representing declining popularity or a downward trend in love or affection.
Free with trial Collection of simple black vector icons representing financial charts, data analysis graphs, and business statistics. Includes trend arrows, magnifier, and settings symbols. Decrease diagram vector illustrations Set of black business graph and chart icons for data analysis. Collection of simple black vector icons representing financial charts, data analysis graphs, and business statistics. Includes trend arrows, magnifier, and settings symbols
Free with trial Bar chart with downward arrow icon. Financial crisis concept. Economy downturn and loss symbol vector. Decrease diagram vector vectors Bar chart with downward arrow icon. Financial crisis concept. Economy downturn and loss symbol
Free with trial Online finance crisis. Man with briefcase near smartphone with falling graphs and diagrams. Economical crisis and recession, inflation. Sad trader and investor. Flat vector illustration. Decrease diagram vector vectors Online finance crisis. Man with briefcase near smartphone with falling graphs and diagrams. Economical crisis and recession
Free with trial A stock market chart analysis with a downward trend arrow, illustrating financial decline, economic downturn, and investment risk in a clear visual manner. Decrease diagram vector vectors Vector art of stock market chart analysis with downward trend arrow indicating financial decline and economic downturn. A stock market chart analysis with a downward trend arrow, illustrating financial decline, economic downturn, and investment risk in a clear visual manner
Free with trial The image presents a colorful bar graph with a downward trending line, symbolizing a decline in performance or an economic downturn on a white background. Decrease diagram vector vectors Vector art of colorful bar graph with a downward trending line, indicating a decline in performance or economic downturn. The image presents a colorful bar graph with a downward trending line, symbolizing a decline in performance or an economic downturn on a white background
Free with trial This image shows a balance scale with upward and downward arrows, symbolizing market trends, economic fluctuations, and financial equilibrium in the economy. Decrease diagram vector vectors Vector art of balance scale with upward and downward arrows, symbolizing market trends, economic fluctuations, and financial. This image shows a balance scale with upward and downward arrows, symbolizing market trends, economic fluctuations, and financial equilibrium in the economy
Free with trial Graph and Chart icon set. Containing data, increase, growth, pie chart, data analytics, business and more. Vector graph icon set. Decrease diagram vector vectors Graph and Chart icon set. Containing data, increase, growth, pie chart, data analytics, business and more.
Free with trial A simple graph illustration with red dots connected by black lines, representing data trends and statistical analysis on a clean, white background. Decrease diagram vector vectors Vector art of red dots connected by black lines forming a graph. A simple graph illustration with red dots connected by black lines, representing data trends and statistical analysis on a clean, white background
Free with trial Unemployment line icon of unemployed man on labor market, vector symbol. Economic crisis, global financial downturn and bankruptcy icon of economy recession and unemployment problem. Decrease diagram vector vectors Unemployment line icon, economic financial crisis. Unemployment line icon of unemployed man on labor market, vector symbol. Economic crisis, global financial downturn and bankruptcy icon of economy recession and unemployment problem