Free with trial A stark downward trending graph against a white backdrop signifies economic downturn, financial losses, and negative market performance. It represents a period of decline. Decrease diagram vector vectors Vector art of downward trending graph, depicting economic decline, financial loss, market downturn, and negative performance. A stark downward trending graph against a white backdrop signifies economic downturn, financial losses, and negative market performance. It represents a period of decline
Free with trial Deflation line icon. Economic crisis sign. Vector illustration. Decrease diagram vector vectors Deflation line icon. Economic crisis sign
Free with trial This image represents financial loss with a graph showing a downward trend, symbolizing economic decline. A hand supports the graph, highlighting investment risks. Decrease diagram vector vectors Vector art of financial loss concept a hand supports a graph showing a downward trend, indicating economic decline and potential. This image represents financial loss with a graph showing a downward trend, symbolizing economic decline. A hand supports the graph, highlighting investment risks
Free with trial A visually striking bar graph illustration depicting both upward and downward trends, set against a clean white background, representing market dynamics and data analysis. Decrease diagram vector vectors Vector art of a dynamic bar graph illustration showcasing both upward and downward trends, , symbolizing market fluctuations and. A visually striking bar graph illustration depicting both upward and downward trends, set against a clean white background, representing market dynamics and data analysis
Free with trial Bankruptcy icon vector logo set collection for web app ui. Decrease diagram vector vectors Bankruptcy icon Outline flat Icon. Bankruptcy icon vector logo set collection for web app ui
Free with trial A set of twelve diverse and versatile vector icons depicting various types of charts commonly used in business and data analysis. These include line graphs showing upward and fluctuating trends, bar charts illustrating data comparisons, and pie charts representing proportions. Ideal for presentations, reports, websites, and infographics related to finance, marketing, and statistics. Decrease diagram vector vectors Collection of Line and Bar Charts & Pie Charts - Business Data Visualization Icons. A set of twelve diverse and versatile vector icons depicting various types of charts commonly used in business and data analysis. These include line graphs showing upward and fluctuating trends, bar charts illustrating data comparisons, and pie charts representing proportions. Ideal for presentations, reports, websites, and infographics related to finance, marketing, and statistics.
Free with trial A rupee symbol with a downward graph illustrates economic decline, financial loss, and currency devaluation through a simple design on a white background. Decrease diagram vector vectors Vector art of rupee symbol with downward graph depicts economic decline, financial loss, and currency devaluation in a simple. A rupee symbol with a downward graph illustrates economic decline, financial loss, and currency devaluation through a simple design on a white background
Free with trial An illustration of Bitcoin, cryptocurrency market analysis, growth chart, and blockchain technology, representing digital finance and investment trends. Decrease diagram vector vectors Vector art of bitcoin and cryptocurrency market analysis with growth chart and blockchain technology isolated on white background. An illustration of Bitcoin, cryptocurrency market analysis, growth chart, and blockchain technology, representing digital finance and investment trends
Free with trial Bar chart with downward trending arrow, representing loss, decrease, or recession. Decrease diagram vector vectors Bar chart with downward trending arrow, representing loss, decrease, or recession
Free with trial This vector illustration shows a financial chart with green bar graphs, arrows indicating downfalls, a dollar coin and money bag. It conveys a financial concept. Decrease diagram vector vectors Financial Chart Showing Market Trends with Dollar Signs and Green Arrows. This vector illustration shows a financial chart with green bar graphs, arrows indicating downfalls, a dollar coin and money bag. It conveys a financial concept.
Free with trial This stylized bar graph shows a downward trending line, representing decrease or loss in a flat graphic style with blue and gray hues. Decrease diagram vector vectors Downward trend graph indicating loss or decline in a modern simple style. This stylized bar graph shows a downward trending line, representing decrease or loss in a flat graphic style with blue and gray hues.
Free with trial Blue Searching for food in trash can on streets outdoors icon isolated on white background. Homelessness and poverty concept. Vector. Decrease diagram vector illustrations Blue Searching for food in trash can on streets outdoors icon isolated on white background. Homelessness and poverty
Free with trial Black and Blue Line Diagram and Report Icon. Decrease diagram vector illustrations Low Sales and diagram icon concept. Black and Blue Line Diagram and Report Icon
Free with trial A chart with a growing trend. Financial Flat vector illustration isolated on white background. Decrease diagram vector illustrations A graph with a dollar sign. A chart with a growing trend. Financial Flat vector illustration isolated on white background.
Free with trial A graph with a dollar sign. A growing trend. Financial Flat vector illustration isolated on white background. Decrease diagram vector vectors A graph with a dollar sign
Free with trial Vector illustration of a statistical bar graph, with a green arrow with an upward trend. Decrease diagram vector vectors Statistical bar graph
Free with trial This image displays two simple, contrasting arrows: one pointing upwards and the other pointing downwards. Both arrows are solid grey with a white background, representing opposite directions or concepts commonly used in user interfaces, charts, or diagrams to indicate increase and decrease. Decrease diagram vector illustrations Two opposing arrows indicating upward and downward directions in a minimalist design. This image displays two simple, contrasting arrows: one pointing upwards. This image displays two simple, contrasting arrows: one pointing upwards and the other pointing downwards. Both arrows are solid grey with a white background, representing opposite directions or concepts commonly used in user interfaces, charts, or diagrams to indicate increase and decrease
Free with trial Pattern of black circles on a white background arranged in a grid. Circles decrease in size from left to right, creating a halftone effect. Larger dots on the left transition to smaller ones on the right, forming a gradient from dense to sparse patterning. The design creates an illusion of depth and texture, commonly used in graphic design for shading and texture in illustrations and prints. Decrease diagram vector vectors Halftone dots, circles pattern, background. Dots, Polka dots pattern - stock vector illustration, clip-art graphics. Pattern of black circles on a white background arranged in a grid. Circles decrease in size from left to right, creating a halftone effect. Larger dots on the left transition to smaller ones on the right, forming a gradient from dense to sparse patterning. The design creates an illusion of depth and texture, commonly used in graphic design for shading and texture in illustrations and prints.
Free with trial Businessman falls from a stack of coins. Financial crisis. Decrease in capital. Decrease diagram vector vectors Businessman falls from a stack of coins. Financial crisis. Decrease in capital.
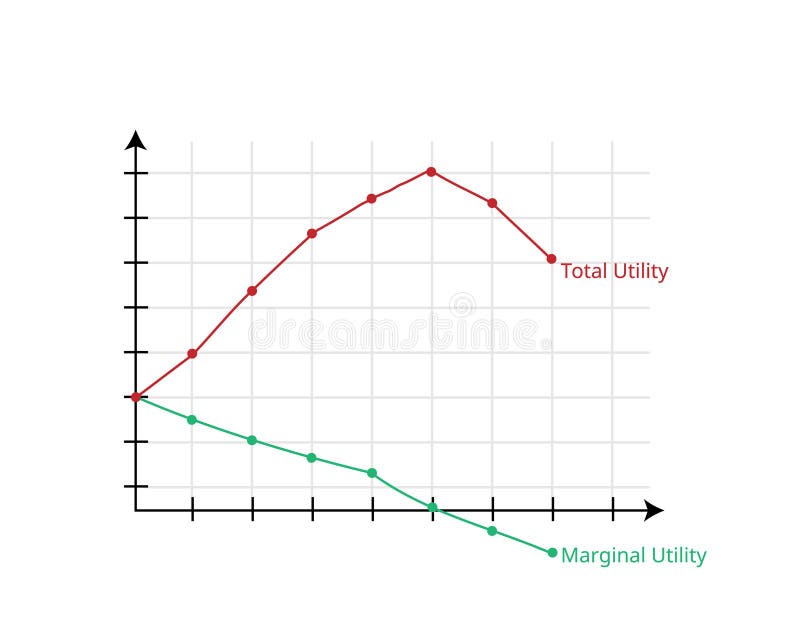
Free with trial Marginal utility and total utility theory graph in economics vector. Decrease diagram vector vectors Marginal utility and total utility theory graph in economics
Free with trial Crisis. Graphs and charts templates. Business infographics. Statistic and data, bankruptcy, financial crisis, money loss, down arrow, economy reduction. Financial chart. Vector illustration. Decrease diagram vector illustrations Crisis. Graphs and charts templates. Business infographics.
Free with trial A set of nine minimalist vector icons depicting various types of charts and graphs including bar charts, progress bars, and trend lines for data visualization and analytics. Decrease diagram vector vectors Collection of simple black glyph icons representing business charts graphs and data analysis. A set of nine minimalist vector icons depicting various types of charts and graphs including bar charts, progress bars, and trend lines for data visualization and analytics
Free with trial Financial graph illustrates the decline in Bitcoin value, depicted with a red arrow and blue graph bars in a flat vector style. Decrease diagram vector vectors Bitcoin value declining depicted through a financial graph and currency on black background. Financial graph illustrates the decline in Bitcoin value, depicted with a red arrow and blue graph bars in a flat vector style.
Free with trial Flat vector design showcasing a downward trending graph with a distinct red arrow. Represents market decline and financial challenges against a stark black background. Decrease diagram vector vectors Downward Graph with Arrow: A Visual Representation of Market Downturn and Financial Loss. Flat vector design showcasing a downward trending graph with a distinct red arrow. Represents market decline and financial challenges against a stark black background.
Free with trial A flat vector illustration of a declining bar graph with a red arrow on a black background illustrating financial loss. Decrease diagram vector vectors Declining Bar Graph with Red Arrow Illustrating Financial Downturn on Black Background. A flat vector illustration of a declining bar graph with a red arrow on a black background illustrating financial loss.
Free with trial Economy growth graph down vector icon illustration. Decrease diagram vector vectors Economy growth graph down icon design. economy growth graph down vector icon illustration
Free with trial Clean vector icon illustrating a declining line graph with push pins, symbolizing data analysis. Decrease diagram vector illustrations Line graph decline chart icon. Clean vector icon illustrating a declining line graph with push pins, symbolizing data analysis
Free with trial Paper cut Global economic crisis icon isolated on grey and black background. World finance crisis. Paper art style. Vector. Decrease diagram vector illustrations Paper cut Global economic crisis icon isolated on grey and black background. World finance crisis. Paper art style
Free with trial Stylized flat vector graph displaying a downward trend with percentage symbols; composed against a stark black background for emphasis. Decrease diagram vector vectors Downward Trend Graph Illustration Showing Declining Percentage Values on Black Backdrop. Stylized flat vector graph displaying a downward trend with percentage symbols; composed against a stark black background for emphasis.
Free with trial This image shows a red bar graph with a downward trend indicated by a down arrow, and an upward trend indicated by an up arrow, set against a white background. Decrease diagram vector vectors Vector art of red bar graph showing a downward trend with an arrow pointing down and an upward trend with an arrow pointing up. This image shows a red bar graph with a downward trend indicated by a down arrow, and an upward trend indicated by an up arrow, set against a white background
Free with trial A stylized icon depicting a global economic downturn with a gradient color scheme, set against a black background in a flat design. Decrease diagram vector vectors Global economic downturn icon with gradient design representing financial market decrease and loss. A stylized icon depicting a global economic downturn with a gradient color scheme, set against a black background in a flat design.
Free with trial A minimalist illustration showing a decreasing bar graph with an arrow, and a magnifying glass over a dollar sign. Flat style with grey and orange. Decrease diagram vector vectors Economic Downturn and Financial Analysis: Decrease Graph with Magnifying Glass Over Dollar Sign. A minimalist illustration showing a decreasing bar graph with an arrow, and a magnifying glass over a dollar sign. Flat style with grey and orange.
Free with trial A minimalist illustration of a graph showing a downward trend, accompanied by a cloud and sun, symbolizing economic decline or negative weather patterns. Decrease diagram vector vectors Vector art of a declining graph with a cloud and sun, representing economic downturn and negative trends. A minimalist illustration of a graph showing a downward trend, accompanied by a cloud and sun, symbolizing economic decline or negative weather patterns
Free with trial Reduction chart icon set depicting data reduction symbols, ideal for business analytics and performance visuals. Decrease diagram vector vectors Reduction chart icon set depicting data reduction symbols.Vector illustration. Reduction chart icon set depicting data reduction symbols, ideal for business analytics and performance visuals
Free with trial Finances statistics descending bars graphic outline icon in white and black colors. finances statistics descending bars graphic flat vector icon from business collection for web, mobile apps and ui. Decrease diagram vector vectors Finances statistics descending bars graphic outline icon in white and black colors. finances statistics descending bars graphic
Free with trial Stylized vector graphic featuring an upward arrow and percentage sign, connected by lines, demonstrating rising performance and decreasing rates against a dark background. Decrease diagram vector vectors Rising Performance and Decreasing Costs: Stylized Arrow and Percentage Icons Illustrating Financial Trends. Stylized vector graphic featuring an upward arrow and percentage sign, connected by lines, demonstrating rising performance and decreasing rates against a dark background.
Free with trial Business decline stage. Woman with laptop sits near falling graph. Financial recession and economic crisis. Bankruptcy and debts. Global inflation. Flat vector illustration. Decrease diagram vector vectors Business decline stage. Woman with laptop sits near falling graph. Financial recession and economic crisis. Bankruptcy
Free with trial A set of business and data analysis icons, perfect for presentations, reports, and dashboards. These icons cover various aspects of data management and reporting. Decrease diagram vector vectors Vector art of collection of business and data analysis icons, representing various aspects of data management and reporting. A set of business and data analysis icons, perfect for presentations, reports, and dashboards. These icons cover various aspects of data management and reporting
Free with trial Set of chart icons with dollar sign in even silhouette on a white background. The graph shows downward and upward trends. Vector. Decrease diagram vector vectors Set of graphic icons with dollar. Set of chart icons with dollar sign in even silhouette on a white background. The graph shows downward and upward trends. Vector
Free with trial A line art illustration shows a bar graph with arrows and a star on a purple background. It represents business growth, success, and achievement of goals. Decrease diagram vector vectors Vector art of line art illustration of a bar graph with arrows and a star on a purple background business growth concept. A line art illustration shows a bar graph with arrows and a star on a purple background. It represents business growth, success, and achievement of goals
Free with trial This image illustrates an economic downturn with a purple graph, downward arrow, and dollar sign, symbolizing financial crisis and market decline in a visual manner. Decrease diagram vector vectors Vector art of purple graph with a downward arrow and a dollar sign, indicating economic decline and financial crisis. This image illustrates an economic downturn with a purple graph, downward arrow, and dollar sign, symbolizing financial crisis and market decline in a visual manner
Free with trial This image showcases data analysis and cloud computing icons, including graphs, security, funnel, magnifying glass, error, and data processing, all in one visual. Decrease diagram vector vectors Vector art of data analysis and cloud computing icons, featuring graphs, security, funnel, magnifying glass, error, and data. This image showcases data analysis and cloud computing icons, including graphs, security, funnel, magnifying glass, error, and data processing, all in one visual
Free with trial Smartphone is displaying a simple line graph that is decreasing, suggesting negative performance. Decrease diagram vector vectors Smartphone showing decreasing bar graph icon vector outline. Smartphone is displaying a simple line graph that is decreasing, suggesting negative performance
Free with trial The worldwide market is currently facing a financial slowdown, marked by a decrease in currency value, increasing inflation rates, and an economic recession that is moving in a negative direction. Decrease diagram vector vectors Global market experiencing financial downturn, showing a currency decline, rising inflation, and economic recession with a. The worldwide market is currently facing a financial slowdown, marked by a decrease in currency value, increasing inflation rates, and an economic recession that is moving in a negative direction
Free with trial Change in Market equilibrium when demand, supply and price changes vector. Decrease diagram vector vectors Change in Market equilibrium when demand, supply and price changes
Free with trial Isometric graph with dollar sign. The graph shows a downward trend. Vector. Decrease diagram vector vectors Isometric graphic icon with dollar. Isometric graph with dollar sign. The graph shows a downward trend. Vector
Free with trial Dollar sign up and down arrow icon Vector symbol or sign set collection in black and white outline. Decrease diagram vector vectors Dollar sign up and down arrow icon mark in filled style. Dollar sign up and down arrow icon Vector symbol or sign set collection in black and white outline
Free with trial A set of twenty-two black chart icons, illustrating various graph types on a white background. The icons feature line graphs, bar graphs, and pie charts, each depicting trends such as growth, decline, and fluctuations. Magnifying glass icons are used to represent analysis. The charts convey concepts of data visualization, statistical analysis, and business metrics tracking. The minimalistic design is characterized by simple, clean lines and solid fill, suitable for use in reports, presentations, or digital interfaces. Decrease diagram vector vectors Increase and decrease glyph solid icons collection. A set of twenty-two black chart icons, illustrating various graph types on a white background. The icons feature line graphs, bar graphs, and pie charts, each depicting trends such as growth, decline, and fluctuations. Magnifying glass icons are used to represent analysis. The charts convey concepts of data visualization, statistical analysis, and business metrics tracking. The minimalistic design is characterized by simple, clean lines and solid fill, suitable for use in reports, presentations, or digital interfaces.
Free with trial Simple line graph illustration showing trend fluctuations, ideal for financial concepts. Decrease diagram vector illustrations Outline of ups and downs chart vector icon. Simple line graph illustration showing trend fluctuations, ideal for financial concepts
Free with trial Graph going Up and Down sign with green and red arrows vector. Flat design vector illustration concept of sales bar chart symbol icon with arrow moving down and sales bar chart with arrow moving up. Decrease diagram vector vectors Graph going Up and Down sign with green and red arrows vector. Flat design vector illustration concept of sales bar chart symbol. Graph going Up and Down sign with green and red arrows vector. Flat design vector illustration concept of sales bar chart symbol icon with arrow moving down and sales bar chart with arrow moving up.
Free with trial Simplified icon-style illustration of a business professional with financial reports and data on a black backdrop in a modern flat vector style. Decrease diagram vector vectors Business professional and financial data presented with a simplified stylized illustration on a black background. Simplified icon-style illustration of a business professional with financial reports and data on a black backdrop in a modern flat vector style.
Free with trial This image shows a colorful bar graph with a downward trend line, symbolizing decline, loss, or negative performance in a business or financial context on a white background. Decrease diagram vector vectors Vector art of colorful bar graph with downward trend line, depicting decline, loss, or negative performance in business or. This image shows a colorful bar graph with a downward trend line, symbolizing decline, loss, or negative performance in a business or financial context on a white background
Free with trial The concept of a decrease or increase in the bitcoin price after halving. Decrease diagram vector vectors Bitcoin price after Halving event. Vector illustration. The concept of a decrease or increase in the bitcoin price after halving.
Free with trial Up and Down sign with green and red arrows isolated on a blue background vector illustration. Concept of sales bar chart symbol icon with arrow moving down and sales bar chart with arrow moving up. Decrease diagram vector vectors Up and Down sign with green and red arrows vector illustration. Concept of sales bar chart symbol icon with arrows. Up and Down sign with green and red arrows isolated on a blue background vector illustration. Concept of sales bar chart symbol icon with arrow moving down and sales bar chart with arrow moving up.
Free with trial Up and Down sign with green and red arrows vector illustration. Concept of sales bar chart symbol icon with arrow moving down and sales bar chart with arrow moving up. Decrease diagram vector vectors Up and Down sign with green and red arrows vector illustration. Concept of sales bar chart symbol icon with arrows. Up and Down sign with green and red arrows vector illustration. Concept of sales bar chart symbol icon with arrow moving down and sales bar chart with arrow moving up.
Free with trial Up and Down sign with green and red arrows vector illustration. Concept of sales bar chart symbol icon with arrow moving down and sales bar chart with arrow moving up. Decrease diagram vector vectors Up and Down sign with green and red arrows vector illustration. Concept of sales bar chart symbol icon with arrows. Up and Down sign with green and red arrows vector illustration. Concept of sales bar chart symbol icon with arrow moving down and sales bar chart with arrow moving up.
Free with trial This image features financial analysis and cryptocurrency icons, including money, calculator, bear market, graphs, bitcoin, and a digital display, all in one place. Decrease diagram vector vectors Vector art of financial analysis and cryptocurrency icons, featuring money, calculator, bear market, graphs, bitcoin, and digital. This image features financial analysis and cryptocurrency icons, including money, calculator, bear market, graphs, bitcoin, and a digital display, all in one place
Free with trial A decreasing bar graph with a downward arrow and coin, symbolizing financial loss and economic decline. This image represents negative growth and market downturns. Decrease diagram vector vectors Vector art of decreasing bar graph with a downward arrow and coin, symbolizing financial loss and economic decline, , indicating. A decreasing bar graph with a downward arrow and coin, symbolizing financial loss and economic decline. This image represents negative growth and market downturns
Free with trial Graph going Up and Down sign with green and red arrows vector set. Flat design vector set of a concept of sales bar chart symbol icon with arrow moving down and sales bar chart with arrow moving up. Decrease diagram vector vectors Graph going Up and Down sign with green and red arrows vector set. Flat design vector set of a concept of sales bar chart arrows. Graph going Up and Down sign with green and red arrows vector set. Flat design vector set of a concept of sales bar chart symbol icon with arrow moving down and sales bar chart with arrow moving up.
Free with trial Graphic representation of declining business. Bar chart shows falling trend. Arrow points downwards. Silhouettes of people signify workforce reduction. Concept for economic downturn, negative growth, or company challenges. Decrease diagram vector illustrations Declining bar chart with downward arrow and silhouettes of people representing decrease in workforce or business performance loss. Graphic representation of declining business. Bar chart shows falling trend. Arrow points downwards. Silhouettes of people signify workforce reduction. Concept for economic downturn, negative growth, or company challenges
Free with trial Set line Drop in crude oil price, Tearing money banknote, Global economic crisis and Money bag. Business infographic template. Vector. Decrease diagram vector vectors Set line Drop in crude oil price, Tearing money banknote, Global economic crisis and Money bag. Business infographic
Free with trial Set line Many ways directional arrow Arrow Shopping bag with Sale Hierarchy organogram chart Delivery tracking Light bulb and Target icon. Vector. Decrease diagram vector vectors Set line Many ways directional arrow, Arrow, Shopping bag with Sale, Hierarchy organogram chart, Delivery tracking. Set line Many ways directional arrow Arrow Shopping bag with Sale Hierarchy organogram chart Delivery tracking Light bulb and Target icon. Vector.
Free with trial 3d Up and Down sign with red arrows vector collection. Design vector illustration concept of sales bar chart symbol icon set with arrow moving down and sales bar chart with arrow moving up. Decrease diagram vector vectors 3d Up and Down sign with red arrows vector collection. Design vector illustration concept of sales bar chart symbol icon set
Free with trial Glowing neon Global economic crisis icon isolated on brick wall background. World finance crisis. Neon light alphabet. Vector. Decrease diagram vector illustrations Glowing neon Global economic crisis icon isolated on brick wall background. World finance crisis. Neon light alphabet
Free with trial A simple infographic that schematically depicts the dynamics of the decline in offshore oil production. Vector illustration. Decrease diagram vector vectors The dynamics of the decline in offshore oil production in laconic infographics. A simple infographic that schematically depicts the dynamics of the decline in offshore oil production. Vector illustration.
Free with trial A simple infographic that schematically depicts the dynamics of the decline in offshore oil production. Vector illustration. Decrease diagram vector illustrations The dynamics of the decline in offshore oil production in laconic infographics. A simple infographic that schematically depicts the dynamics of the decline in offshore oil production. Vector illustration.
Free with trial Up and Down sign with blue and red arrows vector illustration. Concept of sales bar chart symbol icon with arrow moving down and sales bar chart with arrow moving up. Decrease diagram vector vectors Up and Down sign with blue and red arrows vector illustration. Concept of sales bar chart symbol
Free with trial Recession concept. Falling market. The trading broker is horrified at the falling market. Financial graph down. Vector illustration isometric design. Decrease diagram vector vectors Recession concept. Falling market. The trading broker is horrified at the falling market.
Free with trial A simple infographic that schematically depicts the dynamics of the decline in oil production in the world. Vector illustration. Decrease diagram vector illustrations The dynamics of the decline in oil production in laconic infographics. A simple infographic that schematically depicts the dynamics of the decline in oil production in the world. Vector illustration.
Free with trial Clean and simple abstract infographic about decreasing supply of natural gas. Vector illustration. Decrease diagram vector vectors A simple infographic about declining natural gas supply. Clean and simple abstract infographic about decreasing supply of natural gas. Vector illustration.
Free with trial Collagen production in women based on age. Medical, healthcare infographics. Important information. Menopause problem. Editable vector illustration isolated on a white background. Horizontal banner. Decrease diagram vector vectors Collagen production in women based on age. Medical, healthcare infographics.
Free with trial Businessman's hand lowers the graph. Manipulation in the financial market. Declining graph. Vector illustration flat design. Isolated on white background. Downward arrow. Decrease diagram vector vectors Businessman's hand lowers the graph. Manipulation in the financial market. Businessman's hand lowers the graph. Manipulation in the financial market. Declining graph. Vector illustration flat design. Isolated on white background. Downward arrow.
Free with trial A simple infographic depicting the decline in demand for natural gas. Vector illustration. Decrease diagram vector illustrations Abstract infographic of decreasing demand for natural gas. A simple infographic depicting the decline in demand for natural gas. Vector illustration.
Free with trial A simple infographic depicting the decline in demand for natural gas. Vector illustration. Decrease diagram vector vectors Abstract infographic of decreasing demand for natural gas. A simple infographic depicting the decline in demand for natural gas. Vector illustration.
Free with trial Black Searching for food in trash can on streets outdoors icon isolated on white background. Homelessness and poverty concept. Vector. Decrease diagram vector illustrations Black Searching for food in trash can on streets outdoors icon isolated on white background. Homelessness and poverty
Free with trial Clean and simple abstract infographic about falling prices in the oil industry. Vector illustration. Decrease diagram vector illustrations A simple infographic about falling oil industry prices. Clean and simple abstract infographic about falling prices in the oil industry. Vector illustration.
Free with trial Up and Down sign with green and red arrows vector illustration. Concept of sales bar chart symbol icon with arrow moving down and sales bar chart with arrow moving up. Decrease diagram vector vectors Up and Down sign with green and red arrows vector illustration. Concept of sales bar chart symbol icon with arrows. Up and Down sign with green and red arrows vector illustration. Concept of sales bar chart symbol icon with arrow moving down and sales bar chart with arrow moving up.
Free with trial Abstract green dotted financial graph chart sparkling background. Vector minimal tech design. Decrease diagram vector vectors Abstract green dotted financial graph chart sparkling background
Free with trial Recession economic downturn coins stacks declining red arrow financial crisis chart blue background infographic banner Vector illustration. Decrease diagram vector vectors Recession economic downturn coins stacks declining red arrow financial crisis chart blue background infographic banner
Free with trial Scissors cutting financial chart economic crisis downturn coins graph falling trend abstract background website banner Vector illustration. Decrease diagram vector vectors Scissors cutting financial chart economic crisis downturn coins graph falling trend abstract background website banner