Free with trial Bar chart representation of data increase growth and finance. Data analysis. Decrease diagram vector vectors Bar chart representation of data increase growth and finance. Data analysis
Free with trial Black silhouette of descending bar chart with arrow, isolated on white background. concept of financial decline, statistics, economic downturn, data analysis, business graph. Decrease diagram vector vectors Black silhouette of descending bar chart with arrow, isolated on white background. concept of financial decline, statistics
Free with trial A simple bar graph illustrating upward growth and financial success. Ideal for presentations, reports, and website use. Decrease diagram vector vectors Upward Trending Bar Graph: Business Growth and Financial Success. A simple bar graph illustrating upward growth and financial success. Ideal for presentations, reports, and website use.
Free with trial 3d blue magnifying glass with downward-trending chart inside Financial analysis, economic decline, risk assessment, market monitoring, investment evaluation concept Low poly digital futuristic Vector. Decrease diagram vector vectors 3d blue magnifying glass with downward-trending chart inside Financial analysis, economic decline, risk assessment
Free with trial Analyze the crash in the stock market crash. Learn from investment failure mistakes. Assess the damage from the business sector. Experts find the cause of the stock chart fall. Decrease diagram vector vectors Analyze the crash in the stock market crash. Learn from investment failure mistakes. Assess the damage from the business
Free with trial A minimalist graphic featuring a green footprint icon next to a downward-pointing arrow. The image is clean and simple, set against a white background. This design can represent various concepts such as progress, direction, or a decline. Suitable for use in educational materials, infographics, websites, or presentations related to movement, steps, or downward trends. Decrease diagram vector illustrations Footprint and Down Arrow Icon. A minimalist graphic featuring a green footprint icon next to a downward-pointing arrow. The image is clean and simple, set against a white background. This design can represent various concepts such as progress, direction, or a decline. Suitable for use in educational materials, infographics, websites, or presentations related to movement, steps, or downward trends.
Free with trial Business graph with up arrow down arrow logo template. Decrease diagram vector vectors Business graph with up arrow down arrow logo template
Free with trial Displaying dashboard grid showing fluctuating blue and red line graphs with metallic green sphere. Analytics, investment, data visualization, technology, finance, bar chart, dashboard. Decrease diagram vector illustrations Displaying dashboard grid showing fluctuating blue and red line graphs with metallic green sphere
Free with trial Illustration of a business activities. Decrease diagram vector vectors Illustration of a business activities
Free with trial Illustration of a business activities. Decrease diagram vector vectors Illustration of a business activities
Free with trial Illustration of a business activities. Decrease diagram vector vectors Illustration of a business activities
Free with trial Illustration of a business activities. Decrease diagram vector vectors Illustration of a business activities
Free with trial Illustration of a business activities. Decrease diagram vector vectors Illustration of a business activities
Free with trial A vibrant and modern illustration of a bar graph, featuring four bars of varying heights and colors: blue, green, orange, and red. The bars are positioned on a gray horizontal line, creating a sense of data comparison and visual hierarchy. This image is ideal for representing data, statistics, business reports, financial analysis, or any concept requiring visual data representation. The clean design and bright colors make it suitable for presentations, websites, and marketing materials. Decrease diagram vector illustrations Colorful Bar Graph Illustration. A vibrant and modern illustration of a bar graph, featuring four bars of varying heights and colors: blue, green, orange, and red. The bars are positioned on a gray horizontal line, creating a sense of data comparison and visual hierarchy. This image is ideal for representing data, statistics, business reports, financial analysis, or any concept requiring visual data representation. The clean design and bright colors make it suitable for presentations, websites, and marketing materials.
Free with trial Graph with a red heart at the start and downward trend line, symbolizing breakup, relationship decline, and emotional loss over time. Decrease diagram vector vectors Graph with a red heart at the start and downward trend line, symbolizing breakup, relationship decline, and emotional loss over
Free with trial This illustration shows a downward trend for the US dollar and an upward trend for the Japanese Yen, generated by AI. The graphic uses stylized gold coins with currency symbols and directional arrows to clearly visualize the contrasting market movements. Decrease diagram vector illustrations USD vs. Yen: Currency Fluctuation. This illustration shows a downward trend for the US dollar and an upward trend for the Japanese Yen, generated by AI. The graphic uses stylized gold coins with currency symbols and directional arrows to clearly visualize the contrasting market movements.
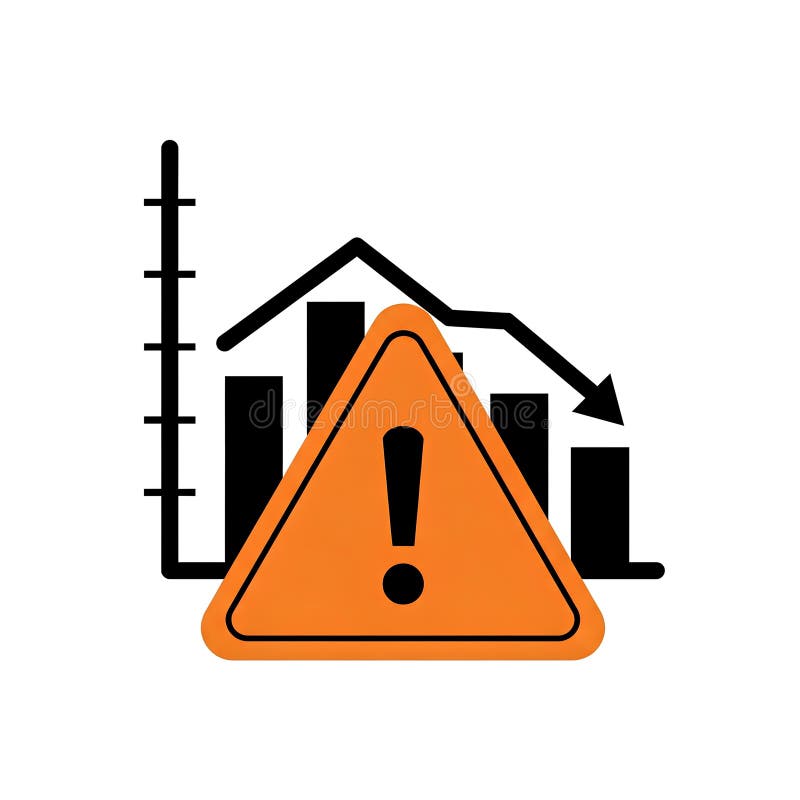
Free with trial Illustration of a downward trending graph with an orange warning sign in the foreground. The graph depicts a decline in performance or value. The warning sign highlights potential risks or negative outcomes. This image can be used to represent financial loss, economic downturn, business failure, or any situation where caution is advised. Decrease diagram vector illustrations Warning Sign with Declining Graph. Illustration of a downward trending graph with an orange warning sign in the foreground. The graph depicts a decline in performance or value. The warning sign highlights potential risks or negative outcomes. This image can be used to represent financial loss, economic downturn, business failure, or any situation where caution is advised.
Free with trial A simple black silhouette of a bar chart with varying heights on a white background. The icon represents data analysis and statistical representation. Decrease diagram vector vectors Bar chart icon for data analysis and statistics graph. A simple black silhouette of a bar chart with varying heights on a white background. The icon represents data analysis and statistical representation
Free with trial Abstract illustration of business growth, featuring bar graphs and line graphs in shades of blue and grey. The image conveys concepts of data analysis, progress, and financial performance. Suitable for presentations, reports, and marketing materials related to business, finance, and technology. Decrease diagram vector illustrations Abstract Business Growth Chart. Abstract illustration of business growth, featuring bar graphs and line graphs in shades of blue and grey. The image conveys concepts of data analysis, progress, and financial performance. Suitable for presentations, reports, and marketing materials related to business, finance, and technology.
Free with trial Graph of oscillating line with horizontal line and arrow isolated on white background. Decrease diagram vector vectors Graph of oscillating line with horizontal line and arrow isolated on white background
Free with trial Data Stats Board Display Line Icon Downward Down Trend Statistic Performance Market Decline Economy Downturn Bar Graph Progress Outline Presentation. Decrease diagram vector vectors Data Stats Board Display Line Icon Downward Down Trend Statistic Performance Market Decline Economy Downturn Bar Graph
Free with trial Layered Funnel Chart with Segments in Different Blue Shades. Decrease diagram vector vectors Layered Funnel Chart with Segments in Different Blue Shades
Free with trial Blue footprint with CO2 label and arrow pointing down beside linear clouds. Ideal for climate action, sustainability, environmental awareness, emissions, carbon neutral goals, clean energy, eco. Decrease diagram vector illustrations Carbon Footprint Reduction Concept with Blue Footprint, CO2 Label, and Falling Arrow. Blue footprint with CO2 label and arrow pointing down beside linear clouds. Ideal for climate action, sustainability, environmental awareness, emissions, carbon neutral goals, clean energy, eco
Free with trial Black bars decreasing in height diagonally on a white background, representing a downward trend or decline. Decrease diagram vector illustrations Black bars decreasing in height diagonally on a white background bar chart graph. Black bars decreasing in height diagonally on a white background, representing a downward trend or decline
Free with trial Modern collection of business and finance elements. Contains data, charts,diagrams. Use it for presentation, report and infographic projects. Decrease diagram vector vectors Set of Business and Finance Infographic Elements on Transparent Background Vectors. Modern collection of business and finance elements. Contains data, charts,diagrams. Use it for presentation, report and infographic projects
Free with trial A black line graph with two curves showing a downward trend on a white background. Decrease diagram vector illustrations Black line graph showing a downward trend with two lines on white background chart. A black line graph with two curves showing a downward trend on a white background
Free with trial This image features a minimalist black and white bar graph icon, depicting data analysis. It includes vertical bars of varying heights along horizontal and vertical axes. Decrease diagram vector vectors Simple Black and White Bar Graph Icon for Data Visualization. This image features a minimalist black and white bar graph icon, depicting data analysis. It includes vertical bars of varying heights along horizontal and vertical axes.
Free with trial Data Stats Board Display Icon Downward Down Trend Statistic Performance Market Decline Economy Downturn Bar Graph Progress Sign Symbol Presentation. Decrease diagram vector vectors Data Stats Board Display Icon Downward Down Trend Statistic Performance Market Decline Economy Downturn Bar Graph Progress
Free with trial Declining Bar Chart Shows Economic Downturn Illustration Red Arrow Signifies Loss Trend. Decrease diagram vector vectors Declining Bar Chart Shows Economic Downturn Illustration Red Arrow Signifies Loss Trend
Free with trial Estrogen and testosterone level measuring using indicator with different male and female silhouettes showing hormone increasing and decreasing, healthcare and medical concept. Decrease diagram vector vectors Indicator is showing estrogen and testosterone level increasing and decreasing. Estrogen and testosterone level measuring using indicator with different male and female silhouettes showing hormone increasing and decreasing, healthcare and medical concept
Free with trial Declining business graph chart showing downward trend in finances. Decrease diagram vector vectors Declining business graph chart showing downward trend in finances
Free with trial A minimalist dark gray bar chart on a white background displays varying heights, illustrating data fluctuations and trends. Decrease diagram vector illustrations Simple bar chart showing increasing and decreasing data trends. A minimalist dark gray bar chart on a white background displays varying heights, illustrating data fluctuations and trends
Free with trial Downward trending bar graph with a black arrow, representing losses. Decrease diagram vector vectors Downward trending bar graph with a black arrow, representing losses
Free with trial Declining Bar Graph with Arrow Showing Increase and Downward Trend. Decrease diagram vector vectors Declining Bar Graph with Arrow Showing Increase and Downward Trend
Free with trial Colorful bar graph with downward trend, business concept illustration. Decrease diagram vector vectors Colorful bar graph with downward trend, business concept illustration
Free with trial A black curved shape descending towards a horizontal line on a white background, symbolizing decline. Decrease diagram vector illustrations Curved Black Shape Descending Towards a Horizontal Line on White Background Keywords: curve. A black curved shape descending towards a horizontal line on a white background, symbolizing decline
Free with trial A bar graph with descending blue, yellow, and red bars, accompanied by a downward-pointing arrow, symbolizes economic decline or negative trends on a clean white background. Decrease diagram vector illustrations Colorful Bar Graph with Downward Arrow Illustrating Economic Decline. A bar graph with descending blue, yellow, and red bars, accompanied by a downward-pointing arrow, symbolizes economic decline or negative trends on a clean white background
Free with trial An upward trending line graph showcases data points increasing, symbolizing growth and progress. The visual represents success, development, and positive statistics. Decrease diagram vector vectors Positive Trend Graph, Data Points Rising Upward. An upward trending line graph showcases data points increasing, symbolizing growth and progress. The visual represents success, development, and positive statistics.
Free with trial Blue flat visualization showing bar chart and downward arrow over data grid with world map overlay. Analytics, finance, data analysis, digital, infographic, corporate, trend. Decrease diagram vector illustrations Blue flat visualization showing bar chart and downward arrow over data grid with world map overlay
Free with trial Growth and decline arrow graph icon. Up and down arrows symbol illustration. Decrease diagram vector vectors Growth and decline arrow graph icon. Up and down arrows symbol
Free with trial A man is pointing at a stock chart with a sell indicator and a downward arrow, indicating a potential downward trend in the market. Decrease diagram vector vectors Man pointing at sell chart with downward arrow indicator. a man is pointing at a stock chart with a sell indicator and a downward arrow, indicating a potential downward trend in the market.
Free with trial A colorful graph with the words Net Income written below it. The graph is made up of many different colored lines and dots. Decrease diagram vector illustrations A colorful graph with the words Net Income written below it
Free with trial Falling trend sketch of business finance graph with bar charts and arrow. Decrease diagram vector illustrations Falling trend sketch of business finance graph with bar charts and arrow
Free with trial Isometric illustration of a woman analyzing a graph with a magnifying glass, laptop, and coins, representing finance and business analysis. Decrease diagram vector vectors Woman analyzes graph with magnifying glass and laptop coin. isometric illustration of a woman analyzing a graph with a magnifying glass, laptop, and coins, representing finance and business analysis.
Free with trial Simple line graph illustrating data points and trends. Ideal for presentations, reports, and infographics related to business analysis, market research, or financial reporting. Decrease diagram vector vectors Simple Line Graph, Data Visualization, Business Chart. Simple line graph illustrating data points and trends. Ideal for presentations, reports, and infographics related to business analysis, market research, or financial reporting.
Free with trial View of Graphs showing declining CO₂ emissions. Decrease diagram vector illustrations Graphs showing declining CO₂ emissions
Free with trial A cartoon Bitcoin character is presenting a chart showing cryptocurrency market trends. The image is suitable for illustrating financial news, investment advice, or educational materials about Bitcoin and the crypto market. Decrease diagram vector illustrations Bitcoin Cartoon Character Explaining Crypto Market Trends. A cartoon Bitcoin character is presenting a chart showing cryptocurrency market trends. The image is suitable for illustrating financial news, investment advice, or educational materials about Bitcoin and the crypto market.
Free with trial Illustration of a hand holding a magnifying glass over a financial chart showing business growth and success. The image represents data analysis, investment strategy, and market trends in a visually appealing way. Decrease diagram vector illustrations Business Growth Analysis Magnifying Glass on Financial Chart. Illustration of a hand holding a magnifying glass over a financial chart showing business growth and success. The image represents data analysis, investment strategy, and market trends in a visually appealing way.
Free with trial A colorful bar graph with a line graph overlayed on a blue background. it shows data trends and market analysis in a simple visual format. Decrease diagram vector vectors Colorful bar graph with a line graph on a blue background. a colorful bar graph with a line graph overlayed on a blue background. it shows data trends and market analysis in a simple visual format
Free with trial Design dehydration water droplet with half water insisiting dehration concept medical illustration icon. Decrease diagram vector illustrations Dehydration water droplet with half water insisiting dehration concept medical illustration icon
Free with trial Black outline of descending bar chart with downward arrow, isolated on white background. concept of economic decline, data analysis, financial crisis, statistics. Decrease diagram vector vectors Black outline of descending bar chart with downward arrow, isolated on white background. concept of economic decline, data
Free with trial This image shows two bar graphs. One shows an upward trend with an arrow pointing up. The other shows a downward trend with an arrow pointing down. Black and white. Decrease diagram vector illustrations Black and white illustration showing upward and downward trending bar graphs with arrows pointing up down. This image shows two bar graphs. One shows an upward trend with an arrow pointing up. The other shows a downward trend with an arrow pointing down. Black and white.
Free with trial Percentage with arrow up and down. Percentage arrow with percent sign. Design concept for banking, credit, interest rate, finance and money sphere. Decrease diagram vector vectors Percentage with arrow up and down. Percentage arrow with percent sign.
Free with trial Falling bar chart with up and right arrows illustrating declining business trends. Decrease diagram vector vectors Falling bar chart with up and right arrows illustrating declining business trends
Free with trial Abstract design featuring flowing red and blue waves on the right side. The background is a gradient of grayish white with dotted patterns that gradually decrease in size, creating a sense of depth and movement. The color contrast highlights the dynamic curves against the subtle background, ideal for contemporary graphic design projects or digital interfaces. Decrease diagram vector vectors Blue red abstract waves background design images. Abstract design featuring flowing red and blue waves on the right side. The background is a gradient of grayish white with dotted patterns that gradually decrease in size, creating a sense of depth and movement. The color contrast highlights the dynamic curves against the subtle background, ideal for contemporary graphic design projects or digital interfaces.
Free with trial A minimalist cartoon-style illustration on a white background depicts a green horseshoe-shaped symbol on the left with two arrows pointing toward it, one green arrow entering from the left and a larger red arrow exiting to the right, pointing downward to signify a decreasing trend in cancer diagnoses, while a second red arrow points upward, creating a contrast that visually communicates changing. Decrease diagram vector illustrations Cancer diagnosis decline concept with arrows and horseshoe shape. A minimalist cartoon-style illustration on a white background depicts a green horseshoe-shaped symbol on the left with two arrows pointing toward it, one green arrow entering from the left and a larger red arrow exiting to the right, pointing downward to signify a decreasing trend in cancer diagnoses, while a second red arrow points upward, creating a contrast that visually communicates changing
Free with trial A simple bar chart and line graph with a downward arrow illustrates a negative trend like recession or business failure ideal for financial reports about crisis or loss. Decrease diagram vector illustrations Declining Blue Bar Chart and Line Graph Showing Financial Loss on Gray Background. A simple bar chart and line graph with a downward arrow illustrates a negative trend like recession or business failure ideal for financial reports about crisis or loss
Free with trial Growth and decline chart icon. Green upward and red downward arrow symbol illustration. Decrease diagram vector vectors Growth and decline chart icon. Green upward and red downward arrow symbol
Free with trial Business data is visually represented in black and white through various charts and graphs illustrating growth analysis and strategic planning for financial reporting showing a clear picture of market. Decrease diagram vector vectors Black and white business data visualization with charts and graphs showing growth and analysis for financial reporting and. Business data is visually represented in black and white through various charts and graphs illustrating growth analysis and strategic planning for financial reporting showing a clear picture of market
Free with trial Business growth and loss icon. Bar chart with rising and falling arrow symbol illustration. Decrease diagram vector vectors Business growth and loss icon. Bar chart with rising and falling arrow symbol
Free with trial A vibrant bar graph shows an upward trend with a green arrow, indicating growth. The bars are blue, yellow, green, and red, set against a clean white background. Decrease diagram vector illustrations Colorful Bar Graph with Upward Trend Line and Green Arrow Indicator on White Background. A vibrant bar graph shows an upward trend with a green arrow, indicating growth. The bars are blue, yellow, green, and red, set against a clean white background
Free with trial Illustration of economic growth is depicted by a green staircase ascending toward light, symbolizing progress and increased prosperity. Decrease diagram vector vectors Illustration of economic growth is depicted by a green staircase ascending toward light
Free with trial Flat design business icons depict various charts, percentage signs, targets, hierarchical diagrams, and coin stacks representing financial growth and data analysis in monochrome. Generative AI. Decrease diagram vector vectors Black and white flat design business icons including charts percentage target and money stacks illustrating financial growth and. Flat design business icons depict various charts, percentage signs, targets, hierarchical diagrams, and coin stacks representing financial growth and data analysis in monochrome. Generative AI
Free with trial Layered hearts design featuring three overlapping hearts in various shades of pink and red, arranged vertically. The hearts decrease in size from bottom to top, creating a layered look. The colors transition from a light pink at the bottom to a deeper red at the top. The white background enhances the simplicity and clarity of the icon, making it effective for visual communications related to love or affection. Decrease diagram vector vectors Layered Heart Love Icon. Layered hearts design featuring three overlapping hearts in various shades of pink and red, arranged vertically. The hearts decrease in size from bottom to top, creating a layered look. The colors transition from a light pink at the bottom to a deeper red at the top. The white background enhances the simplicity and clarity of the icon, making it effective for visual communications related to love or affection.
Free with trial Financial arrows up and down icon on circle. Growth and decline graph sign symbol illustration. Decrease diagram vector vectors Financial arrows up and down icon on circle. Growth and decline graph sign symbol
Free with trial Abstract stipple gradient design features a central dark square with edges radiating outward, creating a 3D illusion. The pattern uses densely packed small dots that gradually decrease in density towards the edges, forming a tunnel-like effect. The shading transitions smoothly from deep navy at the center to lighter tones at the outer sections, giving a sense of depth and movement. The background is a light, neutral color, enhancing the contrast and giving prominence to the stipple effect. Decrease diagram vector illustrations Abstract Stipple Gradient Square Background Design. Abstract stipple gradient design features a central dark square with edges radiating outward, creating a 3D. Abstract stipple gradient design features a central dark square with edges radiating outward, creating a 3D illusion. The pattern uses densely packed small dots that gradually decrease in density towards the edges, forming a tunnel-like effect. The shading transitions smoothly from deep navy at the center to lighter tones at the outer sections, giving a sense of depth and movement. The background is a light, neutral color, enhancing the contrast and giving prominence to the stipple effect.
Free with trial A cartoon illustration of a man interacting with a bar chart. The man is depicted in a simple, clean style, wearing a blue shirt and brown pants. He is holding a green bar, seemingly adjusting or interacting with the colorful bars displayed on a table. The illustration is suitable for conveying concepts related to data analysis, business, finance, and presentation. Decrease diagram vector illustrations Cartoon Man and Bar Chart. A cartoon illustration of a man interacting with a bar chart. The man is depicted in a simple, clean style, wearing a blue shirt and brown pants. He is holding a green bar, seemingly adjusting or interacting with the colorful bars displayed on a table. The illustration is suitable for conveying concepts related to data analysis, business, finance, and presentation.
Free with trial Description: Simple line art illustration of a scatter plot graph showing an uneven distribution of data points. Perfect for presentations or reports. Decrease diagram vector vectors Abstract Data Visualization: Scatter Plot Chart with Irregular Data Points. Description: Simple line art illustration of a scatter plot graph showing an uneven distribution of data points. Perfect for presentations or reports.
Free with trial A bold line graph icon displays business data with trend analysis, featuring circles marking data points and horizontal lines indicating value levels. Decrease diagram vector vectors Bold Line Graph Icon: Business Data Visualization with Trend Analysis. A bold line graph icon displays business data with trend analysis, featuring circles marking data points and horizontal lines indicating value levels
Free with trial Up and down curved arrow chart icon illustration. Business trend bar symbol in black circle. Decrease diagram vector vectors Up and down curved arrow chart icon. Business trend bar symbol in black circle
Free with trial Stylized illustration depicts a black, downward-trending arrow within a graph framework, set against a solid pastel yellow background. The image is suitable for conveying concepts related to market decline, financial downturns, or negative trends in various business or editorial contexts, lending itself well to presentations or reports. Decrease diagram vector illustrations Downward trend arrow graph illustrates market decline and business loss. Stylized illustration depicts a black, downward-trending arrow within a graph framework, set against a solid pastel yellow background. The image is suitable for conveying concepts related to market decline, financial downturns, or negative trends in various business or editorial contexts, lending itself well to presentations or reports
Free with trial A modern, clean isometric illustration showcasing various data visualizations. Multiple charts and graphs, including bar charts, line graphs, and pie charts, are displayed on floating screens, representing data analysis, business intelligence, or financial reporting. Ideal for presentations, reports, or website banners related to data-driven concepts. Decrease diagram vector illustrations Isometric 3D Data Visualization: Charts and Graphs on Floating Screens. A modern, clean isometric illustration showcasing various data visualizations. Multiple charts and graphs, including bar charts, line graphs, and pie charts, are displayed on floating screens, representing data analysis, business intelligence, or financial reporting. Ideal for presentations, reports, or website banners related to data-driven concepts.
Free with trial Decreasing Coin Stacks with Red Arrow Showcasing Financial Loss or Negative Trend Illustration. Decrease diagram vector illustrations Decreasing Coin Stacks with Red Arrow Showcasing Financial Loss or Negative Trend Illustration
Free with trial Mobile phone screen displaying a cryptocurrency trading application for Bitcoin. The interface shows a financial candlestick chart with growth analysis, a Bitcoin coin icon, and a fingerprint scanner for secure transactions. Vector illustration isolated on white background. Decrease diagram vector illustrations Smartphone with Bitcoin cryptocurrency trading app interface on screen showing financial chart and fingerprint security. Mobile phone screen displaying a cryptocurrency trading application for Bitcoin. The interface shows a financial candlestick chart with growth analysis, a Bitcoin coin icon, and a fingerprint scanner for secure transactions. Vector illustration isolated on white background
Free with trial A simple yet effective graphic representing a negative trend or declining business chart, perfect for illustrating downward data or economic downturn. Decrease diagram vector vectors Negative Trend Graph, Decreasing Business Chart, Downward Data Illustration. A simple yet effective graphic representing a negative trend or declining business chart, perfect for illustrating downward data or economic downturn.
Free with trial Growth and decline bar chart icon in flat style. Upward and downward arrow graph symbol illustration. Decrease diagram vector vectors Growth and decline bar chart icon in flat style. Upward and downward arrow graph symbol
Free with trial A creative business and marketing illustration perfect for branding, presentations, and digital projects. Available in AI, EPS, PNG, SVG, and Figma. Decrease diagram vector vectors A sketchy style illustration showing a market failure. A creative business and marketing illustration perfect for branding, presentations, and digital projects. Available in AI, EPS, PNG, SVG, and Figma.
Free with trial A simple flat icon vector illustration of two hands adjusting a simple chart with a downturn arrow, symbolizing risk mitigation in a business setting. The simple chart with a downturn arrow is orange with dark gray elements, indicating loss control. White background. Minimalist style with sharp edges and no shadows. Orange and Gray color palette. Vector graphics with rounded corners. High. Decrease diagram vector illustrations Business Downturn Graph Two Hands Hold Downward Trend Chart. A simple flat icon vector illustration of two hands adjusting a simple chart with a downturn arrow, symbolizing risk mitigation in a business setting. The simple chart with a downturn arrow is orange with dark gray elements, indicating loss control. White background. Minimalist style with sharp edges and no shadows. Orange and Gray color palette. Vector graphics with rounded corners. High
Free with trial A set of ten different downward-pointing arrow icons in black and white. The arrows vary in style, including solid, outlined, geometric, and abstract designs. Perfect for use in presentations, websites, infographics, and other design projects where a visual cue for direction or download is needed. The diverse styles offer flexibility for different aesthetic preferences and design contexts. Decrease diagram vector vectors Collection of Downward Arrow Icons. A set of ten different downward-pointing arrow icons in black and white. The arrows vary in style, including solid, outlined, geometric, and abstract designs. Perfect for use in presentations, websites, infographics, and other design projects where a visual cue for direction or download is needed. The diverse styles offer flexibility for different aesthetic preferences and design contexts.
Free with trial An infographic illustrating the process of groundwater depletion, showing the water table before and after depletion, with a cross-section of the soil and grass above. The image highlights the decrease in the water table level due to excessive groundwater extraction. Decrease diagram vector vectors Groundwater Depletion Illustration. An infographic illustrating the process of groundwater depletion, showing the water table before and after depletion, with a cross-section of the soil and grass above. The image highlights the decrease in the water table level due to excessive groundwater extraction.