Free with trial Illustration of a growing energy independence with a simple oil barrel with a decreasing sign, a solar panel receiving sun, and a stylized wind turbine. Vector flat icon design on a white background for a resource transition illustration --chaos 30 --ar 16:9 --v 7 Job ID: 592d63c7-ea9f-4b58-8aae-19f2fa4830a1. Decrease diagram vector illustrations Energy Transition Solar, Wind, Oil Barrel, and Falling Market Graph. Illustration of a growing energy independence with a simple oil barrel with a decreasing sign, a solar panel receiving sun, and a stylized wind turbine. Vector flat icon design on a white background for a resource transition illustration --chaos 30 --ar 16:9 --v 7 Job ID: 592d63c7-ea9f-4b58-8aae-19f2fa4830a1
Free with trial A cartoon-style illustration of a bar graph displayed on a presentation screen. The graph shows three bars of different heights and colors (green, orange, and yellow), indicating growth or progress. The image is clean and simple, suitable for illustrating business, finance, or educational concepts in a visually appealing way. Decrease diagram vector illustrations Cartoon Bar Graph Presentation. A cartoon-style illustration of a bar graph displayed on a presentation screen. The graph shows three bars of different heights and colors (green, orange, and yellow), indicating growth or progress. The image is clean and simple, suitable for illustrating business, finance, or educational concepts in a visually appealing way.
Free with trial A clean line drawing showcases a magnifying glass focusing on a hand holding a declining bar graph with a downward. Decrease diagram vector illustrations Declining Market Analysis Magnifying Glass on Loss Trend. A clean line drawing showcases a magnifying glass focusing on a hand holding a declining bar graph with a downward.
Free with trial A flat illustration of business graphs and charts showing analysis results. Featuring clean design and vibrant color scheme. Decrease diagram vector vectors Colorful business graph and chart flat style design. A flat illustration of business graphs and charts showing analysis results. Featuring clean design and vibrant color scheme.
Free with trial A flat design bar chart displays a downward trend, highlighted by a red arrow. Minimalist graphic, illustrative style. Decrease diagram vector vectors Flat bar chart showing downward trend with red arrow. A flat design bar chart displays a downward trend, highlighted by a red arrow. Minimalist graphic, illustrative style.
Free with trial Line graph illustrating data analysis and business statistics, charting financial growth, market changes, and performance metrics for visual information and infographic content. Decrease diagram vector illustrations Analyzing data with line graph showing business trends. Line graph illustrating data analysis and business statistics, charting financial growth, market changes, and performance metrics for visual information and infographic content
Free with trial A set of financial growth and decline chart icons featuring up and down arrows with colorful bars, indicating economic trends. the concept of financial market increases, decreases and fluctuations. Decrease diagram vector vectors Set of Financial Fluctuation Chart Icons in Flat Design. A set of financial growth and decline chart icons featuring up and down arrows with colorful bars, indicating economic trends. the concept of financial market increases, decreases and fluctuations
Free with trial A simple black and white logo of the minimalist form of a stylized shield with a single upward-pointing arrow inside, no background, flat design, vector illustration style, minimalist art, symmetrical balance, centered composition, high resolution, no shadows, no detail, high contrast, sharp edges, high definition. The colors should be monochromatic with shades of dark gray. It is designed to. Decrease diagram vector illustrations Dark Down Arrow Icon on Light Gray Background, Simple Geometric Shape. A simple black and white logo of the minimalist form of a stylized shield with a single upward-pointing arrow inside, no background, flat design, vector illustration style, minimalist art, symmetrical balance, centered composition, high resolution, no shadows, no detail, high contrast, sharp edges, high definition. The colors should be monochromatic with shades of dark gray. It is designed to
Free with trial A line art icon depicting business performance analysis. Decrease diagram vector illustrations Gear, Chart, Envelope Business Performance Analysis Icon. A line art icon depicting business performance analysis.
Free with trial A stylized illustration of a descending bar graph within a website window, rendered in a flat, minimalist design. Decrease diagram vector vectors Decreasing bar graph inside a website window interface. A stylized illustration of a descending bar graph within a website window, rendered in a flat, minimalist design.
Free with trial Two opposing arrows, a clock, and a growth chart with an upward trend. Ideal for business, productivity, time management, performance, progress efficiency and decision-making. A simple flat. Decrease diagram vector illustrations Upward and Downward Arrows with Clock and Growth Chart Representing Time and Progress. Two opposing arrows, a clock, and a growth chart with an upward trend. Ideal for business, productivity, time management, performance, progress efficiency and decision-making. A simple flat
Free with trial Price drop icon, lower cost reduction. Loss market sale concept, discount sign. Decrease diagram vector vectors Price drop icon, lower cost reduction. Loss market sale concept
Free with trial An investor holds his head as a stock market chart arrow crashes down into the dirt in a 3-d illustration. Decrease diagram vector illustrations An investor holds his head as a stock market chart arrow crashes down into the dirt
Free with trial Flat design illustration showing downward trend with graph, coins and descending arrow. Demonstrates financial loss and market decline. Decrease diagram vector vectors Declining financial graph with downward trend and currency. Flat design illustration showing downward trend with graph, coins and descending arrow. Demonstrates financial loss and market decline.
Free with trial Dark blue downward pointing arrow against black backdrop. Flat graphic style. Clean and minimal with emphasis on direction and simplicity. Decrease diagram vector vectors Dark blue arrow pointing downward on black background image. Dark blue downward pointing arrow against black backdrop. Flat graphic style. Clean and minimal with emphasis on direction and simplicity.
Free with trial A simplified flat style icon displays a declining bar graph with arrow. Focuses on business and financial themes. Decrease diagram vector vectors Flat icon illustration showing bar chart trending downwards. A simplified flat style icon displays a declining bar graph with arrow. Focuses on business and financial themes.
Free with trial A flat design shows a bar graph depicting decreasing sales, with a downward trending red arrow. Decrease diagram vector vectors Decreasing Business Chart Shows a Dramatic Downturn in Sales. A flat design shows a bar graph depicting decreasing sales, with a downward trending red arrow.
Free with trial A clean, minimalist illustration of a blue bar chart on a black backdrop, simple and effective visual for data presentation. Decrease diagram vector vectors Minimalist blue bar chart illustration on a black background. A clean, minimalist illustration of a blue bar chart on a black backdrop, simple and effective visual for data presentation.
Free with trial A flat style graph depicting a downward trend with declining bars and arrow. Strong use of contrasting colors. Decrease diagram vector vectors Declining bar graph showing negative trend with falling arrow. A flat style graph depicting a downward trend with declining bars and arrow. Strong use of contrasting colors.
Free with trial Financial chart declining towards a moneybag. A simple flat design in blue and yellow tones. Decrease diagram vector vectors Decline of financial market represented by graph and moneybag. Financial chart declining towards a moneybag. A simple flat design in blue and yellow tones.
Free with trial Colorful pie chart is showing positive statistics and business growth, target and financial analysis and marketing report, data with copy space. Decrease diagram vector vectors Colorful pie chart is showing positive statistics and business growth, target and financial analysis and marketing
Free with trial A simple flat style bar graph shows a negative trend, with a downward arrow on a black background. Decrease diagram vector vectors Decreasing bar graph with downward arrow over black background. A simple flat style bar graph shows a negative trend, with a downward arrow on a black background.
Free with trial Flat style illustration showcasing business financial data analysis via a magnifying glass and graph chart visualization, isolated on black. Decrease diagram vector vectors Analyzing Financial Data with Magnifying Glass and Graph Chart. Flat style illustration showcasing business financial data analysis via a magnifying glass and graph chart visualization, isolated on black.
Free with trial Financial crisis. Economic collapse. Bankruptcy, economic downturn. Stressed people analyze the financial downturn. Decrease diagram vector vectors Financial crisis. Economic collapse. Bankruptcy, economic downturn. Stressed people analyze the financial downturn
Free with trial A flat graphic of a magnifying glass with arrows pointing inward indicating zoom. Pink and purple gradient on black background. Decrease diagram vector vectors Magnifying glass and arrows on black background indicating zoom. A flat graphic of a magnifying glass with arrows pointing inward indicating zoom. Pink and purple gradient on black background.
Free with trial Flat style illustration showing a downward trending financial chart with dollar coin and bars. Decrease diagram vector vectors Financial market decline showing loss with downward trend arrow. Flat style illustration showing a downward trending financial chart with dollar coin and bars.
Free with trial A logo for a data visualization service, a simple chart bar forming a sharp, singular peak, vector graphic design on a white background, simple minimalistic style, flat color, sunflower yellow color palette, vector graphics, vector illustration, logo, professional logo, logo design, high-quality graphic designer work, logo icon --chaos 30 --ar 16:9 --v 7 Job ID: a54fbe77-4416-47fc-b767-. Decrease diagram vector illustrations Yellow Waveform Graph on White Background, Representing Data, Analytics, or Sound. a logo for a data visualization service, a simple chart bar forming a sharp, singular peak, vector graphic design on a white background, simple minimalistic style, flat color, sunflower yellow color palette, vector graphics, vector illustration, logo, professional logo, logo design, high-quality graphic designer work, logo icon --chaos 30 --ar 16:9 --v 7 Job ID: a54fbe77-4416-47fc-b767-
Free with trial A clean and simple illustration featuring a variety of common crochet stitch symbols. The chart includes symbols for chain, slip stitch, single crochet, double crochet, and more. This visual guide is perfect for crochet patterns, instructional materials, and educational resources for both beginners and experienced crocheters. The minimalist design ensures clarity and easy understanding. Decrease diagram vector illustrations Crochet Stitch Symbols Chart. A clean and simple illustration featuring a variety of common crochet stitch symbols. The chart includes symbols for chain, slip stitch, single crochet, double crochet, and more. This visual guide is perfect for crochet patterns, instructional materials, and educational resources for both beginners and experienced crocheters. The minimalist design ensures clarity and easy understanding.
Free with trial Illustration of a growing business intelligence with a dashboard displaying high metrics, a stack of data chips, and a simple magnifying glass. Vector flat icon design on a white background for a data analysis illustration --chaos 30 --ar 16:9 --v 7 Job ID: cfbe4cc3-3bae-455f-ac79-f340192ae4d4. Decrease diagram vector illustrations Data Analysis and Reporting Concept Computer Screen with Charts and Magnifying Glass. Illustration of a growing business intelligence with a dashboard displaying high metrics, a stack of data chips, and a simple magnifying glass. Vector flat icon design on a white background for a data analysis illustration --chaos 30 --ar 16:9 --v 7 Job ID: cfbe4cc3-3bae-455f-ac79-f340192ae4d4
Free with trial Abstract halftone pattern with a dotted gradient transitioning from orange in the upper left to green in the lower right. Dots decrease in size towards the center, where they become sparse, creating a dynamic radial effect. The overall design forms a smooth, circular gradient on a white background, showcasing a blend of warm to cool colors, typical in pop art and graphic design applications for visual impact and depth. Decrease diagram vector vectors Abstract halftone pattern background with orange and green dotted gradient. Abstract halftone pattern with a dotted gradient transitioning from orange in the upper left to green in the lower right. Dots decrease in size towards the center, where they become sparse, creating a dynamic radial effect. The overall design forms a smooth, circular gradient on a white background, showcasing a blend of warm to cool colors, typical in pop art and graphic design applications for visual impact and depth.
Free with trial Statistic Bar Chart Outline Sign Data Stats Business Performance Market Analysis Economic Trend Line Icon Presentation Display Board Symbol. Decrease diagram vector vectors Statistic Bar Chart Outline Sign Data Stats Business Performance Market Analysis Economic Trend Line Icon Presentation Display
Free with trial Sustainability, healthcare, cost reduction, carbon emissions, eco-friendly, global warming. Blue heart and line pulse, carbon footprint, CO2 text downward temperature arrow and dollar coin. Decrease diagram vector vectors Blue Heartbeat Monitor with Carbon Footprint, CO2 Emissions, and Cost Savings Concept. Sustainability, healthcare, cost reduction, carbon emissions, eco-friendly, global warming. Blue heart and line pulse, carbon footprint, CO2 text downward temperature arrow and dollar coin
Free with trial Business analysis, negative feedback, economic downturn, market performance, emotions, data interpretation. Graph showing downward trend with sad face icons. Business analysis and negative feedback. Decrease diagram vector vectors Declining Trend Diagram with Sad Faces and Speech Bubble, Negative Feedback and Recession. Business analysis, negative feedback, economic downturn, market. Business analysis, negative feedback, economic downturn, market performance, emotions, data interpretation. Graph showing downward trend with sad face icons. Business analysis and negative feedback
Free with trial Stylized gradient bar graph with downward arrow inside a square. Represents financial loss and economic decline with flat design. Decrease diagram vector vectors Decreasing graph icon representing financial loss or economic decline. Stylized gradient bar graph with downward arrow inside a square. Represents financial loss and economic decline with flat design.
Free with trial Colorful bar charts are presenting statistical trends and business performance data across different time periods. Possibly days of the week. Using a vibrant color scheme of blue. Purple. And orange. Decrease diagram vector vectors Colorful bar charts are presenting statistical trends and business performance data across different time periods
Free with trial Business strategy, performance analysis, goal setting, success tracking, financial growth, decision-making. Visual includes bar chart, target with an arrow and directional arrows. Business strategy. Decrease diagram vector vectors Business Growth, Performance Metrics, and Success Concept with Charts, Arrows, and Target Symbol. Business strategy, performance analysis, goal setting, success tracking, financial growth, decision-making. Visual includes bar chart, target with an arrow and directional arrows. Business strategy
Free with trial This image showcases a large collection of minimalist, line-style icons representing various charts and graphs. These icons depict data visualization elements commonly used in business, analytics, and reporting. high-quality professional. Decrease diagram vector vectors Collection of diverse line style charts and graphs icons displayed neatly. This image showcases a large collection of minimalist, line-style icons representing various charts and graphs. These icons depict data visualization elements commonly used in business, analytics, and reporting. high-quality professional
Free with trial Blue circular halftone pattern features a dotted radial gradient transitioning from dense, darker blue dots outward to lighter blue. The dots decrease in size and density as they move away from the center, creating a ring-like effect on a white background. This abstract design is commonly used in graphic design and visual arts to convey dynamism and depth. Decrease diagram vector vectors Abstract blue circular halftone pattern with dotted radial gradient transition. Blue circular halftone pattern features a dotted radial gradient transitioning from dense, darker blue dots outward to lighter blue. The dots decrease in size and density as they move away from the center, creating a ring-like effect on a white background. This abstract design is commonly used in graphic design and visual arts to convey dynamism and depth.
Free with trial Illustration of a growing sales funnel depth with a deep funnel filling with gold coins, a stream of downward arrows, and a simple payment terminal. Vector flat icon design on a white background for a prospect conversion illustration --chaos 30 --ar 16:9 --v 7 Job ID: 03afdd75-fca3-49f5-98d4-f73b21faf025. Decrease diagram vector illustrations Money Loss Concept Coins Falling Through Funnel into Pile, Money Decreasing Near Payment Terminal. Illustration of a growing sales funnel depth with a deep funnel filling with gold coins, a stream of downward arrows, and a simple payment terminal. Vector flat icon design on a white background for a prospect conversion illustration --chaos 30 --ar 16:9 --v 7 Job ID: 03afdd75-fca3-49f5-98d4-f73b21faf025
Free with trial Treatment of alopecia vitamins hair. Number of hair on scalp before and after of treatment loss. Decrease diagram vector vectors Treatment of alopecia. Number of hair on scalp before and after of treatment loss.
Free with trial A minimalist graphic featuring two opposing arrows, one pointing up and the other down, separated by a thick vertical line. The upward-pointing arrow is composed of a dark gray triangle atop a lighter gray rectangle, while the downward-pointing arrow consists of a dark blue triangle below a light blue rectangle. This clean design symbolizes concepts like comparison, contrast, growth, decline, progress, and regression, making it ideal for presentations, infographics, and digital interfaces. Decrease diagram vector illustrations Up and Down Arrows with Vertical Divider. A minimalist graphic featuring two opposing arrows, one pointing up and the other down, separated by a thick vertical line. The upward-pointing arrow is composed of a dark gray triangle atop a lighter gray rectangle, while the downward-pointing arrow consists of a dark blue triangle below a light blue rectangle. This clean design symbolizes concepts like comparison, contrast, growth, decline, progress, and regression, making it ideal for presentations, infographics, and digital interfaces.
Free with trial A collection of five distinct black and white graphic representations of data. From left to right, the first is a line graph with dots, showing fluctuations. The second is a zig-zag line graph with dots and an upward arrow. The third is a series of ascending vertical bars. The fourth is a bar chart with a single dot above one of the bars. The fifth is a pie chart divided into four sections, with. Decrease diagram vector vectors Collection of black and white business and data charts and graphs statistics analytics. A collection of five distinct black and white graphic representations of data. From left to right, the first is a line graph with dots, showing fluctuations. The second is a zig-zag line graph with dots and an upward arrow. The third is a series of ascending vertical bars. The fourth is a bar chart with a single dot above one of the bars. The fifth is a pie chart divided into four sections, with
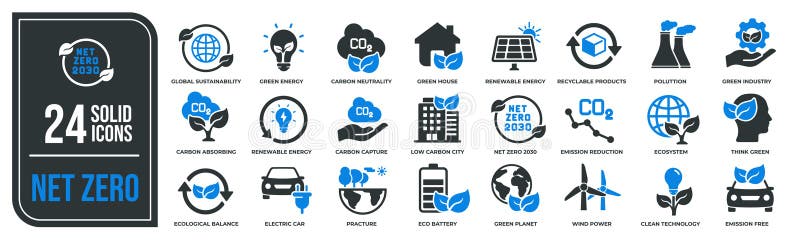
Free with trial Net zero solid icons collection. Containing customer ecology, sustainable, environmental etc icons. Decrease diagram vector vectors Net zero solid icons collection. Containing customer ecology, sustainable, environmental etc icons
Free with trial Black glyph icon representing a broken downward arrow, symbolizing decline, financial crisis, market downturn, failure, or negative trends. Ideal for business presentations, economic reports, data visualization, infographics, and conceptual designs indicating loss, recession, or problems. Simple, clean graphic illustration on a white background. Generated by AI. Decrease diagram vector vectors Declining Trend Broken Downward Arrow Icon. Black glyph icon representing a broken downward arrow, symbolizing decline, financial crisis, market downturn, failure, or negative trends. Ideal for business presentations, economic reports, data visualization, infographics, and conceptual designs indicating loss, recession, or problems. Simple, clean graphic illustration on a white background. Generated by AI
Free with trial A detailed black and white illustration of a knitting pattern stitch chart. This graphical guide features a grid with various symbols, icons, and abbreviations like 'k2tog' and 'ssk', representing different knitting stitches and techniques. The chart is organized by rows and columns, providing a visual map for creating intricate designs, particularly in lace knitting. This image is ideal for crafting websites, DIY tutorials, knitting books, hobby blogs, and instructional materials related to needlework, textiles, and handmade crafts. Decrease diagram vector illustrations Knitting Pattern Stitch Chart
Free with trial A clean and simple illustration of a bar chart icon. The chart features three bars of varying heights, colored in shades of yellow and green, outlined in dark blue. The design is minimalist and suitable for a wide range of applications, including presentations, infographics, and web design. It conveys concepts of data analysis, growth, and statistics. Decrease diagram vector illustrations Simple Bar Chart Icon. A clean and simple illustration of a bar chart icon. The chart features three bars of varying heights, colored in shades of yellow and green, outlined in dark blue. The design is minimalist and suitable for a wide range of applications, including presentations, infographics, and web design. It conveys concepts of data analysis, growth, and statistics.
Free with trial Growth and decline chart icon in flat design. Business trend arrow symbol illustration. Profit and loss concept. Decrease diagram vector vectors Growth and decline chart icon in flat design. Business trend arrow symbol. Profit and loss concept
Free with trial Dollar Coins with Upward Arrows Representing Financial Growth in Minimalist Flat Style. Decrease diagram vector vectors Dollar Coins with Upward Arrows Representing Financial Growth in Minimalist Flat Style
Free with trial Circular chart icon presenting a bar graph visualizing statistical data, analytics, and business reports, symbolizing financial decline, data analysis, and market trends. Decrease diagram vector vectors Circular chart icon showing declining bar graph. Circular chart icon presenting a bar graph visualizing statistical data, analytics, and business reports, symbolizing financial decline, data analysis, and market trends
Free with trial Red zigzag line graph with broken arrows pointing up and down. Business metaphor for market volatility and financial crisis. Handdrawn zig zag arrows. Decrease diagram vector vectors Red zigzag line graph with broken arrows pointing up and down. Market volatility and financial crisis. Zig zag arrows. Red zigzag line graph with broken arrows pointing up and down. Business metaphor for market volatility and financial crisis. Handdrawn zig zag arrows
Free with trial Decline Chart simple icons set designed in filled, outline, line and stroke style. Decrease diagram vector vectors Decline Chart simple icons set designed in filled and stroke style. Decline Chart simple icons set designed in filled, outline, line and stroke style
Free with trial Design BRAIN SLEEPY FEELING TIRED SLEEPING ON PILLOW element. Decrease diagram vector illustrations BRAIN SLEEPY FEELING TIRED SLEEPING ON PILLOW element
Free with trial A clean and modern isometric bar graph illustration. Three colored bars, blue, green, and yellow, represent data points with corresponding numerical values displayed above each bar. The graphic is set against a white background, making it suitable for various presentations, reports, or website designs related to data analysis, business, or education. The simple design offers a clear visual representation of data comparison. Decrease diagram vector illustrations Isometric Bar Graph Illustrating Data and Statistics. A clean and modern isometric bar graph illustration. Three colored bars, blue, green, and yellow, represent data points with corresponding numerical values displayed above each bar. The graphic is set against a white background, making it suitable for various presentations, reports, or website designs related to data analysis, business, or education. The simple design offers a clear visual representation of data comparison.
Free with trial Scale with illustrations of cash and home stocks. The concept of inflation. Stock Illustration. Home price is decrease. Decrease diagram vector vectors Scale with illustrations of cash and home stocks. The concept of inflation. Stock Illustration
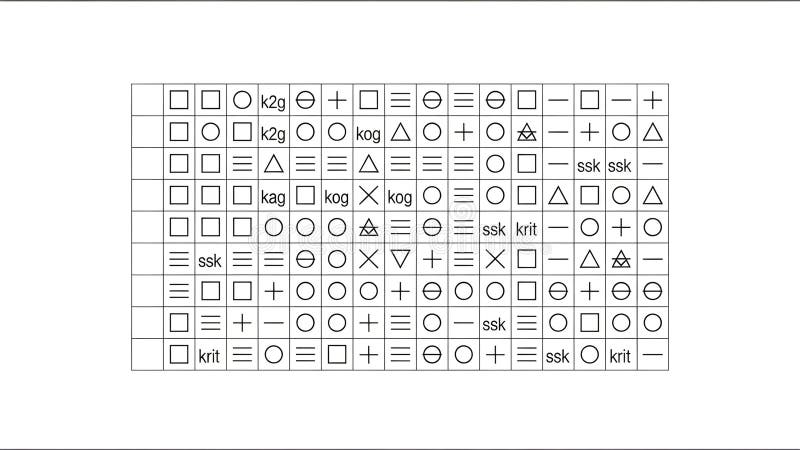
Free with trial A detailed black and white illustration of a complex knitting pattern chart on a clean white background. The grid is filled with various symbols, including geometric shapes like circles, squares, and triangles, alongside standard knitting abbreviations such as 'k2g', 'ssk', and 'kog'. This graphic represents a stitch legend or a visual guide for creating intricate lace or colorwork designs. It's perfect for craft-related websites, publications, tutorials, and projects that require a visual representation of handmade instructions, patterns, or complex codes. Decrease diagram vector illustrations Knitting Pattern Chart with Symbols and Abbreviations. A detailed black and white illustration of a complex knitting pattern chart on a clean white background. The grid is filled with various symbols, including geometric shapes like circles, squares, and triangles, alongside standard knitting abbreviations such as 'k2g', 'ssk', and 'kog'. This graphic represents a stitch legend or a visual guide for creating intricate lace or colorwork designs. It's perfect for craft-related websites, publications, tutorials, and projects that require a visual representation of handmade instructions, patterns, or complex codes.
Free with trial A clean, minimal, and abstract composition featuring a series of thin, circular frames arranged horizontally. The circles gradually decrease in size and fade in color and thickness from left to right, creating a sense of distance, perspective, or vanishing effect. The circles are outlined in a light, lime green or pale gold color against a pure white background. This progression of geometric shapes is a versatile graphic element suitable for abstract art, background design, or representing concepts like scale, progression, or evolution. Decrease diagram vector vectors Gradually Decreasing Lime Green Circle Frames on White. A clean, minimal, and abstract composition featuring a series of thin, circular frames arranged horizontally. The circles gradually decrease in size and fade in color and thickness from left to right, creating a sense of distance, perspective, or vanishing effect. The circles are outlined in a light, lime green or pale gold color against a pure white background. This progression of geometric shapes is a versatile graphic element suitable for abstract art, background design, or representing concepts like scale, progression, or evolution.
Free with trial T shirt with size expansion icon in isometric digital style, symbolizing adaptable, customizable apparel dimensions for fashion, retail, e commerce and uiux applications. Decrease diagram vector vectors Clothing size expansion digital isometric diagram icon. T shirt with size expansion icon in isometric digital style, symbolizing adaptable, customizable apparel dimensions for fashion, retail, e commerce and uiux applications
Free with trial Conceptual image showing a magnifying glass focusing on a business presentation with a declining graph. Decrease diagram vector illustrations Decline Analysis Magnifying Glass on Business Loss Graph. Conceptual image showing a magnifying glass focusing on a business presentation with a declining graph.
Free with trial Dollar and bitcoin Coins with Upward Arrows Representing Financial Growth in Minimalist Flat Style. Decrease diagram vector vectors Dollar and bitcoin Coins with Upward Arrows Representing Financial Growth in Minimalist Flat Style
Free with trial A black and white line drawing depicts a magnifying glass focusing on a gear, a descending bar graph, and a. Decrease diagram vector illustrations Decline Analysis Magnifying Glass, Gear, and Downward Graph. A black and white line drawing depicts a magnifying glass focusing on a gear, a descending bar graph, and a.
Free with trial A simple line drawing depicts a declining bar graph with an arrow pointing downwards, all viewed through a magnifying. Decrease diagram vector illustrations Declining Graph Under Magnifying Glass Loss Analysis Icon. A simple line drawing depicts a declining bar graph with an arrow pointing downwards, all viewed through a magnifying.
Free with trial Conceptual icon depicting declining mental health or cognitive decline. Decrease diagram vector illustrations Declining Mental Health Brain, Chart, Magnifying Glass Icon. Conceptual icon depicting declining mental health or cognitive decline.
Free with trial This image depicts a financial downturn, with stacks of coins decreasing under a magnifying glass, accompanied by a. Decrease diagram vector illustrations Economic Downturn Magnifying Glass on Falling Money Graph. This image depicts a financial downturn, with stacks of coins decreasing under a magnifying glass, accompanied by a.
Free with trial E-commerce Sales Decline Visualization , elegant style. Decrease diagram vector illustrations E-commerce Sales Decline Visualization
Free with trial A downward trending bar graph with a question mark is examined under a magnifying glass, symbolizing uncertainty and. Decrease diagram vector illustrations Decreasing Chart Under Magnifying Glass with Question Mark. A downward trending bar graph with a question mark is examined under a magnifying glass, symbolizing uncertainty and.
Free with trial A diverse collection of downward-pointing arrows presented against a clean, light grey background. The arrows vary in style, including solid black, outlined, and shaded grey designs. This graphic element is ideal for representing direction, decline, progress, or a list of instructions. Its versatile design makes it suitable for web graphics, presentations, infographics, and print materials. Decrease diagram vector vectors Collection of Downward Arrows in Various Styles. A diverse collection of downward-pointing arrows presented against a clean, light grey background. The arrows vary in style, including solid black, outlined, and shaded grey designs. This graphic element is ideal for representing direction, decline, progress, or a list of instructions. Its versatile design makes it suitable for web graphics, presentations, infographics, and print materials.
Free with trial A magnifying glass focuses on a dollar sign with a downward arrow, symbolizing cost reduction, economic downturn, or. Decrease diagram vector illustrations Cost Reduction Analysis Magnifying Glass on Downward Dollar. A magnifying glass focuses on a dollar sign with a downward arrow, symbolizing cost reduction, economic downturn, or.
Free with trial Graph Declining with Arrow Line Art Minimalist Representation. Decrease diagram vector vectors Graph Declining with Arrow Line Art Minimalist Representation
Free with trial Conceptual line art depicting business analysis and market trends. Decrease diagram vector illustrations Business Analysis Magnifying Glass, Thumbs Up, Declining Graph. Conceptual line art depicting business analysis and market trends.
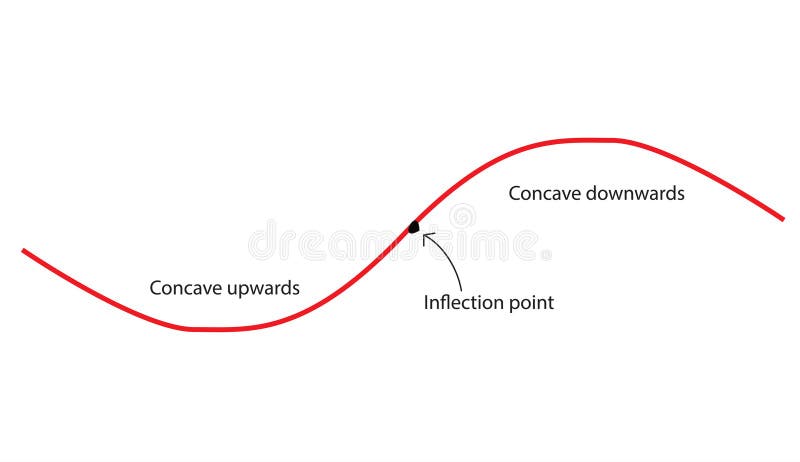
Free with trial Concavity of curve. Inflection point, concave down and concave up. Second derivative tangent lines of function. Decrease diagram vector vectors Concavity of curve
Free with trial A clean, minimalist icon representing the stock market. The image features a bull and a bear, symbolizing market trends, with a rising green arrow indicating an upward trend. The design is enclosed in a circular frame, suitable for financial reports, investment presentations, or business infographics. The simple line art style makes it versatile for various applications. Decrease diagram vector illustrations Stock Market Bull and Bear Trend Icon. A clean, minimalist icon representing the stock market. The image features a bull and a bear, symbolizing market trends, with a rising green arrow indicating an upward trend. The design is enclosed in a circular frame, suitable for financial reports, investment presentations, or business infographics. The simple line art style makes it versatile for various applications.
Free with trial A magnifying glass focuses on a downward trend graph and briefcase, symbolizing economic downturn analysis and market. Decrease diagram vector illustrations Economic Downturn Analysis Magnifying Glass on Market Decline. A magnifying glass focuses on a downward trend graph and briefcase, symbolizing economic downturn analysis and market.
Free with trial Doodle Graph icon. Blue pen hand drawn infographic symbol on a notepaper piece. Line art style graphic design element. Web button with shadow. Decline, save on expences concept. Decrease diagram vector vectors Doodle Graph icon
Free with trial Bar chart icon representing data visualization, financial growth, business analytics, and market trends, indicating increasing and decreasing values for decision making. Decrease diagram vector vectors Bar chart icon showing data analysis and statistics. Bar chart icon representing data visualization, financial growth, business analytics, and market trends, indicating increasing and decreasing values for decision making
Free with trial Dollar Coins with Upward and Downward Arrows Representing Financial Growth and Decline in Minimalist Flat Style. Decrease diagram vector vectors Dollar Coins with Upward and Downward Arrows Representing Financial Growth and Decline in Minimalist Flat Style
Free with trial Vibrant 3D red bar chart illustrating declining growth trends for business analytics, finance reports, and data visualization projects. Decrease diagram vector vectors 3D red bar chart decreasing growth business data analysis concept. Vibrant 3D red bar chart illustrating declining growth trends for business analytics, finance reports, and data visualization projects
Free with trial Business Chart and Graph Set with Line, Bar, and Pie Icons for Data Analysis or Statistics in Reports and Research. Vector. Editable stroke. Decrease diagram vector vectors Business Chart and Graph Set with Line, Bar, and Pie Icons for Data Analysis or Statistics in Reports and Research
Free with trial This image features an abstract illustration of a bar graph against a dark gray background. The graph consists of three vertical bars of varying heights, each with horizontal rectangles inside. The bars are shades of white and gray, creating a minimalist and modern design. This image can be used to represent data, growth, statistics, or business performance in a visually appealing manner. Decrease diagram vector vectors Abstract Bar Graph Illustration. This image features an abstract illustration of a bar graph against a dark gray background. The graph consists of three vertical bars of varying heights, each with horizontal rectangles inside. The bars are shades of white and gray, creating a minimalist and modern design. This image can be used to represent data, growth, statistics, or business performance in a visually appealing manner.