Free with trial Increase and Decrease Stroke icon collections. Containing Increase, Decrease, Growth, Fall, up, down icons. Editable Stroke icon collections. Decrease line graph vectors Increase and Decrease Stroke icon collections.
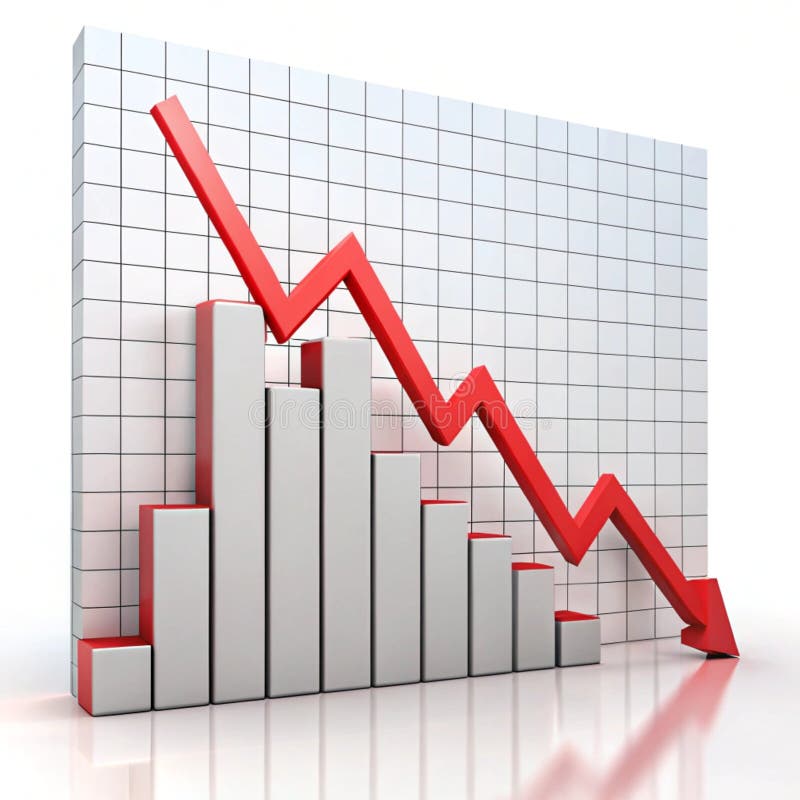
Free with trial This minimalist vector illustration depicts a financial chart with a bold red arrow pointing downwards, symbolizing a significant decline or loss. The graphic features clean lines and a simple aesthetic, emphasizing the negative movement of the data points. The stark contrast between the red elements and the plain background makes it an effective visual for concepts related to economic downturns,. Decrease line graph vectors A red line graph showing a sharp downward trend on a white background. This minimalist vector illustration depicts a financial chart with a bold red arrow pointing downwards, symbolizing a significant decline or loss. The graphic features clean lines and a simple aesthetic, emphasizing the negative movement of the data points. The stark contrast between the red elements and the plain background makes it an effective visual for concepts related to economic downturns,
Free with trial Percent up and down icon on circle line. Percentage upward and downward sign. Growth and decline symbol vector. Decrease line graph vectors Percent up and down icon on circle line. Percentage upward and downward sign. Growth and decline symbol
Free with trial A line graph illustrates a steady decline in values, featuring a blue line dropping toward a bright red arrow indicating a significant downward trend over time. Decrease line graph illustrations Declining trend in data representation shows significant decrease over time. A line graph illustrates a steady decline in values, featuring a blue line dropping toward a bright red arrow indicating a significant downward trend over time.
Free with trial Downward line graph with sad face reflecting poor performance, folder with binary data, and cloud element. Ideal for finance, analytics, failure, statistics, digital storage, emotions simple flat. Decrease line graph illustrations Negative trend in data analysis with declining graph, sad face, and digital file management. Downward line graph with sad face reflecting poor performance, folder with binary data, and cloud element. Ideal for finance, analytics, failure, statistics, digital storage, emotions simple flat
Free with trial Cost reduction icon price lower arrow. Vector low cost money crisis line icon. Decrease line graph vectors Cost reduction icon price lower arrow. Vector low cost money crisis line icon
Free with trial An icon representing financial downturn, featuring a stack of coins and a line graph with a downward arrow, indicating a decrease in value or performance. This visual signifies economic hardship or in. Decrease line graph vectors Graph showing financial decline with coins isolated on transparent background. An icon representing financial downturn, featuring a stack of coins and a line graph with a downward arrow, indicating a decrease in value or performance. This visual signifies economic hardship or in
Free with trial Sad face beside declining line graph and bar chart, symbolizing setbacks. Ideal for finance, business, economy, loss, analytics, crisis performance. Simple flat metaphor. Decrease line graph vectors Negative Trend Line and Declining Bar Chart Representing Business Loss or Financial Downturn. Sad face beside declining line graph and bar chart, symbolizing setbacks. Ideal for finance, business, economy, loss, analytics, crisis performance. Simple flat metaphor
Free with trial Power consumption reduction icon, line vector, eps 10 file, easy to edit. Decrease line graph vectors Power consumption reduction icon, line vector
Free with trial A dramatic business concept image showing a person in a business suit holding a glowing red line graph that is trending downwards with an arrow. The background is a blurred view of stock market ticker screens, clearly linking the downward trend to a financial market crash, recession, or investment loss. Generative AI. Decrease line graph illustrations A person in a suit holding a plunging red arrow graph in front of stock market screens. A dramatic business concept image showing a person in a business suit holding a glowing red line graph that is trending downwards with an arrow. The background is a blurred view of stock market ticker screens, clearly linking the downward trend to a financial market crash, recession, or investment loss. Generative AI.
Free with trial Decreasing graph icon Business chart with downward arrow Financial loss symbol. Decrease line graph vectors Decreasing graph icon Business chart with downward arrow Financial loss symbol
Free with trial A neon glowing graph with blue bars and pink zigzag arrow showing fluctuating growth on black background. Generative AI. Decrease line graph illustrations Neon glowing graph with blue bars and pink zigzag arrow showing fluctuating growth on black background
Free with trial This chart depicts a significant downward trend in stock value over a period. The red line graphically represents the declining prices, indicating a bearish market or a stock facing substantial losses. Decrease line graph illustrations Stock market downturn visualized red line chart showing price decline over time. This chart depicts a significant downward trend in stock value over a period. The red line graphically represents the declining prices, indicating a bearish market or a stock facing substantial losses
Free with trial Graph depiction on paper with a pencil ,Generative ai. Decrease line graph illustrations Pencil and paper, a detailed illustration of graph for data analysis visualization. Graph depiction on paper with a pencil ,Generative ai
Free with trial Line Art Cartoon Sad Man Walking Under Downward Arrow Symbol of Decline and Failure. Decrease line graph vectors Line Art Cartoon Sad Man Walking Under Downward Arrow Symbol of Decline and Failure
Free with trial Viewing Progress Icon Line Design Style Finance and Business Symbol Vector Illustrations. Decrease line graph vectors Viewing Progress Icon Line Design Style Finance and Business Symbol
Free with trial A simple bar chart with a falling line, symbolizing financial decline, economic downturn, decreased profits, market loss, or negative business results. Ideal for illustrating risks, challenges, crisis situations, and economic analysis. Decrease line graph vectors Declining financial chart icon with downward trend showing loss, decrease and negative business performance. A simple bar chart with a falling line, symbolizing financial decline, economic downturn, decreased profits, market loss, or negative business results. Ideal for illustrating risks, challenges, crisis situations, and economic analysis.
Free with trial Understanding bar graph charts data analysis and visualization for business and financial performance metrics. Decrease line graph vectors Understanding bar graph charts data analysis and visualization for business
Free with trial Graphs set with line charts, bar charts, and scatter plots illustrating upward and downward trends with arrows and data points. Decrease line graph vectors Graphs set with line charts, bar charts, and scatter plots illustrating upward and
Free with trial A minimalist graphic illustration of a downward financial trend features a green line graph with three vertical bars topped by dollar signs, where the first bar is green, the second yellow, and the third orange, symbolizing decreasing monetary value, set against a clean white background with scattered dollar signs emphasizing economic decline, conveying a clear message of financial loss, market. Decrease line graph illustrations Downward financial trend with colored dollar signs on white background. A minimalist graphic illustration of a downward financial trend features a green line graph with three vertical bars topped by dollar signs, where the first bar is green, the second yellow, and the third orange, symbolizing decreasing monetary value, set against a clean white background with scattered dollar signs emphasizing economic decline, conveying a clear message of financial loss, market
Free with trial Bitcoin failing graph crypto currency. Coin B symbol finance economy banking system. Blockchain extra crash with lightning negative forecast for decline in value vector illustration. Decrease line graph vectors Bitcoin failing graph crypto currency. Coin B symbol finance economy banking system. Blockchain extra crash with
Free with trial A simple bar graph illustrating upward growth and financial success. Ideal for presentations, reports, and website use. Decrease line graph vectors Upward Trending Bar Graph: Business Growth and Financial Success. A simple bar graph illustrating upward growth and financial success. Ideal for presentations, reports, and website use.
Free with trial A clean, minimalist 3D render depicts a series of white arrows of varying heights arranged in a graph-like formation. The tallest arrows, on the left, are illuminated with a warm, orange glow, symbolizing growth, success, and positive trends. The arrows decrease in size towards the right, suggesting a progression or trend line. The reflective surface and bright, airy background create a modern and optimistic feel, ideal for business, finance, and technology-related concepts. Decrease line graph illustrations Rising Arrows Graph. A clean, minimalist 3D render depicts a series of white arrows of varying heights arranged in a graph-like formation. The tallest arrows, on the left, are illuminated with a warm, orange glow, symbolizing growth, success, and positive trends. The arrows decrease in size towards the right, suggesting a progression or trend line. The reflective surface and bright, airy background create a modern and optimistic feel, ideal for business, finance, and technology-related concepts.
Free with trial A vibrant bar graph shows an upward trend with a green arrow, indicating growth. The bars are blue, yellow, green, and red, set against a clean white background. Decrease line graph illustrations Colorful Bar Graph with Upward Trend Line and Green Arrow Indicator on White Background. A vibrant bar graph shows an upward trend with a green arrow, indicating growth. The bars are blue, yellow, green, and red, set against a clean white background
Free with trial This image shows a downward-trending red arrow graph, generated by AI, illustrating a significant decline. The visual representation is clear and effective in communicating a negative trend, potentially in stock prices, sales figures, or other quantifiable data. Decrease line graph illustrations Downward Trending Graph. This image shows a downward-trending red arrow graph, generated by AI, illustrating a significant decline. The visual representation is clear and effective in communicating a negative trend, potentially in stock prices, sales figures, or other quantifiable data.
Free with trial Description: Simple line art illustration of a scatter plot graph showing an uneven distribution of data points. Perfect for presentations or reports. Decrease line graph vectors Abstract Data Visualization: Scatter Plot Chart with Irregular Data Points. Description: Simple line art illustration of a scatter plot graph showing an uneven distribution of data points. Perfect for presentations or reports.
Free with trial Growth vector icon. Graph or diagram with arrow going up and down. Vector illustration. Decrease line graph vectors Growth vector icon. Graph or diagram with arrow going up and down. Vector
Free with trial Up and down graph icon on black circle. Outline bar chart with uptrend and downtrend arrow symbol vector. Decrease line graph vectors Up and down graph icon on black circle. Outline bar chart with uptrend and downtrend arrow symbol
Free with trial Set line Mobile stock trading, Global economic crisis news, Glass money jar with coin and Bank building. Glowing neon icon. Vector. Decrease line graph illustrations Set line Mobile stock trading, Global economic crisis news, Glass money jar with coin and Bank building. Glowing neon
Free with trial Stylized illustration depicts a black, downward-trending arrow within a graph framework, set against a solid pastel yellow background. The image is suitable for conveying concepts related to market decline, financial downturns, or negative trends in various business or editorial contexts, lending itself well to presentations or reports. Decrease line graph illustrations Downward trend arrow graph illustrates market decline and business loss. Stylized illustration depicts a black, downward-trending arrow within a graph framework, set against a solid pastel yellow background. The image is suitable for conveying concepts related to market decline, financial downturns, or negative trends in various business or editorial contexts, lending itself well to presentations or reports
Free with trial The image shows a bar graph placed on top of an open financial report book. The bar graph displays data with blue bars of varying heights, and two lines are plotted across the bars, one red and one blue. The graph appears to be indicating trends or comparisons over time. The financial report book underneath has detailed tables and charts, suggesting a thorough analysis of financial data. Decrease line graph illustrations Bar graph on financial report. The image shows a bar graph placed on top of an open financial report book. The bar graph displays data with blue bars of varying heights, and two lines are plotted across the bars, one red and one blue. The graph appears to be indicating trends or comparisons over time. The financial report book underneath has detailed tables and charts, suggesting a thorough analysis of financial data
Free with trial Graph with a green arrow pointing upwards. The graph is labeled with numbers and the numbers are increasing. Decrease line graph illustrations Graph with a green arrow pointing upwards
Free with trial This flat vector illustration depicts a rectangular screen displaying a red line graph with a downward pointing arrow. The design uses a clean, minimalist aesthetic with soft pastel background tones and bold outlines. It represents concepts of financial decline, market loss, or negative economic performance in a professional business context. Decrease line graph vectors A digital icon showing a red downward trend arrow on a screen. This flat vector illustration depicts a rectangular screen displaying a red line graph with a. This flat vector illustration depicts a rectangular screen displaying a red line graph with a downward pointing arrow. The design uses a clean, minimalist aesthetic with soft pastel background tones and bold outlines. It represents concepts of financial decline, market loss, or negative economic performance in a professional business context
Free with trial Graph going down and up sign with green and red arrows vector. Bar chart symbol icon with arrow moving down and sales bar chart with arrow moving up. Decrease line graph vectors Graph going down and up sign with green and red arrows vector. Bar chart symbol icon with arrow moving down and sales bar chart
Free with trial A detailed bear figurine stands on a wooden surface, symbolizing a bearish trend in the stock market. The trend graph in the background visually represents market movements and fluctuations. Decrease line graph illustrations Bear Figurine on Wooden Surface with Stock Market Trend Graph in Background. A detailed bear figurine stands on a wooden surface, symbolizing a bearish trend in the stock market. The trend graph in the background visually represents market movements and fluctuations
Free with trial This image depicts a bar and line chart illustrating a significant decline in values. The bars represent discrete data points that decrease progressively, while the line chart overlays the bars, emphasizing the downward trend. The chart uses a blue color scheme for both the bars and the line, with a clear visual representation of a negative progression. The overall design is minimalistic and. Decrease line graph vectors Downward trend chart showing a decline in values over time. This image depicts a bar and line chart illustrating a significant decline in values. The bars represent discrete data points that decrease progressively, while the line chart overlays the bars, emphasizing the downward trend. The chart uses a blue color scheme for both the bars and the line, with a clear visual representation of a negative progression. The overall design is minimalistic and
Free with trial A visual representation of a steep financial downturn with a red line graph descending sharply, magnified to show a 15% decrease, symbolizing economic decline and losses. Decrease line graph illustrations Stock market crash downturn economic recession loss financial crisis downtrend chart magnifying glass zoom 15 percent. A visual representation of a steep financial downturn with a red line graph descending sharply, magnified to show a 15% decrease, symbolizing economic decline and losses
Free with trial Arrow down and up percent outline icon on circle line. Percentage downward and upward arrows sign symbol vector. Decrease line graph vectors Arrow down and up percent outline icon on circle line. Percentage downward and upward arrows sign symbol
Free with trial 3D icon featuring a silver metallic effect in the shape of a negative trend graph. Bars in descending order from left to right are accompanied by a downward-pointing arrow. The icon is framed in a rounded square, all elements sharing a polished, reflective surface that suggests a modern and sleek design. Decrease line graph vectors Negative Trend Graph 3D icon with silver metallic effect. 3D icon featuring a silver metallic effect in the shape of a negative trend graph. Bars in descending order from left to right are accompanied by a downward-pointing arrow. The icon is framed in a rounded square, all elements sharing a polished, reflective surface that suggests a modern and sleek design.
Free with trial A 3D rendered blue arrow forms a jagged downward line, representing a declining trend or graph. The arrow is positioned diagonally, pointing towards the bottom right corner of the frame. The image is set against a clean white background, emphasizing the sharp descent. Decrease line graph illustrations Blue downward trending arrow graph on white background chart. A 3D rendered blue arrow forms a jagged downward line, representing a declining trend or graph. The arrow is positioned diagonally, pointing towards the bottom right corner of the frame. The image is set against a clean white background, emphasizing the sharp descent
Free with trial A 3D line graph showing a downward trend with a red arrow pointing downwards, indicating a decline in data or financial performance. The graph is set against a grid background with a professional and ultra-detailed quality. Decrease line graph illustrations Downward Trend Graph with Red Arrow. A 3D line graph showing a downward trend with a red arrow pointing downwards, indicating a decline in data or financial performance. The graph is set against a grid background with a professional and ultra-detailed quality.
Free with trial Hand-drawn illustration of a bar graph with bars and a prominent arrow showcasing a downward trend. Concepts of decline, loss, or negative growth in various business and educational settings. Decrease line graph vectors Hand-Drawn Decreasing Bar Graph Illustration. hand-drawn illustration of a bar graph with bars and a prominent arrow showcasing a downward trend. Concepts of decline, loss, or negative growth in various business and educational settings
Free with trial The image depicts a bar chart with yellow bars of decreasing height from left to right, indicating a downward trend. A red line with an arrowhead follows the tops of the bars, reinforcing the declining pattern. The arrowhead at the end of the line points downward to the right, symbolizing a reduction or decrease over time. Decrease line graph illustrations Graph showing a downward trend with a red arrow and yellow bars. The image depicts a bar chart with yellow bars of decreasing height from left to right, indicating a downward trend. A red line with an arrowhead follows the tops of the bars, reinforcing the declining pattern. The arrowhead at the end of the line points downward to the right, symbolizing a reduction or decrease over time
Free with trial A neon orange graph on a black background shows a sharp decline, symbolizing financial loss or a negative trend. Decrease line graph illustrations Neon orange downward trending graph with arrow indicating financial decline on a black background. A neon orange graph on a black background shows a sharp decline, symbolizing financial loss or a negative trend
Free with trial A person's open palm supports a glowing neon graph illustrating the relationship between cost and quality with upward and downward arrows. Decrease line graph illustrations Hand holding glowing cost quality graph palm open. A person's open palm supports a glowing neon graph illustrating the relationship between cost and quality with upward and downward arrows
Free with trial A simple line drawing depicts a person experiencing stress while looking at a computer screen displaying a downward-trending graph. The illustration conveys the concept of financial anxiety, market volatility, and economic downturn. The image is suitable for use in articles, presentations, and websites related to finance, economics, mental health, and business. Decrease line graph vectors Financial Stress and Market Downturn. A simple line drawing depicts a person experiencing stress while looking at a computer screen displaying a downward-trending graph. The illustration conveys the concept of financial anxiety, market volatility, and economic downturn. The image is suitable for use in articles, presentations, and websites related to finance, economics, mental health, and business.
Free with trial A futuristic digital illustration depicts a world map with a dark background composed of small blue and green dots arranged in a dotted pattern to create depth and dimension, featuring a prominent downward-trending line graph at its center surrounded by a darker green line that represents declining financial data or stock market performance, creating a technological visualization of the global. Decrease line graph illustrations Digital world map with dotted pattern showing global economic downturn on dark background. A futuristic digital illustration depicts a world map with a dark background composed of small blue and green dots arranged in a dotted pattern to create depth and dimension, featuring a prominent downward-trending line graph at its center surrounded by a darker green line that represents declining financial data or stock market performance, creating a technological visualization of the global
Free with trial Set of 16 black and white graph icons in a 4x4 grid. Each icon depicts variations of bar charts with upward and downward arrows, suggesting growth or decline. Some include additional elements like magnifying glasses, checkmarks, and data points connected by lines. Icons vary slightly in design, representing different data trends with simple, bold lines on a white background, ideal for business and statistical representation. Decrease line graph vectors Graph icon set. Increase and decrease graph icon. Growth icon. Graph chart icons. Icon set. 16 icons. Set of 16 black and white graph icons in a 4x4 grid. Each icon depicts variations of bar charts with upward and downward arrows, suggesting growth or decline. Some include additional elements like magnifying glasses, checkmarks, and data points connected by lines. Icons vary slightly in design, representing different data trends with simple, bold lines on a white background, ideal for business and statistical representation.
Free with trial Downward graph chart isolated on transparent background. Decrease line graph illustrations Downward graph chart
Free with trial A set of declining bar and line graphs displayed on a grid background. 3D Rendering. Concept of financial decline and analysis. Decrease line graph illustrations Declining Bar and Line Graphs on Grid Background. 3D Rendering. A set of declining bar and line graphs displayed on a grid background. 3D Rendering. Concept of financial decline and analysis
Free with trial Stock market bullish point analysis. This image depicts a stock market chart highlighting a bullish point. The chart shows a trend line indicating an upward trajectory in stock prices over time. Green and red bars represent price movements, with green bars indicating an increase and red bars indicating a decrease. The bullish point is marked with an arrow, suggesting a significant upward movement. Decrease line graph illustrations Stock market bullish point analysis
Free with trial A photorealistic 3D render depicts a smartphone displaying a stock market trading analysis app. The screen shows a prominent red downward trending line graph overlaid on blue bar graphs. Surrounding the phone are 3D rendered dollar signs and bills, suggesting a financial context. The overall color scheme is dark with vibrant accents of red and blue in the graphs. The style is clean and modern,. Decrease line graph illustrations 3 D Stock Trading Analysis App Smartphone Displaying Red Downward Trend Graph. A photorealistic 3D render depicts a smartphone displaying a stock market trading analysis app. The screen shows a prominent red downward trending line graph overlaid on blue bar graphs. Surrounding the phone are 3D rendered dollar signs and bills, suggesting a financial context. The overall color scheme is dark with vibrant accents of red and blue in the graphs. The style is clean and modern,
Free with trial This graphic illustration depicts a declining financial trend using a bar chart and a line graph. The visual features red bars decreasing in height alongside a red line pointing downward, symbolizing economic loss or market contraction. Various currency symbols are positioned near arrows to emphasize the negative movement against a dark background. Decrease line graph vectors A financial chart showing a downward trend with red bars and arrows. This graphic illustration depicts a declining financial trend using a bar chart and a line graph. The visual features red bars decreasing in height alongside a red line pointing downward, symbolizing economic loss or market contraction. Various currency symbols are positioned near arrows to emphasize the negative movement against a dark background
Free with trial This minimalist vector illustration depicts a financial chart with a prominent red arrow pointing downwards, symbolizing a significant decline in value or performance. The graphic features clean lines and a simple color palette, emphasizing the negative trend against a neutral backdrop. Below the chart, numerical data points are displayed in a rectangular box, highlighting the extent of the loss. Decrease line graph vectors A red line graph showing a sharp downward trend on a white background. This minimalist vector illustration depicts a financial chart with a prominent red arrow pointing downwards, symbolizing a significant decline in value or performance. The graphic features clean lines and a simple color palette, emphasizing the negative trend against a neutral backdrop. Below the chart, numerical data points are displayed in a rectangular box, highlighting the extent of the loss.
Free with trial Graphic showing a downward trend with blue bars and red line chart. Bars decrease in size from left to right. Decrease line graph illustrations Declining bar and line chart illustration. Graphic showing a downward trend with blue bars and red line chart. Bars decrease in size from left to right
Free with trial A downward trending graph chart isolated on a white background, perfect for financial analysis. Decrease line graph illustrations Downward graph chart. A downward trending graph chart isolated on a white background, perfect for financial analysis
Free with trial The image shows a computer screen displaying a stock market chart with a downward trend. The chart features a red line with arrows indicating a decline, and various percentage values are marked along the graph. Decrease line graph illustrations Stock market downtrend displayed on screen. The image shows a computer screen displaying a stock market chart with a downward trend. The chart features a red line with arrows indicating a decline, and various percentage values are marked along the graph
Free with trial Red arrow graph showing a downward trend on a grid background with a sharp decline at the end. Decrease line graph illustrations Red downward arrow graph on grid background. Red arrow graph showing a downward trend on a grid background with a sharp decline at the end
Free with trial A stark red line graph illustrates a sharp decline in the stock market, symbolizing financial loss, market downturn, and economic recession. Ideal for illustrating concepts of risk, volatility, and investment crisis. Represents negative growth and market fluctuation. Perfect for financial news, reports, and presentations. Generated by AI. Decrease line graph illustrations Red stock market graph showing decline trend. A stark red line graph illustrates a sharp decline in the stock market, symbolizing financial loss, market downturn, and economic recession. Ideal for illustrating concepts of risk, volatility, and investment crisis. Represents negative growth and market fluctuation. Perfect for financial news, reports, and presentations. Generated by AI.
Free with trial The image depicts a red zigzag line that starts at the top left and ends with an arrow pointing downward at the bottom right. This line illustrates a downward trend or a decrease over time. The zigzag pattern indicates fluctuations or periodic drops in the data being represented. The simplicity of the image highlights the concept of decline or reduction clearly and effectively. Decrease line graph illustrations Graphical representation of decreasing trend. The image depicts a red zigzag line that starts at the top left and ends with an arrow pointing downward at the bottom right. This line illustrates a downward trend or a decrease over time. The zigzag pattern indicates fluctuations or periodic drops in the data being represented. The simplicity of the image highlights the concept of decline or reduction clearly and effectively
Free with trial A red jagged line trending downward on a dark background with a white bar at the bottom. Decrease line graph illustrations A red downward trend line on a dark background. a red jagged line trending downward on a dark background with a white bar at the bottom
Free with trial A minimalist black icon depicting a business data chart. It features a bar graph with multiple vertical bars, overlaid by two distinct line graphs. One line graph shows an upward trend with data points, symbolizing growth and success, while the other illustrates a downward trend, representing decline or loss. This versatile vector illustration is ideal for conveying concepts related to financial analysis, market trends, business performance, statistics, and economic fluctuations. Perfect for web interfaces, presentations, reports, and infographics. Decrease line graph vectors Business Data Analysis Chart Icon with Trends. A minimalist black icon depicting a business data chart. It features a bar graph with multiple vertical bars, overlaid by two distinct line graphs. One line graph shows an upward trend with data points, symbolizing growth and success, while the other illustrates a downward trend, representing decline or loss. This versatile vector illustration is ideal for conveying concepts related to financial analysis, market trends, business performance, statistics, and economic fluctuations. Perfect for web interfaces, presentations, reports, and infographics.
Free with trial This graphic illustrates a sharp decline in financial value. A bold red line forms a jagged downward path, symbolizing a negative trend or loss. The line culminates in a red circle containing a white currency symbol, representing a monetary unit. The stark contrast between the red line and the white symbol against a clean white background emphasizes the concept of financial downturn and economic. Decrease line graph vectors A red downward trending graph with a coin symbol indicating financial loss. This graphic illustrates a sharp decline in financial value. A bold red line forms a jagged downward path, symbolizing a negative trend or loss. The line culminates in a red circle containing a white currency symbol, representing a monetary unit. The stark contrast between the red line and the white symbol against a clean white background emphasizes the concept of financial downturn and economic
Free with trial A stylized illustration depicts a downward trending graph alongside a factory and a person moving away, suggesting economic hardship and relocation, suitable for business reports and financial visuals. Decrease line graph vectors Economic decline graph with factory and person. A stylized illustration depicts a downward trending graph alongside a factory and a person moving away, suggesting economic hardship and relocation, suitable for business reports and financial visuals
Free with trial Model of house shot on graph depicting mortgage rates. image. Decrease line graph illustrations Model of house shot on graph depicting mortgage rates.
Free with trial Model of house shot on graph depicting mortgage rates. image. Decrease line graph illustrations Model of house shot on graph depicting mortgage rates.
Free with trial Set of twenty different business and finance icons, perfect for presentations, websites, and applications. These simple yet effective line icons represent key concepts in the business world. Decrease line graph vectors Collection of Business and Finance Line Icons. Set of twenty different business and finance icons, perfect for presentations, websites, and applications. These simple yet effective line icons represent key concepts in the business world.
Free with trial A versatile collection of flat vector icons illustrating concepts of decline, decrease, and loss. This set features various graphics, including downward-pointing arrows, negative trend line graphs, and falling bar charts in multiple colors. These symbols are perfect for representing financial crisis, economic recession, stock market crash, business failure, or any form of reduction. Ideal for use in infographics, presentations, financial reports, websites, and data visualization projects, these modern icons effectively communicate negative trends and downturns. Isolated on a white background for easy integration into any design. Decrease line graph illustrations Financial Decline and Recession Vector Icon Set. A versatile collection of flat vector icons illustrating concepts of decline, decrease, and loss. This set features various graphics, including downward-pointing arrows, negative trend line graphs, and falling bar charts in multiple colors. These symbols are perfect for representing financial crisis, economic recession, stock market crash, business failure, or any form of reduction. Ideal for use in infographics, presentations, financial reports, websites, and data visualization projects, these modern icons effectively communicate negative trends and downturns. Isolated on a white background for easy integration into any design.
Free with trial A 3D visualization of financial data, featuring a colorful pie chart and a series of bar graphs placed on top of a financial report document. The document also includes line graphs, illustrating various data trends and analyses. The composition is set against a white background. Decrease line graph illustrations 3D Bar Chart and Pie Chart on Financial Report with Line Graphs data statistics. A 3D visualization of financial data, featuring a colorful pie chart and a series of bar graphs placed on top of a financial report document. The document also includes line graphs, illustrating various data trends and analyses. The composition is set against a white background
Free with trial Trend Line and Candlestick Chart vector Crypto Trading concept colored icon or design element. Decrease line graph vectors Trend Line and Candlestick Chart vector Crypto Trading colored icon or design element
Free with trial Bar graph with tall, gray concrete blocks represents declining economic growth, highlighted by a descending red arrow. Set against a city skyline with prominent skyscrapers, including a tall one resembling the Empire State Building. Overcast skies add a somber tone, emphasizing the downturn theme. The blocks decrease in height from left to right, aligning with the arrow's trajectory. Decrease line graph illustrations Declining Economic Growth Graph Over City Skyline. Bar graph with tall, gray concrete blocks represents declining economic growth, highlighted by a descending red arrow. Set against a city skyline with prominent skyscrapers, including a tall one resembling the Empire State Building. Overcast skies add a somber tone, emphasizing the downturn theme. The blocks decrease in height from left to right, aligning with the arrow's trajectory.
Free with trial A 3D rendered blue arrow symbol, depicted as a zig-zag line with an arrowhead pointing downwards, signifies a negative trend or decline. The object is isolated on a clean white background, making it suitable for representing financial data, economic downturns, or performance metrics. Decrease line graph illustrations 3D Blue Arrow Graph Showing Downward Trend on White Background decrease. A 3D rendered blue arrow symbol, depicted as a zig-zag line with an arrowhead pointing downwards, signifies a negative trend or decline. The object is isolated on a clean white background, making it suitable for representing financial data, economic downturns, or performance metrics
Free with trial A conceptual image depicting a downward trend in the global economy and stock market, featuring a globe, gold coins, and a red declining graph line. Decrease line graph illustrations Global economy and stock market decline concept. A conceptual image depicting a downward trend in the global economy and stock market, featuring a globe, gold coins, and a red declining graph line
Free with trial A red arrow chart illustrates an economic recession and financial downturn. The arrow points downward, signifying a decline in the economy. The graph shows a decrease in financial value. Decrease line graph illustrations Simple Presentation of Red Arrow Depicting Economic Recession and Financial Downturn. A red arrow chart illustrates an economic recession and financial downturn. The arrow points downward, signifying a decline in the economy. The graph shows a decrease in financial value.
Free with trial Unemployment line icon of unemployed man on labor market, vector symbol. Economic crisis, global financial downturn and bankruptcy icon of economy recession and unemployment problem. Decrease line graph vectors Unemployment line icon, economic financial crisis. Unemployment line icon of unemployed man on labor market, vector symbol. Economic crisis, global financial downturn and bankruptcy icon of economy recession and unemployment problem
Free with trial A collection of six black depicting various business analytics charts and graphs, including bar charts, a pie chart, and line graphs on presentation boards. Decrease line graph vectors Black analytics chart and graph on white background. A collection of six black depicting various business analytics charts and graphs, including bar charts, a pie chart, and line graphs on presentation boards
Free with trial Set of black icons showing a digital clock, triangular shape within a square, bar chart with line graph overlay, atomic model, upward arrows, and a ruler with a downward arrow. Generative AI. Decrease line graph vectors Black digital clock triangle chart atom arrows and ruler icons. Set of black icons showing a digital clock, triangular shape within a square, bar chart with line graph overlay, atomic model, upward arrows, and a ruler with a downward arrow. Generative AI