Free with trial Set line Stop delivery cargo truck Dollar rate decrease Money bomb dollar crisis Hanging sign with Sale Mobile stock trading Drop crude oil price and Glass money jar coin icon. Vector. Decrease line graph illustrations Set line Stop delivery cargo truck, Dollar rate decrease, Money bomb dollar crisis, Hanging sign with Sale, Mobile stock. Set line Stop delivery cargo truck Dollar rate decrease Money bomb dollar crisis Hanging sign with Sale Mobile stock trading Drop crude oil price and Glass money jar coin icon. Vector.
Free with trial Stock market downturn red graph line falls financial crisis background business news illustration. Decrease line graph illustrations Financial Stock Market Chart Downward Trend, Recession, Economy Crisis Background. Stock market downturn red graph line falls financial crisis background business news illustration
Free with trial Continuous line drawing of percent symbol icon minimalist style isolate white background. Decrease line graph vectors Continuous line drawing of percent symbol icon minimalist style isolate
Free with trial Set Isometric line Briefcase, Mobile stock trading, Debt ball chained coin and Dollar rate decrease icon. Vector. Decrease line graph illustrations Set Isometric line Briefcase, Mobile stock trading, Debt ball chained coin and Dollar rate decrease icon. Vector
Free with trial Set line Dollar rate decrease Contract money and pen Briefcase Gold bars Falling property prices Mobile stock trading Debt ball chained coin and Stop delivery cargo truck icon. Vector. Decrease line graph illustrations Set line Dollar rate decrease, Contract money and pen, Briefcase, Gold bars, Falling property prices, Mobile stock. Set line Dollar rate decrease Contract money and pen Briefcase Gold bars Falling property prices Mobile stock trading Debt ball chained coin and Stop delivery cargo truck icon. Vector.
Free with trial Financial chart graphic with coins, blue bar graph, blurred orange line chart. Business profit, income growth, investment, financial analysis, marketing, economic saving money concept. Decrease line graph illustrations Financial chart graphic with coins, blue bar graph, blurred orange line chart. Business profit, income growth, investment
Free with trial Set line Dollar rate decrease, Broken piggy bank, Pie chart infographic and Drop crude oil price. Glowing neon icon. Vector. Decrease line graph illustrations Set line Dollar rate decrease, Broken piggy bank, Pie chart infographic and Drop crude oil price. Glowing neon icon
Free with trial Set line Bank building Shutdown of factory Prison cell door Dollar rate decrease Global economic crisis Employee dismissal Storm and Pie chart infographic icon. Vector. Decrease line graph vectors Set line Bank building, Shutdown of factory, Prison cell door, Dollar rate decrease, Global economic crisis, Employee. Set line Bank building Shutdown of factory Prison cell door Dollar rate decrease Global economic crisis Employee dismissal Storm and Pie chart infographic icon. Vector.
Free with trial Set line Global economic crisis Mobile stock trading Dollar rate decrease Shutdown of factory Safe Drop crude oil price and Calculation expenses icon. Vector. Decrease line graph vectors Set line Global economic crisis, Mobile stock trading, Dollar rate decrease, Shutdown of factory, Safe, Drop crude oil. Set line Global economic crisis Mobile stock trading Dollar rate decrease Shutdown of factory Safe Drop crude oil price and Calculation expenses icon. Vector.
Free with trial Set line Cloud computing lock Pie chart infographic Financial growth Search with folder Document and decrease icon. Vector. Decrease line graph illustrations Set line Cloud computing lock, Pie chart infographic, Financial growth, Search with folder, Document and decrease icon
Free with trial Set line Shutdown of factory Pie chart infographic Dollar rate decrease Employee dismissal Bank building Drop crude oil price and Tearing money banknote icon. Vector. Decrease line graph vectors Set line Shutdown of factory, Pie chart infographic, Dollar rate decrease, Employee dismissal, Bank building, Drop crude. Set line Shutdown of factory Pie chart infographic Dollar rate decrease Employee dismissal Bank building Drop crude oil price and Tearing money banknote icon. Vector.
Free with trial Abstract red background, black graph line, decline, instability, financial crisis. Symbolizes risk, uncertainty, downward trend. Can be used for display or montage your products. Generative AI. Decrease line graph illustrations Red Market Trend Abstract red background black graph line decline instability financial crisis Symbolizes risk uncertainty. Abstract red background, black graph line, decline, instability, financial crisis. Symbolizes risk, uncertainty, downward trend. Can be used for display or montage your products. Generative AI
Free with trial Set line Drop in crude oil price, Dollar rate decrease, Pie chart infographic and Prison cell door on seamless pattern. Vector. Decrease line graph vectors Set line Drop in crude oil price, Dollar rate decrease, Pie chart infographic and Prison cell door on seamless pattern
Free with trial Purple and gray light graph. Motion. A point moving along a graph line that goes up and down in animation. High quality 4k footage. Decrease line graph illustrations Purple and gray light graph. Motion.A point moving along a graph line that goes up and down in animation.
Free with trial Purple and gray light graph. Motion. A point moving along a graph line that goes up and down in animation. High quality 4k footage. Decrease line graph illustrations Purple and gray light graph. Motion.A point moving along a graph line that goes up and down in animation.
Free with trial Purple and gray light graph. Motion. A point moving along a graph line that goes up and down in animation. High quality 4k footage. Decrease line graph illustrations Purple and gray light graph. Motion.A point moving along a graph line that goes up and down in animation.
Free with trial Rising real estate cost concept. Row of toy houses with red graph line going down in background. Housing market crisis economic downturn and recession illustration. Affordable home. Decrease line graph illustrations Rising real estate cost concept. Row of toy houses with red graph line going down in background. Housing market crisis, economic. Rising real estate cost concept. Row of toy houses with red graph line going down in background. Housing market crisis economic downturn and recession illustration. Affordable home.
Free with trial Set line Drop in crude oil price Stop delivery cargo truck and Dollar rate decrease icon. Vector. Decrease line graph vectors Set line Drop in crude oil price, Stop delivery cargo truck and Dollar rate decrease icon. Vector
Free with trial Simple line art icon of a banner with a downward arrow symbolizing decrease or failure. Decrease line graph vectors Simple line art icon of a banner with a downward arrow symbolizing decrease or failure
Free with trial Gold bars with red downward financial graph and arrows. Concept of falling gold market price, economic crisis, and investment loss, vector illustration eps10. Decrease line graph vectors Gold bars with red downward financial graph and arrows. Concept of falling gold market price, economic crisis, and investment loss
Free with trial Abstract striped red falling financial graph chart background. Vector tech design. Decrease line graph vectors Abstract falling financial graph chart background. Abstract striped red falling financial graph chart background. Vector tech design
Free with trial Abstract blue green dotted financial graph chart sparkling background. Vector minimal tech design. Decrease line graph vectors Abstract dotted financial graph chart sparkling background. Abstract blue green dotted financial graph chart sparkling background. Vector minimal tech design
Free with trial Abstract financial chart with downtrend line graph and arrow in stock market on red color background. Decrease line graph illustrations Financial chart with downtrend line arrow in stock market on red color background. Abstract financial chart with downtrend line graph and arrow in stock market on red color background
Free with trial Line icon of decreasing chart representing reduced productivity, low performance, and efficiency decline. Suitable for business, work, stress, and health related topics. Decrease line graph vectors Reduced Productivity Icon Decrease Performance Efficiency Decline Symbol. Line icon of decreasing chart representing reduced productivity, low performance, and efficiency decline. Suitable for business, work, stress, and health related topics.
Free with trial Line icon of decreasing chart representing reduced productivity, low performance, and efficiency decline. Suitable for business, work, stress, and health related topics. Decrease line graph vectors Reduced Productivity Icon Decrease Performance Efficiency Decline Symbol black. Line icon of decreasing chart representing reduced productivity, low performance, and efficiency decline. Suitable for business, work, stress, and health related topics.
Free with trial Line chart graph showing downward trend movement. Decrease line graph vectors Downtrend line chart. Line chart graph showing downward trend movement.
Free with trial Downward line chart representing consistent decrease in financial metrics. Decrease line graph vectors Downward chart line trend. Downward line chart representing consistent decrease in financial metrics.
Free with trial Housing Market and Policy Trends: House with Person Inside and Graphs Going Up and Down with an Arrow Thin Line Icon, Vector Illustration for Real Estate and Socioeconomic Analysis Graphic. Decrease line graph vectors Housing Market and Policy Trends: House with Person Inside and Graphs Going Up and Down with an Arrow Thin Line Icon, Vector
Free with trial Abstract financial crisis background featuring a red line graph plunging downward on a digital grid. Symbolizing stock market crash, economic recession, business failure, and bankruptcy risk. Professional 3D render for finance, investment, and global economy concepts. Decrease line graph illustrations Financial stock market crash and economic crisis concept with red falling graph. Abstract financial crisis background featuring a red line graph plunging downward on a digital grid. Symbolizing stock market crash, economic recession, business failure, and bankruptcy risk. Professional 3D render for finance, investment, and global economy concepts.
Free with trial Financial Graph Decline icon vector image. Suitable for mobile application web application and print media. Decrease line graph vectors Financial Graph Decline icon vector image.
Free with trial A person meticulously studies complex financial or historical data displayed on a paper chart. The brass-rimmed magnifying glass highlights crucial upticks and downward trends in the graph line. Rendered by Ai. This scene captures the essence of deep research, analysis, and discovery in a vintage setting. Decrease line graph illustrations Magnifying glass focused on a detailed stock chart. A person meticulously studies complex financial or historical data displayed on a paper chart. The brass-rimmed magnifying glass highlights crucial upticks and downward trends in the graph line. Rendered by Ai. This scene captures the essence of deep research, analysis, and discovery in a vintage setting
Free with trial A minimalist, black and white vector illustration depicting a financial graph with a clear downward trend. The graph features a jagged line representing fluctuating data, leading into a bold, thick arrow pointing downwards and to the right. This icon symbolizes decline, loss, recession, or negative performance in various contexts, such as business, economics, or stock markets. Its clean design makes it versatile for presentations, websites, and infographics. Decrease line graph vectors Downward Trend Graph with Arrow Icon. A minimalist, black and white vector illustration depicting a financial graph with a clear downward trend. The graph features a jagged line representing fluctuating data, leading into a bold, thick arrow pointing downwards and to the right. This icon symbolizes decline, loss, recession, or negative performance in various contexts, such as business, economics, or stock markets. Its clean design makes it versatile for presentations, websites, and infographics.
Free with trial Downward graph trend with red points, sad face, and a file folder suggests failure, loss, or poor performance. Ideal for business, data, analysis, decline management error simple flat metaphor. Decrease line graph vectors Declining Graph with Sad Face Emphasizing Negative Analytics and Data Loss. Downward graph trend with red points, sad face, and a file folder suggests failure, loss, or poor performance. Ideal for business, data, analysis, decline management error simple flat metaphor
Free with trial Downward trending line graph with sad face emotion, classic phone icon, and computer monitor. Ideal for business loss, analytics, communication issues, technology, finance, statistics simple flat. Decrease line graph vectors Declining Sales Graph with Sad Face, Phone Icon, and Monitor Display. Downward trending line graph with sad face emotion, classic phone icon, and computer monitor. Ideal for business loss, analytics, communication issues, technology, finance, statistics simple flat
Free with trial A professional collection of 16 business and financial icons featuring various bar charts and line graphs. Perfect for UI dashboards, corporate presentations, and data-heavy infographics showing market growth or decline. Decrease line graph vectors Business Growth Bar Charts and Financial Trend Line Graph Vector Icons Set. A professional collection of 16 business and financial icons featuring various bar charts and line graphs. Perfect for UI dashboards, corporate presentations, and data-heavy infographics showing market growth or decline.
Free with trial A professional collection of 16 business and financial icons featuring various bar charts and line graphs. Perfect for UI dashboards, corporate presentations, and data-heavy infographics showing market growth or decline. Decrease line graph vectors Business Growth Bar Charts and Financial Trend Line Graph Vector Icons Set. A professional collection of 16 business and financial icons featuring various bar charts and line graphs. Perfect for UI dashboards, corporate presentations, and data-heavy infographics showing market growth or decline.
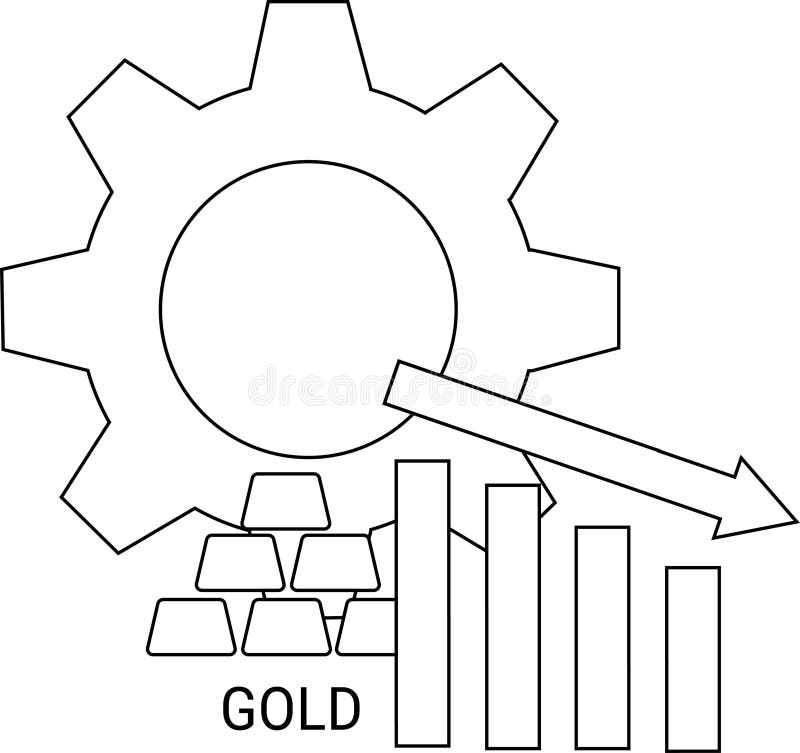
Free with trial Conceptual diagram depicting a decrease in gold production. Decrease line graph illustrations Gold Production Decrease Gear, Bars, Arrow Concept. Conceptual diagram depicting a decrease in gold production.
Free with trial Downward arrow icon set. Decrease direction symbol. Reduction indicator sign vector. Decrease line graph vectors Downward arrow icon set. Decrease direction symbol. Reduction indicator sign
Free with trial A simple line drawing of a hand with two speech bubbles, one containing a downward trending bar graph and the other a. Decrease line graph illustrations Hand discussing financial decline with money. A simple line drawing of a hand with two speech bubbles, one containing a downward trending bar graph and the other a.
Free with trial Stack of bitcoin coins. in background a graph showing decrease in value. Falling of cryptocurrency. Decrease line graph vectors Bitcoin, cryptocurrency falling graph, risk, crash, collapse of BTC. Stack of bitcoin coins. in background a graph showing decrease in value. Falling of cryptocurrency.
Free with trial This minimalist illustration depicts a downward trending graph superimposed with two stylized power pylons. A vibrant green leaf is positioned near the end of the graph, symbolizing the shift towards renewable or sustainable energy sources. The composition suggests a decline in traditional energy infrastructure or consumption, with an implied transition to eco-friendly alternatives. Ideal for concepts related to energy policy, environmental impact, economic shifts in the power sector, and the future of electricity. Decrease line graph vectors Green Energy Transition and Power Grid Decline Graph. This minimalist illustration depicts a downward trending graph superimposed with two stylized power pylons. A vibrant green leaf is positioned near the end of the graph, symbolizing the shift towards renewable or sustainable energy sources. The composition suggests a decline in traditional energy infrastructure or consumption, with an implied transition to eco-friendly alternatives. Ideal for concepts related to energy policy, environmental impact, economic shifts in the power sector, and the future of electricity.
Free with trial Business performance, negative trends, data analysis, economic decline, search results, user concerns. Sad emoticon, graph with downward trend magnifying glass. Business and negative trends. Decrease line graph vectors Declining Graph with Sad Face and Search Bar Negative Trends and Analysis. Business performance, negative trends, data analysis, economic decline, search results, user concerns. Sad emoticon, graph with downward trend magnifying glass. Business and negative trends
Free with trial Set of vector line icons related to loan, bank credit rate, finance and investment. Symbols for website or app ui, logo design, illustration. Decrease line graph vectors Vector line icons of money credit and loan. Set of vector line icons related to loan, bank credit rate, finance and investment. Symbols for website or app ui, logo design, illustration
Free with trial Finance concept simple line icons set. Pack outline pictograms of deposit, growth, briefcase, secure, atm, insurance, banking, wallet, cash and other. Symbols for website and mobile app design. Decrease line graph illustrations Finance concept simple line icons set. Pack outline pictograms of deposit, growth, briefcase, secure, atm, insurance, banking
Free with trial The image depicts a bar graph with a downward trend. The bars start at a higher value and progressively decrease, indicating a decline. An arrow at the end of the graph further emphasizes the downward direction. Decrease line graph illustrations Decreasing bar graph. The image depicts a bar graph with a downward trend. The bars start at a higher value and progressively decrease, indicating a decline. An arrow at the end of the graph further emphasizes the downward direction
Free with trial Cardboard box with label beside a fluctuating line graph, denoting analytics, efficiency, shipment tracking, or delivery trends. Ideal for logistics, e-commerce, data trends, analysis operations. Decrease line graph vectors Box with Shipping Label and Data Graph Representing Logistics and Performance Trends. Cardboard box with label beside a fluctuating line graph, denoting analytics, efficiency, shipment tracking, or delivery trends. Ideal for logistics, e-commerce, data trends, analysis operations
Free with trial Web Browser sale graph down Tool flat icon design isolated on a white background. Decrease line graph vectors Web Browser sale graph down Tool flat icon design
Free with trial Line graph with downward trend and red markers, sad face symbolizing disappointment, outlined clouds indicating challenges. Ideal for analysis, business, growth, crisis, finance, performance or. Decrease line graph vectors Declining Graph with Sad Face and Clouds Representing Negative Trends and Challenges. Line graph with downward trend and red markers, sad face symbolizing disappointment, outlined clouds indicating challenges. Ideal for analysis, business, growth, crisis, finance, performance or
Free with trial A comprehensive set of vector line icons depicting bull and bear market trends. This collection features various combinations of bull and bear silhouettes integrated with financial charts, including rising and falling line graphs and bar graphs. Each icon clearly symbolizes either a bullish market (growth, upward trend) or a bearish market (decline, downward trend). Ideal for financial websites, trading applications, investment presentations, economic reports, infographics, and educational materials illustrating stock market dynamics and investment strategies. Decrease line graph vectors Bull and Bear Market Stock Trading Line Icons Set. A comprehensive set of vector line icons depicting bull and bear market trends. This collection features various combinations of bull and bear silhouettes integrated with financial charts, including rising and falling line graphs and bar graphs. Each icon clearly symbolizes either a bullish market (growth, upward trend) or a bearish market (decline, downward trend). Ideal for financial websites, trading applications, investment presentations, economic reports, infographics, and educational materials illustrating stock market dynamics and investment strategies.
Free with trial Abstract green line graph on black background. Stock photo of financial chart. Decrease line graph illustrations Vibrant Green Lightning Bolt on Black Background, Electric Energy Discharge. Abstract green line graph on black background. Stock photo of financial chart
Free with trial A simple line style icon of a falling chart displayed on a computer monitor, symbolizing financial loss or decline. Decrease line graph vectors Line Style Simple Falling Chart on Monitor Display Icon Symbol. A simple line style icon of a falling chart displayed on a computer monitor, symbolizing financial loss or decline.
Free with trial Someone is taking notes, the graph looks down. Decrease line graph illustrations Is recording a downward graph. someone is taking notes, the graph looks down
Free with trial The image depicts a bar graph with a downward trend. The graph shows a series of bars representing value over time. The value starts high and gradually decreases, indicating a decline over the period measured. The x-axis is labeled 'Time' and the y-axis is labeled 'Value'. The bars are red, and a red arrow at the end of the line graph emphasizes the downward trend. Decrease line graph illustrations Decreasing value over time. The image depicts a bar graph with a downward trend. The graph shows a series of bars representing value over time. The value starts high and gradually decreases, indicating a decline over the period measured. The x-axis is labeled 'Time' and the y-axis is labeled 'Value'. The bars are red, and a red arrow at the end of the line graph emphasizes the downward trend
Free with trial Bold red downward graph arrow 2D cartoon object. Trend market decline. Descending line chart. Business loss. Economic downturn isolated element flat vector clip art on white. Spot illustration. Decrease line graph vectors Bold red downward graph arrow 2D cartoon object
Free with trial Statistic Bar Chart Outline Sign Data Stats Business Performance Market Analysis Economic Trend Line Icon Presentation Display Board Symbol. Decrease line graph vectors Statistic Bar Chart Outline Sign Data Stats Business Performance Market Analysis Economic Trend Line Icon Presentation Display
Free with trial Set of vector line icons related to loan, bank credit rate, finance and investment. Symbols for website or app UI, logo design, illustration. Decrease line graph vectors Vector line icons of money credit and loan. Set of vector line icons related to loan, bank credit rate, finance and investment. Symbols for website or app UI, logo design, illustration
Free with trial Economic crisis icon of stock market crash and global financial downturn, line vector. Stock exchange market index fall down with money inflation and devaluation in economic crisis and trade recession. Decrease line graph vectors Economic crisis line icon of stock market crash. Economic crisis icon of stock market crash and global financial downturn, line vector. Stock exchange market index fall down with money inflation and devaluation in economic crisis and trade recession
Free with trial Abstract illustration of a financial graph with glowing lines on a dark background. The graph shows two distinct curves, one starting in cool blue tones and transitioning to warm orange hues, suggesting a shift in market trends or performance. The image conveys concepts of data analysis, growth, decline, and financial forecasting. Suitable for illustrating business reports, presentations, or articles related to finance, investment, and economics. Decrease line graph illustrations Abstract Financial Graph Illustration. Abstract illustration of a financial graph with glowing lines on a dark background. The graph shows two distinct curves, one starting in cool blue tones and transitioning to warm orange hues, suggesting a shift in market trends or performance. The image conveys concepts of data analysis, growth, decline, and financial forecasting. Suitable for illustrating business reports, presentations, or articles related to finance, investment, and economics.
Free with trial Single line art illustration of classic percent symbol isolated outline white background. Decrease line graph vectors Single line art illustration of classic percent symbol isolated outline
Free with trial Percent sign simple outline single line art illustration isolated design vector art. Decrease line graph vectors Percent sign simple outline single line art illustration isolated design
Free with trial A vibrant pink 3D bar chart illustrates financial data with a prominent downward-trending arrow superimposed. The bars decrease in height from left to right, signifying a decline. An upward-pointing arrow is positioned at the top left, indicating a contrasting upward trend. The graphic is isolated on a white background, making it suitable for presentations on financial performance, market trends,. Decrease line graph illustrations 3D Pink Bar Chart with Downward Trend Arrow and Upward Trend Arrow graph statistics. A vibrant pink 3D bar chart illustrates financial data with a prominent downward-trending arrow superimposed. The bars decrease in height from left to right, signifying a decline. An upward-pointing arrow is positioned at the top left, indicating a contrasting upward trend. The graphic is isolated on a white background, making it suitable for presentations on financial performance, market trends,
Free with trial Percent icon continuous one line drawing minimalist style isolate outline white background. Decrease line graph vectors Continuous one line drawing minimalist style isolate outline percent icon. Percent icon continuous one line drawing minimalist style isolate outline white background
Free with trial This image showcases a large collection of minimalist, line-style icons representing various charts and graphs. These icons depict data visualization elements commonly used in business, analytics, and reporting. high-quality professional. Decrease line graph vectors Collection of diverse line style charts and graphs icons displayed neatly. This image showcases a large collection of minimalist, line-style icons representing various charts and graphs. These icons depict data visualization elements commonly used in business, analytics, and reporting. high-quality professional
Free with trial A bold black line charts a significant downward trajectory, indicating a sharp decline, against a subtle grid. Decrease line graph illustrations A jagged downward trend line illustrates a sharp decline on a grid background. A bold black line charts a significant downward trajectory, indicating a sharp decline, against a subtle grid
Free with trial Simple outline illustration of percent sign continuous single line drawing white background. Decrease line graph vectors Simple outline illustration continuous single line drawing of percent sign. Simple outline illustration of percent sign continuous single line drawing white background
Free with trial Abstract dotted financial graph chart sparkling background. Vector minimal tech design. Decrease line graph vectors Abstract dotted financial graph chart sparkling background
Free with trial Minimalist percent sign continuous line drawing icon symbol isolate element white background. Decrease line graph vectors Minimalist percent sign continuous line drawing icon symbol isolate element
Free with trial Percentage symbol simple single line art drawing outline illustration minimal vector art. Decrease line graph vectors Percentage symbol simple single line art drawing outline illustration minimal
Free with trial A collection of five distinct black and white graphic representations of data. From left to right, the first is a line graph with dots, showing fluctuations. The second is a zig-zag line graph with dots and an upward arrow. The third is a series of ascending vertical bars. The fourth is a bar chart with a single dot above one of the bars. The fifth is a pie chart divided into four sections, with. Decrease line graph vectors Collection of black and white business and data charts and graphs statistics analytics. A collection of five distinct black and white graphic representations of data. From left to right, the first is a line graph with dots, showing fluctuations. The second is a zig-zag line graph with dots and an upward arrow. The third is a series of ascending vertical bars. The fourth is a bar chart with a single dot above one of the bars. The fifth is a pie chart divided into four sections, with
Free with trial Red glowing line graph with scattered particles illustrating financial decline, economic crisis, recession, or stock market crash. Decrease line graph illustrations Falling red data line showing market crash. Red glowing line graph with scattered particles illustrating financial decline, economic crisis, recession, or stock market crash
Free with trial A 3D rendered image depicting a financial graph with a prominent red arrow indicating a downward trend. The graph features a bar chart with several red bars, showing a decline in value. The background is a dark grid, emphasizing the data visualization. This image is ideal for representing financial losses, economic downturns, market crashes, or negative performance in business and investment contexts. Decrease line graph illustrations Red Arrow Downward Trend Graph with Bar Chart. A 3D rendered image depicting a financial graph with a prominent red arrow indicating a downward trend. The graph features a bar chart with several red bars, showing a decline in value. The background is a dark grid, emphasizing the data visualization. This image is ideal for representing financial losses, economic downturns, market crashes, or negative performance in business and investment contexts.
Free with trial Economic recession, business owner seated on a falling down bar graph and a red arrow. Decrease line graph vectors Economic recession, business owner seated on a falling down bar graph and a red arrow.
Free with trial Economic crisis icon of price low down or stock market depreciation, vector line symbol. Global economy and business downturn with financial crisis and prices decrease or percent down low. Decrease line graph illustrations Economic crisis icon, price low down, stock market. Economic crisis icon of price low down or stock market depreciation, vector line symbol. Global economy and business downturn with financial crisis and prices decrease or percent down low
Free with trial Economic crisis icon, analysis of global market economy downturn and bankruptcy, vector line symbol. Magnifier and arrow down icon of stock exchange and economical index decrease of financial crisis. Decrease line graph vectors Economic crisis icon, analysis of market downturn. Economic crisis icon, analysis of global market economy downturn and bankruptcy, vector line symbol. Magnifier and arrow down icon of stock exchange and economical index decrease of financial crisis
Free with trial Circular chart icon presenting a bar graph visualizing statistical data, analytics, and business reports, symbolizing financial decline, data analysis, and market trends. Decrease line graph vectors Circular chart icon showing declining bar graph. Circular chart icon presenting a bar graph visualizing statistical data, analytics, and business reports, symbolizing financial decline, data analysis, and market trends
Free with trial Decline bar chart with downward trend arrow outline icon vector. Decrease, loss, and financial drop symbol in black circle. Decrease line graph vectors Decline bar chart with downward trend arrow outline icon. Decrease, loss, and financial drop symbol in black circle
Free with trial This 3D render depicts a stark red downward trend line superimposed over a grid background, with a bar chart showing declining values. The composition visually represents financial loss, economic downturn, market crash, or negative performance. The bold red color and sharp angles convey urgency and a sense of crisis, making it ideal for illustrating concepts related to business failure, stock market decline, or any situation involving a significant negative trajectory. Decrease line graph illustrations Red Downward Trend Graph with Bar Chart. This 3D render depicts a stark red downward trend line superimposed over a grid background, with a bar chart showing declining values. The composition visually represents financial loss, economic downturn, market crash, or negative performance. The bold red color and sharp angles convey urgency and a sense of crisis, making it ideal for illustrating concepts related to business failure, stock market decline, or any situation involving a significant negative trajectory.
Free with trial A close-up view of a red stock market chart displaying a strong downward trend. Candlestick bars and a fluctuating line graph indicate a significant decline in stock prices. Red arrows point downwards, emphasizing the negative movement. The background is dark with a subtle grid pattern and a bright light source on the left. Decrease line graph illustrations Red Stock Market Chart Showing Downward Trend graph. A close-up view of a red stock market chart displaying a strong downward trend. Candlestick bars and a fluctuating line graph indicate a significant decline in stock prices. Red arrows point downwards, emphasizing the negative movement. The background is dark with a subtle grid pattern and a bright light source on the left
Free with trial A cartoon-style illustration of a bar graph displayed on a presentation screen. The graph shows three bars of different heights and colors (green, orange, and yellow), indicating growth or progress. The image is clean and simple, suitable for illustrating business, finance, or educational concepts in a visually appealing way. Decrease line graph illustrations Cartoon Bar Graph Presentation. A cartoon-style illustration of a bar graph displayed on a presentation screen. The graph shows three bars of different heights and colors (green, orange, and yellow), indicating growth or progress. The image is clean and simple, suitable for illustrating business, finance, or educational concepts in a visually appealing way.
Free with trial This vector graphic depicts declining performance with a gear, descending graph, downward arrow, and a 24-hour clock. Decrease line graph illustrations Declining Performance Gear, Graph, Arrow, 24 Hours Icon. This vector graphic depicts declining performance with a gear, descending graph, downward arrow, and a 24-hour clock.